Knowledge Center Technical Analysis
Candlestick Patterns
Types of Candlestick Pattern
Introduction
Candlestick patterns are essential tools in technical analysis, visually representing price movements and signalling potential changes in market direction. In the realm of technical analysis, candlestick pattern names are employed to distinguish between different types of candlesticks patterns.
Types of Candlestick Pattern
Let’s explore types of candlesticks and their meaning.
Doji Candlestick Pattern:
A Doji occurs when the opening and closing prices are almost identical, forming a small horizontal line. It signals market indecision and potential reversal.
There are four types of Doji candlestick:
|
Standard or Star Doji |
|
wicks are shorter , similar length both up and down |
|
Long-legged Doji |
|
wicks are longer, similar length both up and down |
|
Dragonfly Doji |
|
lower wick is longer |
|
Gravestone Dojis |
|
no or very short wicks. |
Hammer Candlestick Pattern:
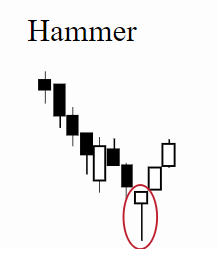
The Hammer is abullish reversal pattern with a small body at the top and a long lower shadow. It suggests that sellers drove the price down initially but were overwhelmed by buyers by the close. The Hanging Man is a bearish counterpart.

Shooting Star / Bearish Inverted Hammer Candlestick Pattern.
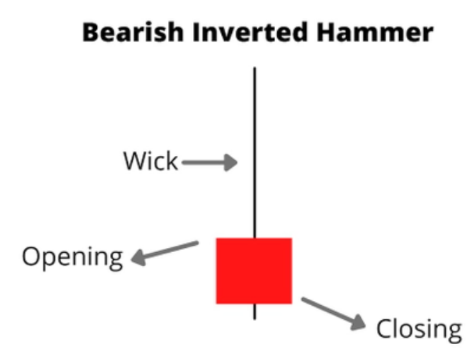
The Shooting Star is a bearish reversal (inverted) pattern characterized by a small body at the bottom and a long upper shadow. It indicates that buyers initially pushed prices higher but encountered strong selling pressure. It is also called the Bearish Inverted Hammer candlestick pattern. As the Shooting Star candlestick is a singular pattern, it does not have various types.
Bullish and Bearish Engulfing Candlestick Pattern:
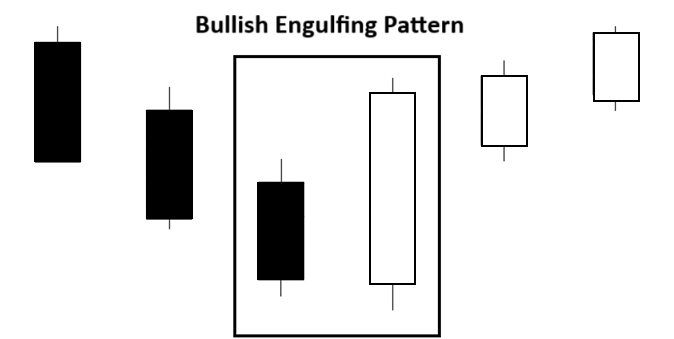
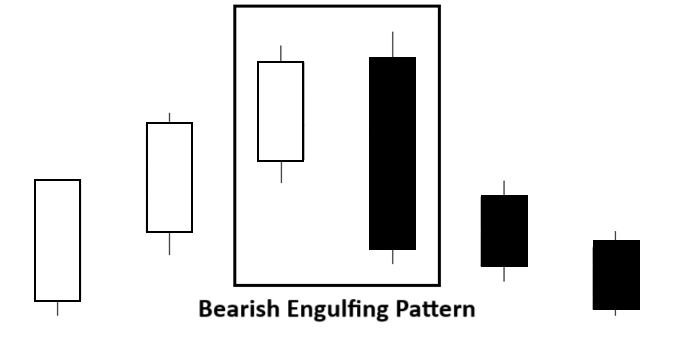
Bullish Engulfing occurs in a downtrend, where a small bearish candle is followed by a larger bullish candle that engulfs it. The opposite is true for Bearish Engulfing, signalling a potential reversal in an uptrend.
Morning Star Candlestick Pattern:
A Morning Star is a bullish reversal pattern. It starts with a bearish candle, followed by a small-bodied candle or Doji, and then a bullish candle. It suggests a shift from a downtrend to an uptrend.
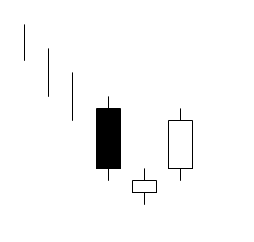
Evening Star Candlestick Pattern:
The Evening Star is a bearish reversal pattern opposite to the Morning Star. It begins with a bullish candle, followed by a small-bodied candle, and ends with a bearish candle. It indicates a potential shift from an uptrend to a downtrend.
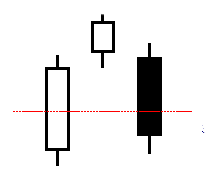
Harami Candlestick Pattern:
The Harami consists of a large candle followed by a smaller candle within the range of the first. It signals potential trend reversal or a pause in the prevailing trend. There are Bullish and Bearish Harami patterns.
Piercing Candlestick Pattern:
The Piercing Pattern is a bullish reversal pattern opposite to the Dark Cloud Cover. It occurs after a downtrend, where a bearish candle is followed by a bullish candle that opens below the previous close and closes above the midpoint.
Understanding these candlestick patterns is crucial for technical analysis, helping traders identify potential trend reversals, continuations, or market indecision.
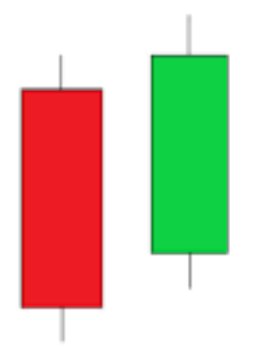
Three Black Crows Candlestick Pattern
The Three Black Crows is a bearish candlestick pattern in technical analysis, consisting of three consecutive long black (or red) candlesticks with lower closes, signalling a potential reversal of an uptrend. Each candle opens within the body of the previous one, suggesting increasing selling pressure and a shift towards a downtrend. Traders often interpret this pattern as a strong bearish signal.

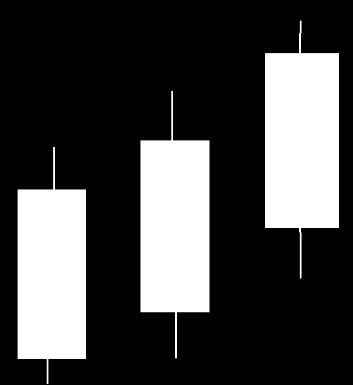
Three white soldiers Candlestick Pattern
The Three White Soldiers is a bullish candlestick pattern characterized by three consecutive long white (or green) candlesticks with higher closes. This pattern suggests a strong reversal of a downtrend, indicating increasing buying pressure and potential further upward movement. Traders often view Three White Soldiers as a positive signal for a bullish trend.
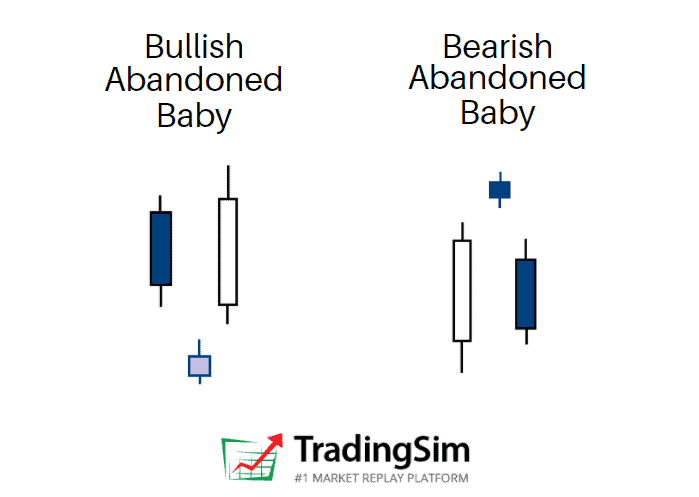
Bullish and Bearish Abandoned Baby Candlestick Pattern:
Bullish Abandoned Baby: A bullish reversal pattern formed by a gap down, followed by a doji that indicates indecision, and completed by a gap up, signalling a potential uptrend, often considered a strong reversal signal.
Bearish Abandoned Baby: A bearish reversal pattern characterized by a gap up, followed by a doji representing indecision, and concluded by a gap down, suggesting a potential downtrend, often seen as a robust signal for a reversal in an uptrend.
Spinning Top Candlestick Pattern
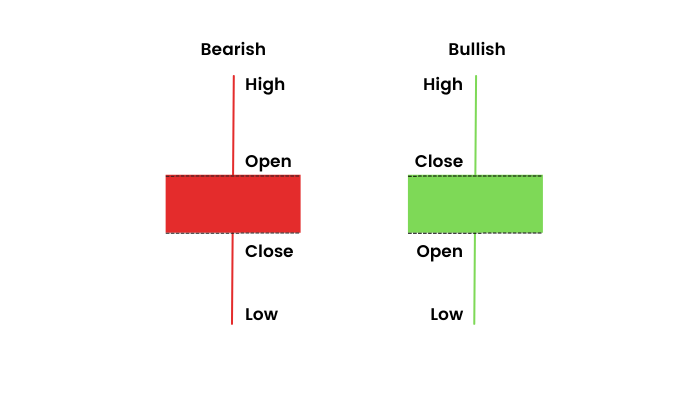
A spinning top candlestick consists of a small, narrow body with upper and lower wicks (shadows or tails) of roughly equal length (vertical line). The body can be either bullish (green or white) or bearish (red or black) (horizontal line).
Marubozu Candlestick Pattern
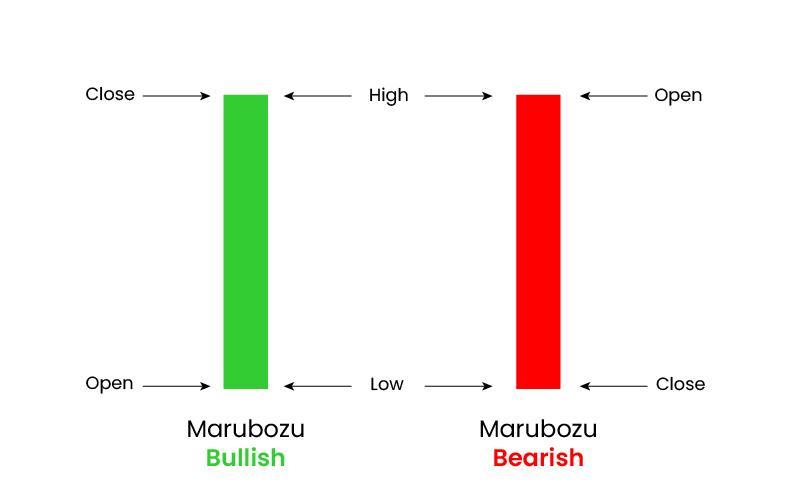
The Marubozu candlestick is characterized by its long body with either no upper or lower wick, indicating that either buyers (bulls) or sellers (bears) have full control of the market during the entire trading session.
Frequently Asked Questions
How many types of candlestick patterns are there in technical analysis? List them
There are numerous candlestick patterns used in technical analysis. Some of the widely used patterns are Doji, Hammer, Shooting Star, Engulfing Patterns (Bullish and Bearish), Morning Star, Evening Star, Harami (Bullish and Bearish), Dark Cloud Cover, Piercing Pattern, Three White Soldiers, Three Black Crows, Hanging Man, Inverted Hammer, Gravestone Doji, Marubozu (Bullish and Bearish), Tweezer Tops and Bottoms, Bullish and Bearish Belt Hold, Rising Three Methods, Falling Three Methods.
Which are single candlestick patterns?
Single candlestick patterns are Doji, Marubozu, Spinning Top, Hammer, Shooting Star, Hanging Man, Inverted Hammer
Which are triple candlestick patterns?
Triple or three candlestick patterns often provide more robust signals and include formations like: Three White Soldiers, Three Black Crows, Morning Star, Evening Star, Three Inside Up, Three Inside Down.
Which are double candlestick patterns?
Double candlestick patterns consist of two consecutive candles and are often used in technical analysis to signal potential changes in market direction. Here are some common double candlestick patterns:
Bullish engulfing, Bearish engulfing, Tweezer tops, Tweezer bottoms, Dark Cloud Cover, Piercing Pattern, Harami Cross.
What is the difference between bullish engulfing and bullish harami?
Bullish Engulfing: A two-candle pattern where the second bullish candle completely engulfs the prior bearish candle, signalling a potential trend reversal.
Bullish Harami: Also, a two-candle pattern, but the second candle is a smaller bullish one within the range of the preceding larger bearish candle, suggesting a potential reversal with less conviction than the Bullish Engulfing pattern.
What is the difference between an inverted hammer and shooting star?
Inverted Hammer: Occurs at the bottom of a downtrend, with a small body at the top and a long lower shadow, suggesting a potential bullish reversal.
Shooting Star: Appears at the top of an uptrend, featuring a small body at the bottom and a long upper shadow, indicating a potential bearish reversal.
Difference: While both suggest reversals, the Inverted Hammer signals a potential bullish turnaround, whereas the Shooting Star indicates a potential bearish reversal in an uptrend
How many types of hammer candlestick patterns are there?
The primary variations in hammer candlestick pattern are hammer, inverted hammer and hanging man.
