Knowledge Center Technical Analysis
Candlestick Patterns
Bullish Bearish Abandoned Baby Candlestick Pattern
Overview
Abandoned Baby Pattern
-
It is a three-bar candlestick reversal pattern
-
Similar to morning and evening star candlestick pattern
-
Unique & reliable candlestick pattern, occurs after a sharp rise or fall in price.
-
Also similar to island reversal pattern
-
Consists of a large price gap, a doji candle and then another gap in opposite directions.
-
Suggests that a sudden shift in market sentiment and potential trend reversal.
-
Traders interpret the pattern as a signal of change in the existing trend.

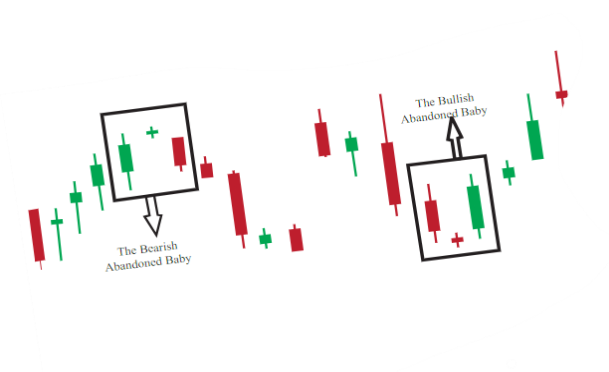
From the above image, it is observed that
-
The first candlestick aligns with the main trend.
-
The second candle, a doji, has a gap in the primary trend direction, with no overlap in its real body or shadow with the prior candle.
-
The third candle shifts in the opposite direction of the first day and has a gap in the opposite direction of the doji.
Bullish Abandoned Baby Candlestick Chart Pattern
-
This pattern signals a reversal to an uptrend and is used to make buy entry positions by traders.
-
Formed at the end of a downtrend.
-
First candle is a large bearish candle, second a Doji candle with a gap down and third is a Bullish candle higher than Doji.
-
After the pattern formation, traders expect that the price will move up in trend.
Abandoned Baby Bearish Candlestick Patterns
-
This pattern signals a reversal to a downtrend and is used to make an exit from buy position and to enter a short sell position by traders.
-
Formed at the end of an uptrend.
-
First candle is a large bullish candle. Second is a Doji with a gap up and third is a Bearish Candle lower than Doji.
-
After the pattern formation, traders expect that the price will move down in the trend.
Bullish Abandoned Baby Candlestick Pattern
The Abandoned Baby Bullish is a three-candlestick pattern that signals a potential reversal from a downtrend to an uptrend. It is considered a reliable indicator of a bullish reversal in technical analysis.
How It Looks Like:
-
Candle 1 (Bearish): The pattern begins with a strong bearish candle, indicating a prevailing downtrend.
-
Candle 2 (Doji): The second candle is a Doji, characterized by a small real body that opens with a gap down, creating a separation from the previous bearish candle.
-
Candle 3 (Bullish): The third candle is a strong bullish candle, opening with a gap up, and confirming the potential reversal.
The Bullish Abandoned Baby suggests a shift in market sentiment from bearish to bullish. The gap down in the Doji reflects a period of uncertainty or indecision, and the subsequent gap up indicates a sudden influx of bullish momentum, often catching bears off guard.
When it is formed?
When the forces of selling commodities shift to buying commodities, this pattern rises. The traders expect a trend change in accordance with psychological and fundamental factors. Remember, we don't find an overlap between the first and third candle in this Bullish Abandoned Baby pattern. A gap is found as a result when the buyers and sellers try to push the prices.
How to Interpret:
-
Confirmation of Downtrend: The pattern should occur in a well-defined downtrend to be considered valid.
-
Isolation of Doji: The Doji should be clearly separated from the preceding and following candles with gaps.
-
Volume Analysis: Increasing volume during the bullish candle adds strength to the potential reversal.
How to Trade:
-
Entry: Enter a long position at the opening of the candle following the bullish candle, confirming the reversal.
-
Stop Loss: Place a stop-loss order below the low of the Doji candle to manage risk.
-
Target: Set a target based on previous levels of support or resistance.
Bearish Abandoned Baby Candlestick Chart Pattern
The bearish abandoned baby candlestick pattern that indicates a potential reversal of an uptrend. It is a three-candle pattern with a distinct gap, suggesting a shift in market sentiment from bullish to bearish.
How does it look like:
First Candle: An uptrend candle.
Second Candle: A Doji or a small candle with a gap up, isolating itself from the prior uptrend candle.
Third Candle: A downtrend candle, confirming the potential bearish reversal.
What does it mean:
The bearish abandoned baby pattern signals a weakening of the existing uptrend and a potential reversal to a downtrend. The gap before and after the Doji indicates a moment of indecision in the market, followed by a decisive move towards the downside.
When it is formed?
When the forces of buying commodities shift to selling commodities, this pattern rises. The traders expect a trend change in accordance with psychological and fundamental factors.
How to interpret:
The uptrend candle reflects the prevailing bullish sentiment.
The Doji with a gap up suggests uncertainty and a potential loss of bullish control.
The subsequent downtrend candle confirms the shift to bearish sentiment.
How to trade:
Confirmation: Wait for confirmation of the pattern with the completion of the third candle.
Volume: Confirm the pattern with an increase in volume, indicating strong selling pressure.
Entry: Consider entering a short position at the opening of the candle following the bearish abandoned baby pattern.
Stop-Loss: Set a stop-loss above the high of the Doji to manage risk.
Target: Identify potential support levels as profit targets, aiming for a favourable risk-reward ratio.
Trading Examples
Bullish Abandoned Baby Candlestick Chart Pattern
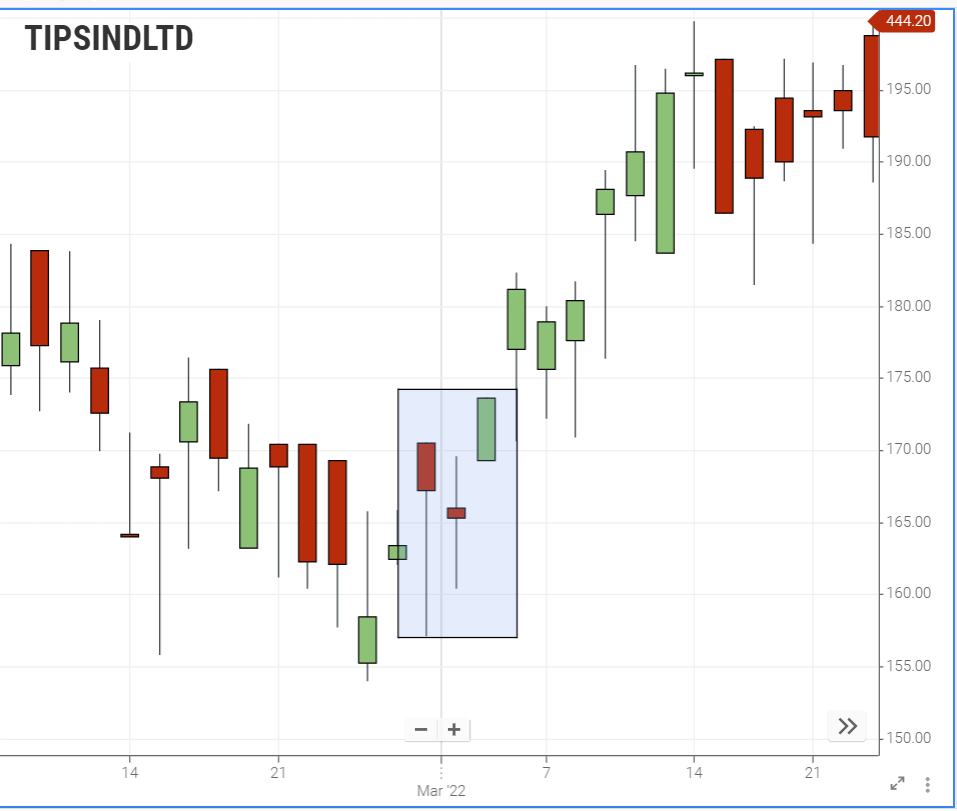
Consider the below chart

There is a clear downtrend in price which is followed by a Doji candle. After a gap, the Third candle which was formed is identified to be a bullish abandoned baby candle pattern. After the identified reversal pattern, the price of the stock is found to be in a strong uptrend.
Bearish Abandoned Baby Candlestick Pattern
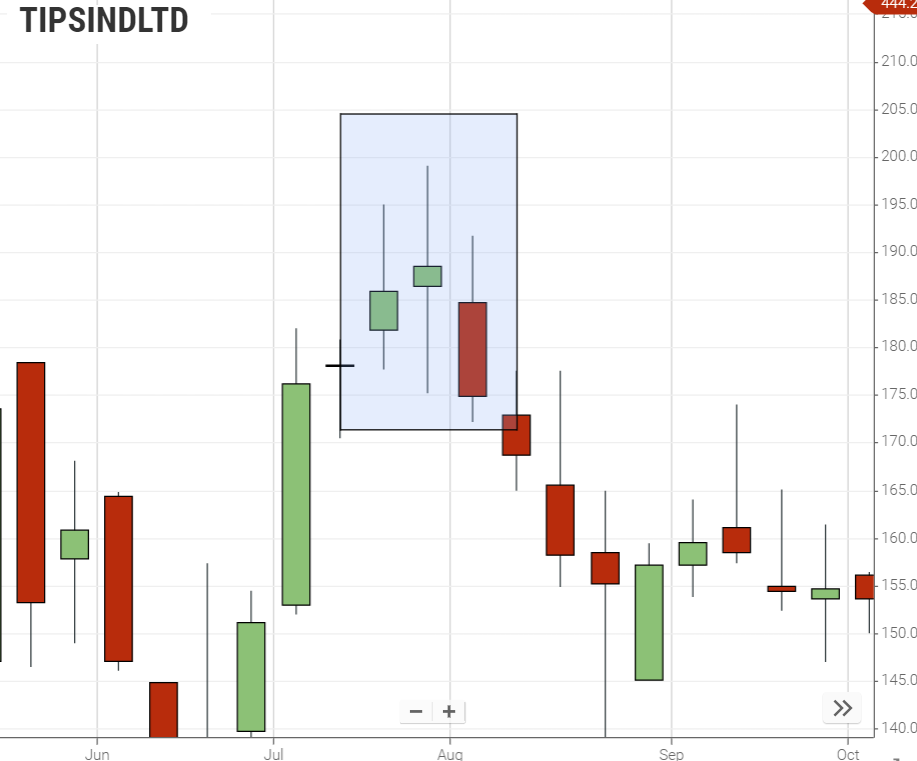
Consider this below chart

We can watch a clear bearish trend followed by an abandoned reversal baby pattern. Note that the Doji candle formed is to be a green rectangle abandoned baby adding reliability to the pattern. The third candle opens after the abandoned baby, which is confirming the pattern
Trading Strategy
The advantage of the abandoned baby candlestick pattern lies in its immediacy for trading. When identified on the chart, it allows for prompt execution without the necessity of relying on additional trading indicators to confirm the signal. The pattern is inherently reliable, eliminating the need for extensive confirmation tools. However, it's important to note that, like any trading pattern, it does not guarantee success in every instance. Exercise caution and avoid overcommitting, recognizing that even reliable patterns carry inherent uncertainties.

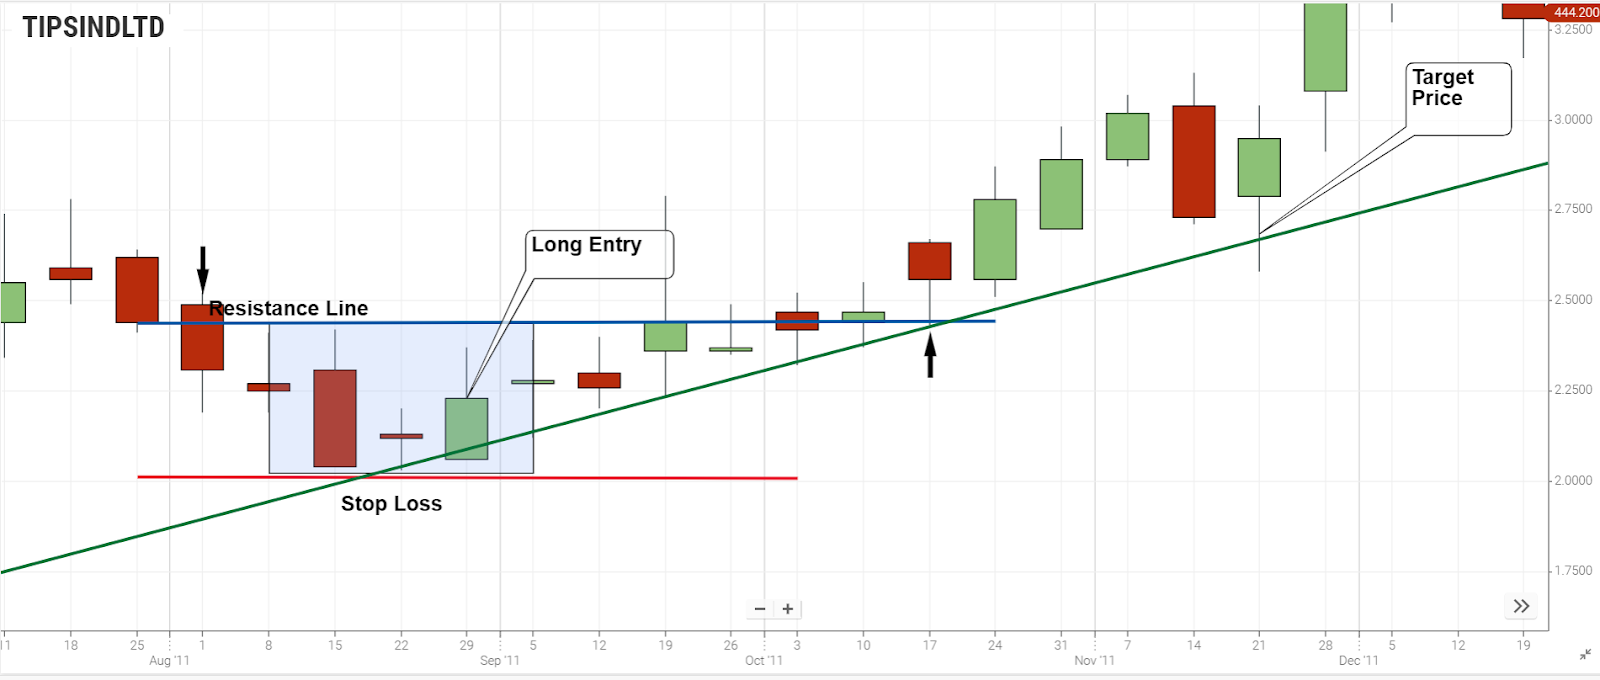
Consider the above chart pattern,
Following a substantial price decline, we observe a candle that gaps down within the prevailing bearish trend (highlighted within the rectangle ). The subsequent candle exhibits a gap up, confirming a bullish abandoned baby chart pattern.
Initiating a long buy position at the close of the third candle in the pattern, we establish a stop-loss order just below the lower wick of the abandoned candle, as indicated in the image.
The stock price undergoes a pronounced upward move, and we closely monitor the price action. Notably, the first candle of the pattern and the preceding candle together create a resistance area (depicted by the blue horizontal line).
During its ascent, the stock successfully breaches this resistance level. The price then consolidates, with the prior resistance now functioning as support (refer to the black arrows on the chart).
Subsequently, the price resumes its upward trajectory, breaking the high of the consolidation area. The price tests this trend line multiple times without breaching it.
Summary
Both the patterns are used to identify the trends.
The Bullish Abandoned Baby pattern serves us as an entry point.
The Bearish Abandoned Baby pattern serves us as an exit point.
To ensure that our trading strategy is effective, it's always recommended to mix and match the patterns and indicators.
Frequently Asked Questions
What is the Abandoned Baby Candlestick Chart Pattern?
The Abandoned Baby Candlestick Chart Pattern is a three-bar reversal pattern that signals a potential shift in market sentiment. It consists of a large price gap, a doji candle, and another gap in the opposite direction. This pattern is unique, reliable, and indicates a potential trend reversal.
Are there variations of the abandoned baby pattern?
Yes, variations exist. Some traders may look for specific criteria, such as the size of the gap or the length of the candles, to refine their analysis.
Can the abandoned baby pattern be seen on different timeframes?
Yes, it can appear on various timeframes. Traders should adapt their strategies based on the timeframe they are trading.
What are common mistakes when interpreting this pattern?
Overreliance on a single pattern, ignoring broader market conditions, and not considering other technical factors are common mistakes. It's essential to use the abandoned baby pattern in conjunction with comprehensive analysis.
What is the advantage of the Abandoned Baby Candlestick Pattern?
The advantage lies in its immediacy for trading, allowing for prompt execution without relying on additional indicators. However, it's important to exercise caution and recognize that no pattern guarantees success in every instance.
