Knowledge Center Technical Analysis
Candlestick Patterns
Inverted Hammer and Shooting Star Candlestick Pattern
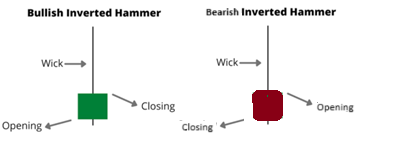
An inverted hammer shooting star candlestick pattern is a potential reversal pattern in a downtrend/ uptrend. This pattern has a long upper shadow, small body near the top of candlestick and little to now lower shadow. This pattern looks like an upside down hammer candle.
Characteristics of Inverted Hammer and Shooting Star Candlestick Pattern
This candle has a small body near the bottom, a long upper shadow, little to no lower shadow.
The overall shape of the inverted hammer candlestick pattern resembles an upside down letter “T “or an upside down hammer.
Shooting Star vs Inverted Hammer
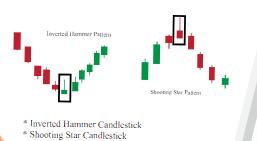
The inverted hammer bullish or bearish, significance depends upon the price action. The shooting star and inverted hammer are both hammer inverted candlestick patterns.
Inverted Hammer Candlestick Pattern
If the inverted hammer candle appears after a downtrend, it's considered a potential bullish reversal signal.
In this case, the colour of the candlestick might be green or white (indicating a higher close than the open), but the key is the shape and context.The “reverse of the Hammer pattern” is known as the Inverted Hammer candlestick pattern.
It is found after a downtrend.It is treated as an indication of a trend reversal signal.
When the buyers move the commodity prices against the sellers, it gives rise to this pattern.The substantial buying interest for technical, psychological, or fundamental reasons lies in the evidence that the commodities regain and close near the opening prices. It indicates a possible market bottom or trend change when this occurs in a downturn resulting in a reversal pattern.

Shooting Star Candlestick Pattern
The shooting star is named after its shape. It has one candle. The open, close and low are near the low of the candlestick. This pattern gives rise to an uptrend.
If the inverted hammer appears after an uptrend, it's considered a potential bearish reversal signal.
In this case, the colour of the candlestick might be red or black (indicating a lower close than the open), but the key is the shape and context. A bearish inverted hammer candlestick pattern is also called a Shooting Star.
When the buyers move the commodity prices higher against the sellers, it gives rise to this pattern. The substantial buying interest for technical, psychological, or fundamental reasons lies in the evidence that the commodities regain and close near the opening prices. It indicates a possible market top or trend change when this occurs in an uptrend resulting in a reversal pattern.

Difference Between Inverted Hammer and Shooting Star Candle
An inverted hammer pattern appearing at the bottom of the downtrend indicates a potential bullish reversal whereas a shooting star at the top of an uptrend indicates a potential bearish reversal.
An inverted hammer indicates that the sellers have initially pushed the price down but the buyers were able to back the price near open whereas in a shooting star indicates that even though the buyers were able to push the price up, the sellers were able to push the price back down indicating potential weakness.
An inverted hammer indicates a potential shift from bearish sentiment to bullish sentiment and buyers are gaining control whereas in a shooting star indicates a potential shift from bullish sentiment to bearish sentiment and sellers are gaining control.
An inverted hammer can be treated as an entry point into the market whereas a shooting star can be treated as an exit point into the market.
How to trade Inverted Hammer
Let’s see how to trade using the shooting star candlestick pattern
Trade Entry
-
Recognize a prevailing bullish trend.
-
Identify a candle characterized by a compact body and a substantial upper wick.
-
Exercise patience until a bearish candle breaches the shooting star's body's low point.
-
Confirm the pattern with increased volume, indicating substantial selling pressure.
-
This confirmation will validate the presence of the shooting star candle on the chart.
Stop Loss
It's advisable to implement a stop-loss order when engaging in trading with the shooting star candle pattern. Given the inherent uncertainties in stock trading and the possibility of encountering false signals with this pattern, it's a risk management strategy.
To mitigate risks, position the stop-loss order just beyond the upper wick of the shooting star candle pattern. This precautionary measure helps safeguard against potential adverse movements and aligns with the acknowledgment that no trading strategy can guarantee a 100% success rate.
Taking Profits
The projected price objective for the shooting star aligns with the dimensions of the pattern, reflecting the length of the candle.
In a parallel manner, our goal is to achieve a price shift equivalent to three times the length of the shooting star, encompassing both the body and the wick.
Trading strategy
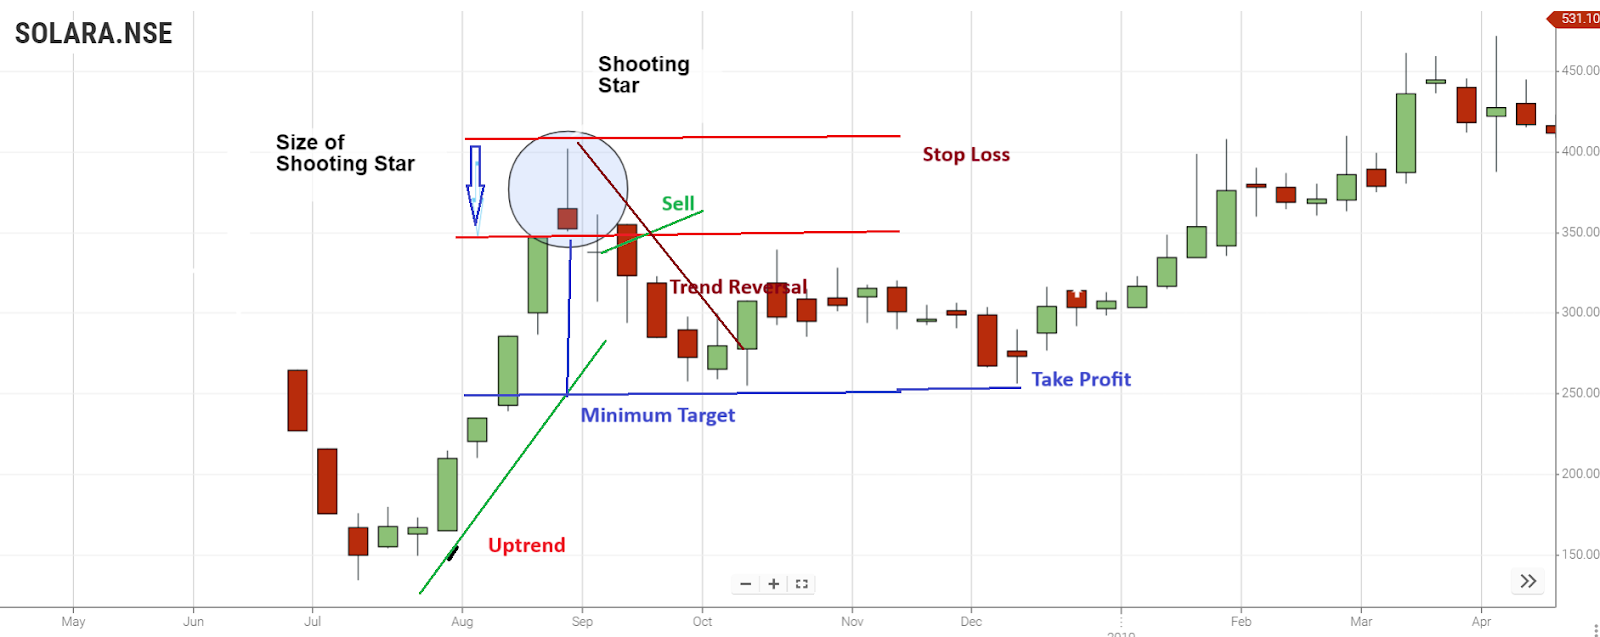
A shooting star candle is observed at the top of an uptrend.
The next candle after the shooting star candle is bearish and it confirms the pattern
Initiate a sell entry at that bearish candle.
Place a stop loss order at the upper wick of the shooting star candle to secure short trade.
This stop loss order will protect from unexpected bullish movement if caused by high volatility.

The blue downward arrow measures the size of the shooting star candlestick.
According to the shooting star strategy, the target should be placed equal to two times the size of the shooting star candle. Therefore, apply target size from the bottom of the shooting star up to three times its size, which is the long blue arrow. Now place the minimum target.
Take profit when the price goes below the minimum target and exit the trading.
Summary
Both the patterns are used to identify trends.
The Inverted Hammer pattern can be treated as an entry point. The Shooting star pattern can be treated as an exit point.To ensure that our trading strategy is effective, it’s always recommended to mix and match the patterns and indicators.
Frequently Asked Questions
What Is the Difference Between Inverted Hammer and Shooting Star?
Inverted Hammer:
Appears after a downtrend.
Signifies potential bullish reversal.
Shooting Star:
Appears after an uptrend.
Suggests potential bearish reversal.
Key Distinction:
Inverted hammer has a small body near the top, indicating buyer strength.
Shooting star has a small body at the bottom, indicating potential seller strength.
What Is the Meaning of Inverted Hammer?
The inverted hammer is a bullish candlestick pattern. It appears after a downtrend, signalling potential trend reversal. Its small body near the top indicates buyers overcoming initial selling pressure.
What Is a Shooting Star Candlestick?
A shooting star is a bearish candlestick pattern. It appears after an uptrend and signals potential trend reversal. Characterized by a small body at the bottom and a long upper shadow, suggesting seller strength.
What Is an Inverted Hammer Candlestick?
The inverted hammer is a bullish candlestick pattern. It emerges after a downtrend, indicating potential trend reversal. With a small body near the top, it signifies buyers overcoming initial selling pressure.
Can these patterns be applied to different timeframes?
Yes, inverted hammers and shooting stars can be observed on various timeframes. However, traders should be aware that the significance of these patterns may vary, and it's essential to adapt analysis to the specific characteristics of the timeframe being considered.
