Knowledge Center Technical Analysis
Candlestick Patterns
Difference between Candlestick pattern and Chart pattern
Candlestick chart patterns and chart patterns are both important tools in technical analysis for traders and investors, but they differ in their characteristics and the information they provide. Here's a detailed difference between candlestick patterns and chart patterns.
Candlestick Patterns vs Chart Patterns
Candlestick pattern |
Chart patterns |
Granularity |
|
|
Candlestick patterns focus on individual price bars, typically representing short-term price movements within specific timeframes (e.g., minutes, hours, or days). |
Chart patterns analyze a series of price bars or candlesticks over a more extended period, often focusing on daily, weekly, or even monthly data. They encompass a more significant timeframe than individual candlesticks. |
Components |
|
|
A candlestick consists of four main elements: open, close, high, and low prices for a specific time period. These elements are visualized as a rectangular shape with a "candlestick body" (the difference between open and close) and the vertical lines "wicks" or "shadows" (the high and low points). |
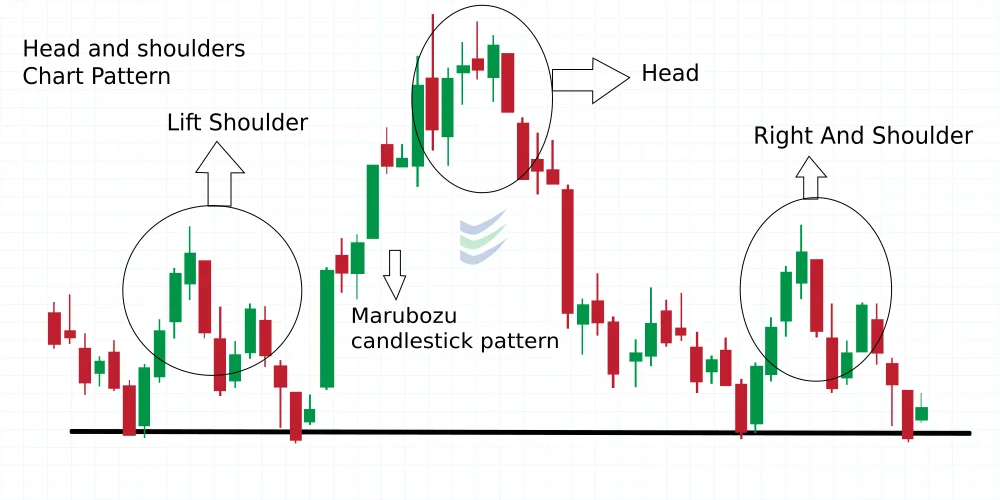
Chart patterns involve the recognition of specific geometric shapes or formations in price charts. These shapes may include triangles, head and shoulders, flags, pennants, and rectangles. Chart patterns do not consider the open, close, high, and low prices of individual bars as their primary elements. |
Market Sentiment |
|
|
Candlestick patterns are primarily used to gauge short-term market sentiment. They provide insights into the battle between buyers (bulls) and sellers (bears) within the chosen timeframe. Different candlestick patterns convey various sentiments, such as bullish, bearish, or indecision. |
Chart patterns are used to identify broader market trends, such as trend reversals or continuations. They provide insights into the overall supply and demand dynamics in the market. |
Timing |
|
|
Traders often use single candlestick patterns for timing entries and exits in the market. For example, a bullish candlestick pattern may signal a good time to buy, while a bearish pattern may indicate a potential sell signal. |
While chart patterns can provide hints about potential trend changes, they are less precise for timing specific entry and exit points compared to candlestick patterns. |
Examples |
|
|
Common candlestick patterns include doji, hammer, engulfing, shooting star, and spinning top, among others. |
Common chart patterns include ascending and descending triangles, double tops and bottoms, cup and handle, and head and shoulders, among others. |
Summary |
|
|
candlestick patterns offer insights into short-term market sentiment and are useful for timing entry and exit points within shorter timeframes. |
Chart patterns, on the other hand, focus on broader trend analysis over longer periods and are less specific in timing trades but can be valuable for understanding the overall market direction. |
|
Traders often use a combination of both candlestick and chart patterns to make well-informed trading decisions. |
|

The illustration above shows the candlestick and chart pattern for MCX GOLD PRICE.
We can notice that the daily “supply and demand” factors of gold prices’ give rise to candlestick patterns. The indication of trend direction is for a long time span in chart pattern.
Frequently Asked Questions
Can I use candlestick and chart patterns together in my trading strategy?
Yes, many traders use a combination of both candlestick and chart patterns to gain a comprehensive understanding of market conditions and make well-informed trading decisions.
How do I learn more about candlestick and chart patterns?
Traders can study various resources, including books, online courses, and practice with historical price data to improve their understanding and recognition of these patterns.
Are candlestick and chart patterns foolproof indicators of future price movements?
No, they are not foolproof. While these patterns provide valuable insights, they should be used in conjunction with other forms of analysis, risk management strategies, and market research for a well-rounded trading approach.
Do these patterns work in all financial markets, such as stocks, forex, and cryptocurrencies?
Candlestick and chart patterns can be applied to various financial markets and commodities , but traders should consider market-specific factors and adapt their strategies accordingly. There are different types of chart patterns like mcx gold live candlestick chart, crude oil candlestick chart etc.
