Knowledge Center Technical Analysis
Candlestick Patterns
The Three Black Crows and The Three White Soldiers Patterns
Three Black Crows Candlestick Pattern
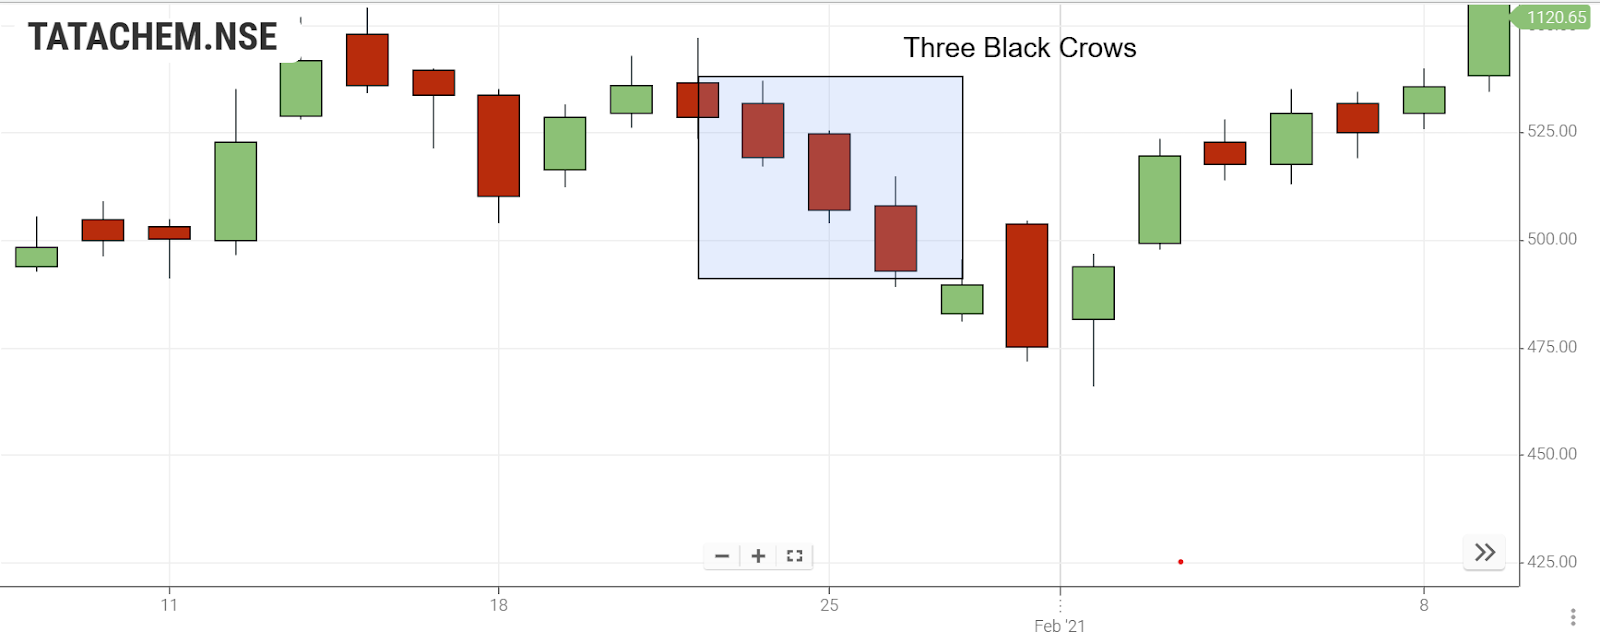
The Three Black Crows pattern emerges as a bearish reversal signal following an uptrend, indicating a shift from buying to selling pressure. This pattern is identified by a sequence of three consecutive bearish candlesticks, each displaying progressively lower highs. Its presence suggests a robust bearish sentiment, signaling the ascendancy of bears and suggesting the potential for further downward movement in the market.

When Does the Three Black Crows Pattern Occur?
The Three Black Crows pattern is formed in technical analysis as a tool for traders to recognize potential market reversals. It occurs when three successive bearish candlesticks appear, signaling a transition in sentiment from bullish to bearish.
Three features defining this pattern include:
-
Three consecutive bearish candlesticks.
-
Each candlestick opens within the real body of the preceding one.
-
Each candlestick closes at a new low.
-
Progressively lower highs and lower lows with each candlestick.
The emergence of this pattern implies that sellers have seized control, indicating a likelihood of continued downward movement in the price.
How to Execute Trades Using the Three Black Crows Pattern
Effectively trading with the Three Black Crows Pattern involves a comprehensive approach. Here are key steps to incorporate this pattern into your trading strategy:
-
Identify the pattern: Seek out three consecutive bearish candlesticks displaying lower highs and lower lows. Verify that each candlestick opens within the real body of the preceding one and closes at a new low.
-
Confirm the Reversal: Validate the reversal signal from the Three Black Crows pattern by examining additional technical indicators, market trends, and volume.
-
Set Entry and Exit Points: Define suitable entry and exit points for your trades. Utilize stop-loss orders to manage risks efficiently.
-
Risk Mitigation: Deploy proficient risk management tactics to protect your capital. This may involve determining appropriate position sizes, using trailing stop-loss orders, and diversifying your portfolio.
-
Regular Monitoring: Continuously observe price action and be prepared to adjust your strategy if needed. Stay vigilant and exit the trade if the price deviates from your anticipated direction.
Three White Soldiers Candlestick Pattern
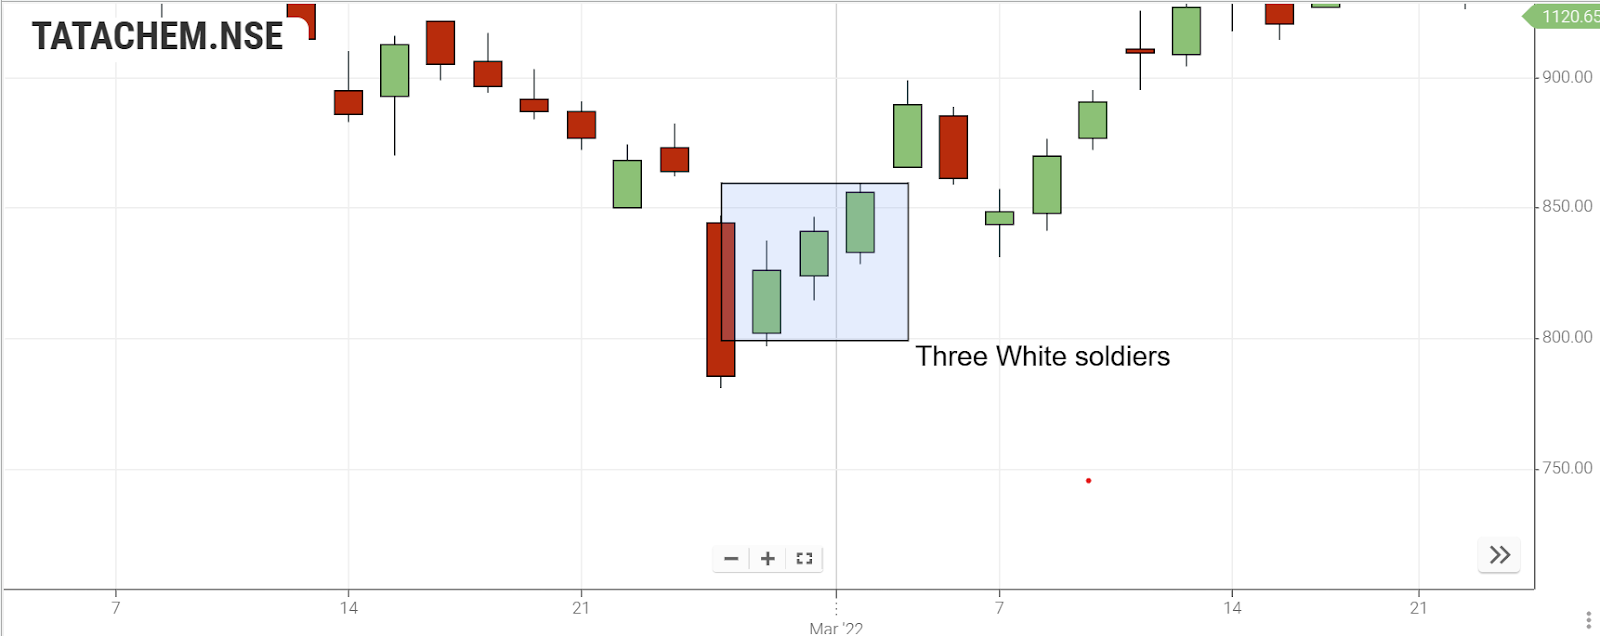
The three white soldiers' candlestick pattern is commonly observed as a signal for a reversal following a period of price decline. This pattern indicates a significant shift in market sentiment, whether in stocks, commodities, or forex pairs. The bullish candles in this pattern typically close with minimal or no shadows, signaling that bulls have successfully maintained control at the top of the session range. Formed after a prolonged downtrend, the three white soldiers' pattern signifies consecutive days where bullish forces outweigh bearish forces, featuring three green-colored candlesticks.
Identifying the Three White Soldiers Pattern:
To identify the three white soldiers' pattern, traders look for three consecutive green or white candlesticks, each progressively higher than the previous one. These candlesticks should have substantial bodies and minimal wicks, indicating a steady increase in buying pressure following a downtrend. Traders may consider opening long positions upon recognizing this pattern, anticipating an upward price movement.

Trading Strategies for the Three White Soldiers Pattern:
Traders short in the market may exit upon the appearance of the three bullish candlesticks, signaling a shift in momentum to the upside.
Bulls, previously hesitant during the downtrend, interpret the pattern as a buy signal, prompting them to enter long positions as the trend reverses from bearish to bullish.
While the pattern provides reliable signals, confirmation through other indicators, such as the Relative Strength Index (RSI), is crucial. An RSI below 30 indicates oversold conditions, while a move above 50 confirms a shift from bearish to bullish momentum.
Caution is advised when the RSI moves above 70, suggesting overbought conditions. Though the price may continue rising, a pullback could occur before the upward trend resumes.
Key Takeaways
-
The three soldiers and the three crows are both reversal patterns in financial markets.
-
The three soldiers' pattern comprises three successive bullish candlesticks that follow a downtrend. These candlesticks are characterized by approximately the same size and possess small or no wicks.
-
Conversely, the three crows pattern is made up of three consecutive bearish candlesticks occurring after an uptrend. These candlesticks share approximately the same size and feature small or no wicks.
Frequently Asked Questions
-
What other chart formations bear a resemblance to the three white soldiers?
Several patterns share similarities with the three white soldiers, including the three black crows, bullish engulfing pattern, morning star, hammer, inverted hammer, piercing line, abandoned baby, tweezer bottoms and tops, Additionally, consider double bottom and double top patterns.
-
How can the reliability of the Three White Soldiers chart pattern be enhanced?
Enhancing the reliability of the three white soldiers' patterns involves a comprehensive approach incorporating additional technical indicators, volume analysis, and consideration of contextual market conditions.
-
Which assets are optimal for trading using the Three White Soldiers chart pattern?
The three white soldiers pattern is versatile and applicable across various asset classes, including stocks, forex, commodities, ETFs, futures, and options. Its effectiveness may vary based on asset liquidity, volatility, and market conditions.
-
What Occurs After the Formation of Three Black Crows?
Following the emergence of the three black crows' candlestick pattern, a bearish reversal is anticipated. This pattern, marked by three consecutive bearish candles concluding a bullish trend, signifies a transfer of control from the bulls to the bears.
-
How Do You Identify the Three Black Crows Pattern?
To identify the Three Black Crows pattern, observe the following criteria:
-
A prevailing uptrend should be evident.
-
Three consecutive long and bearish candlesticks must appear.
-
Each candle should open below the opening of the preceding day.
-
Ideally, the opening of each candle will be in the middle of the previous day's price range.
