Knowledge Center Technical Analysis
Candlestick Patterns
Hammer and Hanging Man Pattern
Introduction
Hammer and Hanging Man patterns are candlestick patterns. These are technical analysis tools that offer insights into market sentiment and potential trend reversals. The hammer and hanging man candlestick pattern stand out as crucial indicators of shifts in market dynamics. Let’s understand the difference between hanging man and hammer candlestick pattern.
What Is the Difference Between Hammer and Hanging Man
|
Hammer Candlestick Pattern |
Hanging Man Candlestick Pattern |
|
Bullish candlestick reversal pattern |
Bearish candlestick reversal pattern |
|
Typically forms at the end of a downtrend |
Typically forms at the end of an uptrend |
|
It indicates that the sellers have pushed the price significantly lower but buyers have regained control and have pushed the price higher., potentially signalling a reversal from bearish to bullish. |
It indicates that despite an attempt to push prices higher, sellers have come back into the market, potentially signalling a reversal from bullish to bearish. |
|
Provides traders with valuable signals for decision-making. |
|
How does a Hammer and Hanging Man candlestick pattern look like?
|
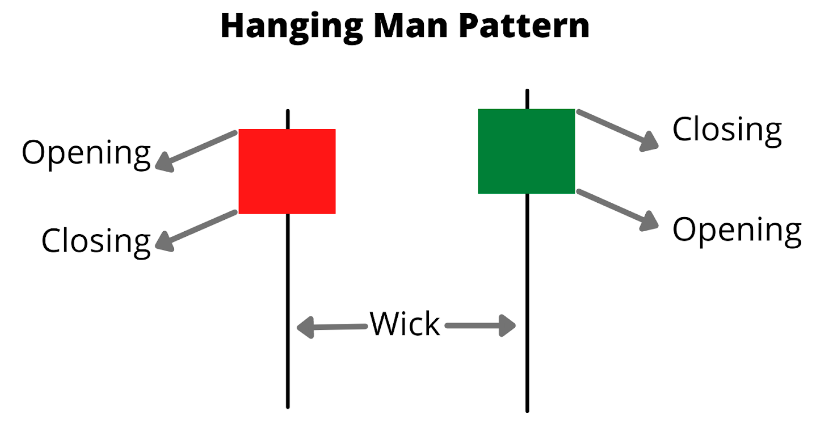
Both patterns are single candlestick formation. |
|
|
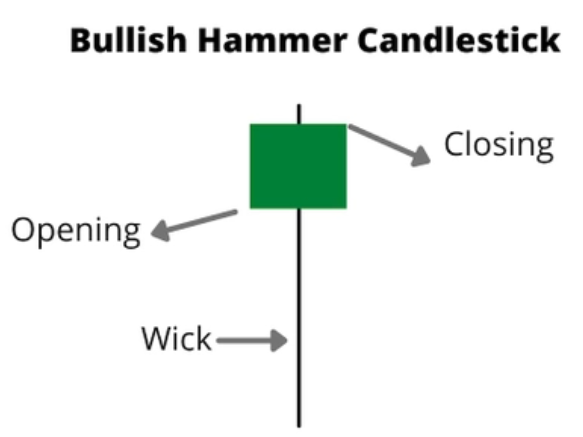
The candlestick appears like a hammer |
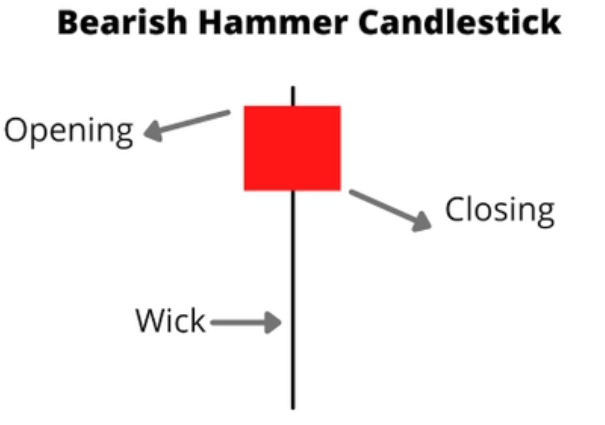
The candlestick appears like a hanging man. Typically, hanging man is a hammer at the top of a trend |
|
Both are characterized by a single candlestick with a small body near the top of the trading range and a long lower shadow(wick). |
|
|
The wick extends below the small body and represents the distance between the low of the session and the closing price |
|
|
The upper shadow (if present) is usually very small or non-existent, indicating that the closing price is close to the high of the session. |
|
|
While the colour of the candle (red or green) is not a critical factor in identifying a hammer, it is common for hammers to be green (bullish) when they appear at the end of a downtrend. |
While the colour of the candle (red or green) is not a critical factor in identifying a hanging man, it is common for hanging men to be red (bearish) when they appear at the end of an uptrend. |
|
|
|
|
The Hammer candlestick has a small white (commonly green) body near the top of the candle. |
The Hanging Man candlestick pattern has a small black (commonly red) body near the top of the candle. |
|
The long lower shadow extends below the body, indicating that sellers pushed the price significantly lower during the session. The upper shadow is minimal or non-existent. |
|
|
This shift in momentum is often seen as a bullish signal, especially if the hammer appears after a sustained downtrend. |
This shift in momentum is often seen as a bearish signal, especially if the hanging man appears after a sustained uptrend. |
|
Traders often look for confirmation from subsequent price action, such as a bullish candle on the following trading day. |
Traders often look for confirmation from subsequent price action, such as a bearish candle on the following trading day. |
When Does a Candlestick Hammer and Hanging Man Pattern Form?
|
Both the hammer and hanging man patterns are formed after a price movement, and their significance often lies in their occurrence at key points in a trend. Here's when these patterns are typically formed: |
|
|
Formation After a Downtrend: The hammer pattern is usually formed after a period of price decline or a downtrend. |
Formation After an Uptrend: The hanging man pattern typically forms after a period of price increase or an uptrend. |
|
Sign of Potential Reversal: It indicates that despite the selling pressure, buyers have stepped in and pushed the price higher by the end of the session. |
Sign of Potential Reversal: It indicates that despite the attempt to push prices higher, sellers have returned to the market, pushing the price lower by the end of the session. |
|
Found at Potential Support Levels: Hammers are often found near potential support levels, suggesting that buyers are active and there is potential for a reversal to the upside. |
Found at Potential Resistance Levels: Hanging men are often found near potential resistance levels, suggesting that sellers are becoming active, and there is potential for a reversal to the downside. |
How To Trade When You See the Hammer and Hanging Man Candlestick Pattern?
Trading based on hammer and hanging man candlestick patterns involves a combination of recognizing the patterns and implementing strategic entry and exit decisions. Here are general guidelines for trading when you observe these patterns:
Hammer Candlestick Pattern:
1. Confirmation:
-
Look for confirmation from subsequent price action. A bullish candle following the hammer strengthens the signal.
2. Entry Point:
-
Consider entering a long (buy) position slightly above the high of the hammer candle.
3. Stop Loss:
-
Place a stop-loss order below the low of the hammer. This level acts as a safeguard if the reversal doesn't materialize.
4. Target:
-
Identify a target level based on technical analysis, such as a resistance zone or a previous high.
5. Risk-Reward Ratio:
-
Evaluate the risk-reward ratio to ensure that potential gains outweigh potential losses.
Hanging Man Candlestick Pattern:
1. Confirmation:
-
Seek confirmation from the next candlestick. A bearish candle following the hanging man strengthens the signal.
2. Entry Point:
-
Consider entering a short (sell) position slightly below the low of the hanging man candle.
3. Stop Loss:
-
Place a stop-loss order above the high of the hanging man. This acts as protection in case the reversal does not occur.
4. Target:
-
Identify a target level based on technical analysis, such as a support zone or a previous low.
5. Risk-Reward Ratio:
-
Assess the risk-reward ratio to ensure a favorable balance between potential gains and losses.
Trading Strategies
Hammer Candlestick Trading Strategies
Traders should understand the practical uses of the hammer pattern, along with other indicators, to make a profit. You can rely on the hammer candlestick as a primary element to formulate a trading strategy. Still, its accuracy can only be confirmed when used with other technical indicators and technical analysis tools.
We’ll look at some of the trading strategies to use with the hammer pattern.
Strategy 1: Top-Bottom Strategy with Hammer
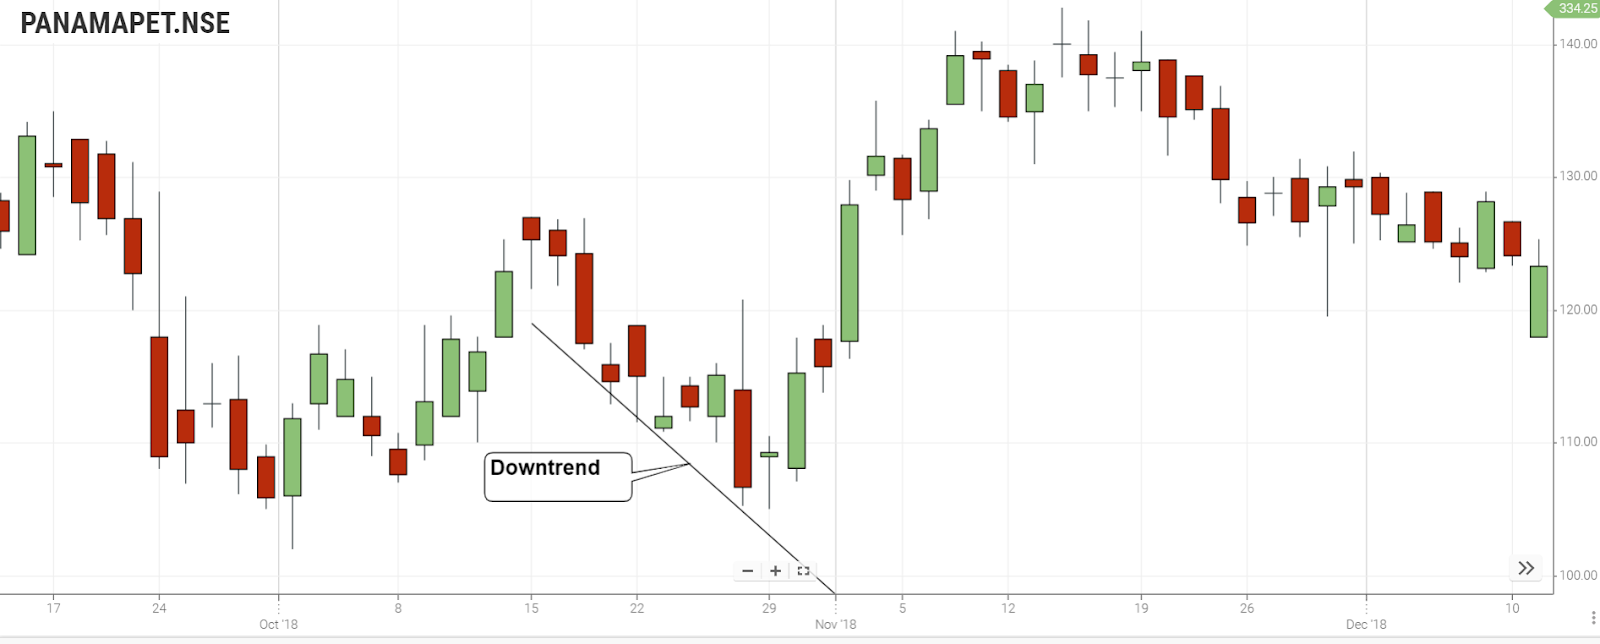
In the above stock price chart, the price moves lower, breaking below the near-term low.
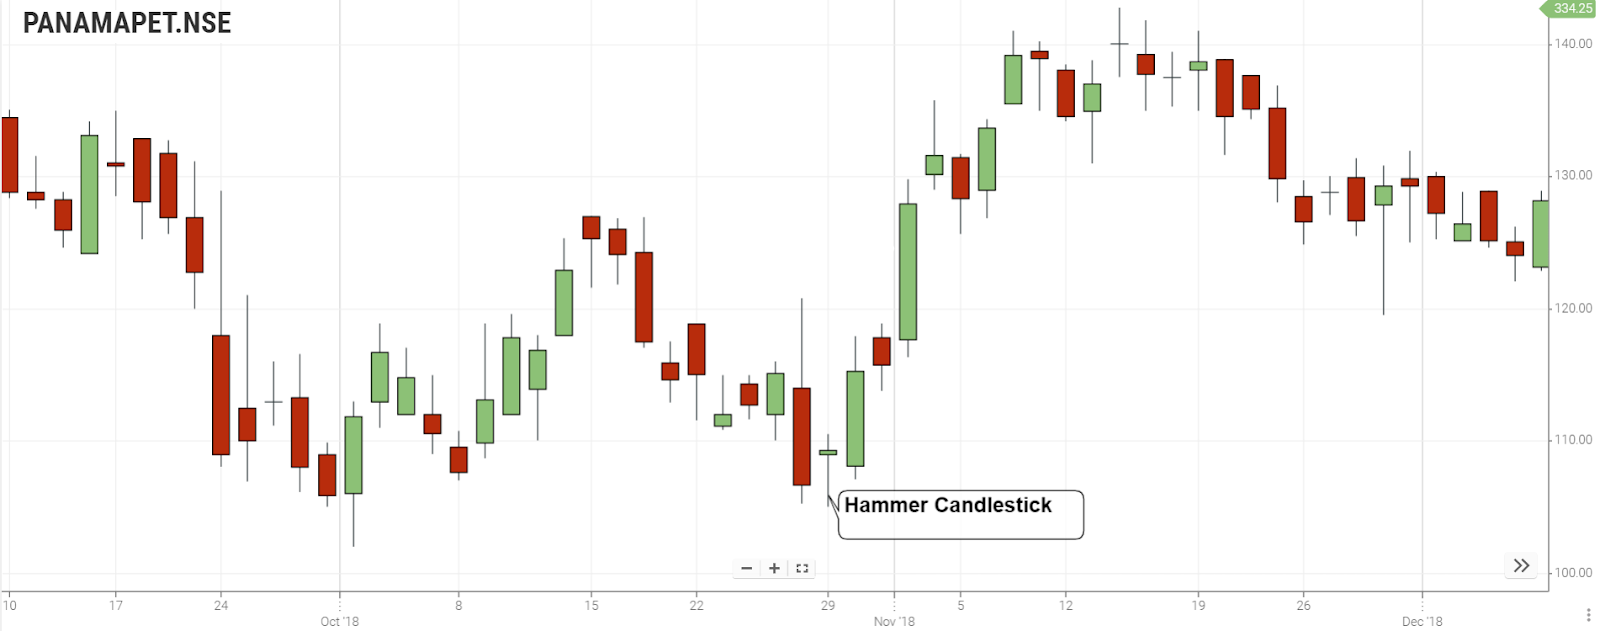
As soon as the price makes a new low, it shows the first sign of upcoming bullish pressure with an indecision candle. Later on, bears try to take the price lower but fail and close with a bullish hammer.

The ideal entry for this trading strategy is a buy stop order above the hammer’s high price, with a stop loss below the shadow with some buffer.
Summary
Both the patterns are used to identify trends. The Hammer pattern can be treated as an entry point. The Hanging Man pattern can be treated as an exit point. To ensure that our trading strategy is effective, it’s always recommended to mix and match the patterns and indicators
Frequently Asked Questions
What Is an Inverted Hanging Man Candlestick?
An inverted hanging man is a bearish candlestick pattern with a small body near the bottom of the trading range, a long upper shadow, and little to no lower shadow. It suggests potential downward momentum and a reversal from a bullish trend. Confirmation from subsequent price action is often considered for a more reliable signal.
What Is the Opposite of Hanging Man Candlestick?
The opposite of a Hanging Man candlestick is a Bullish Hammer. Both patterns appear after a downtrend, but a Hanging Man signals potential bearish reversal, while a Hammer indicates potential bullish reversal. Hammers have a small body near the bottom with a long lower shadow.
What Is a Bearish Hammer Candlestick Pattern?
If the inverted hammer appears after an uptrend, it's considered a potential bearish reversal signal.
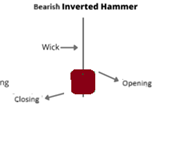
In this case, the colour of the candlestick might be red or black (indicating a lower close than the open), but the key is the shape and context. It is also called as Shooting Star
What is a Bullish Inverted Hammer?
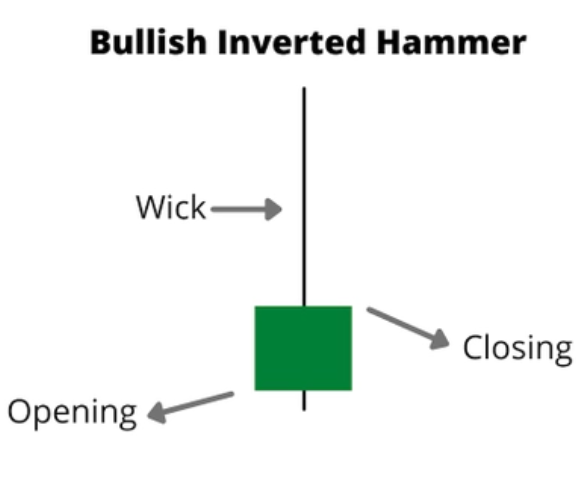
A bullish inverted hammer is a candlestick pattern with a small body near the bottom of the trading range, a long upper shadow, and little to no lower shadow. Despite its bearish-sounding name, it suggests potential upward momentum and a reversal from a downtrend to an uptrend. Confirmation from subsequent price action is often considered for a more reliable signal.
Can hammers and hanging men be reliable signals for traders?
While they are widely used, it's crucial to consider these patterns within the broader market context and use them in conjunction with other technical tools for more reliable trading decisions.