Knowledge Center Technical Analysis
Candlestick Patterns
What is The Spinning Top and Marubozu Candlestick Pattern?
Candlestick Pattern
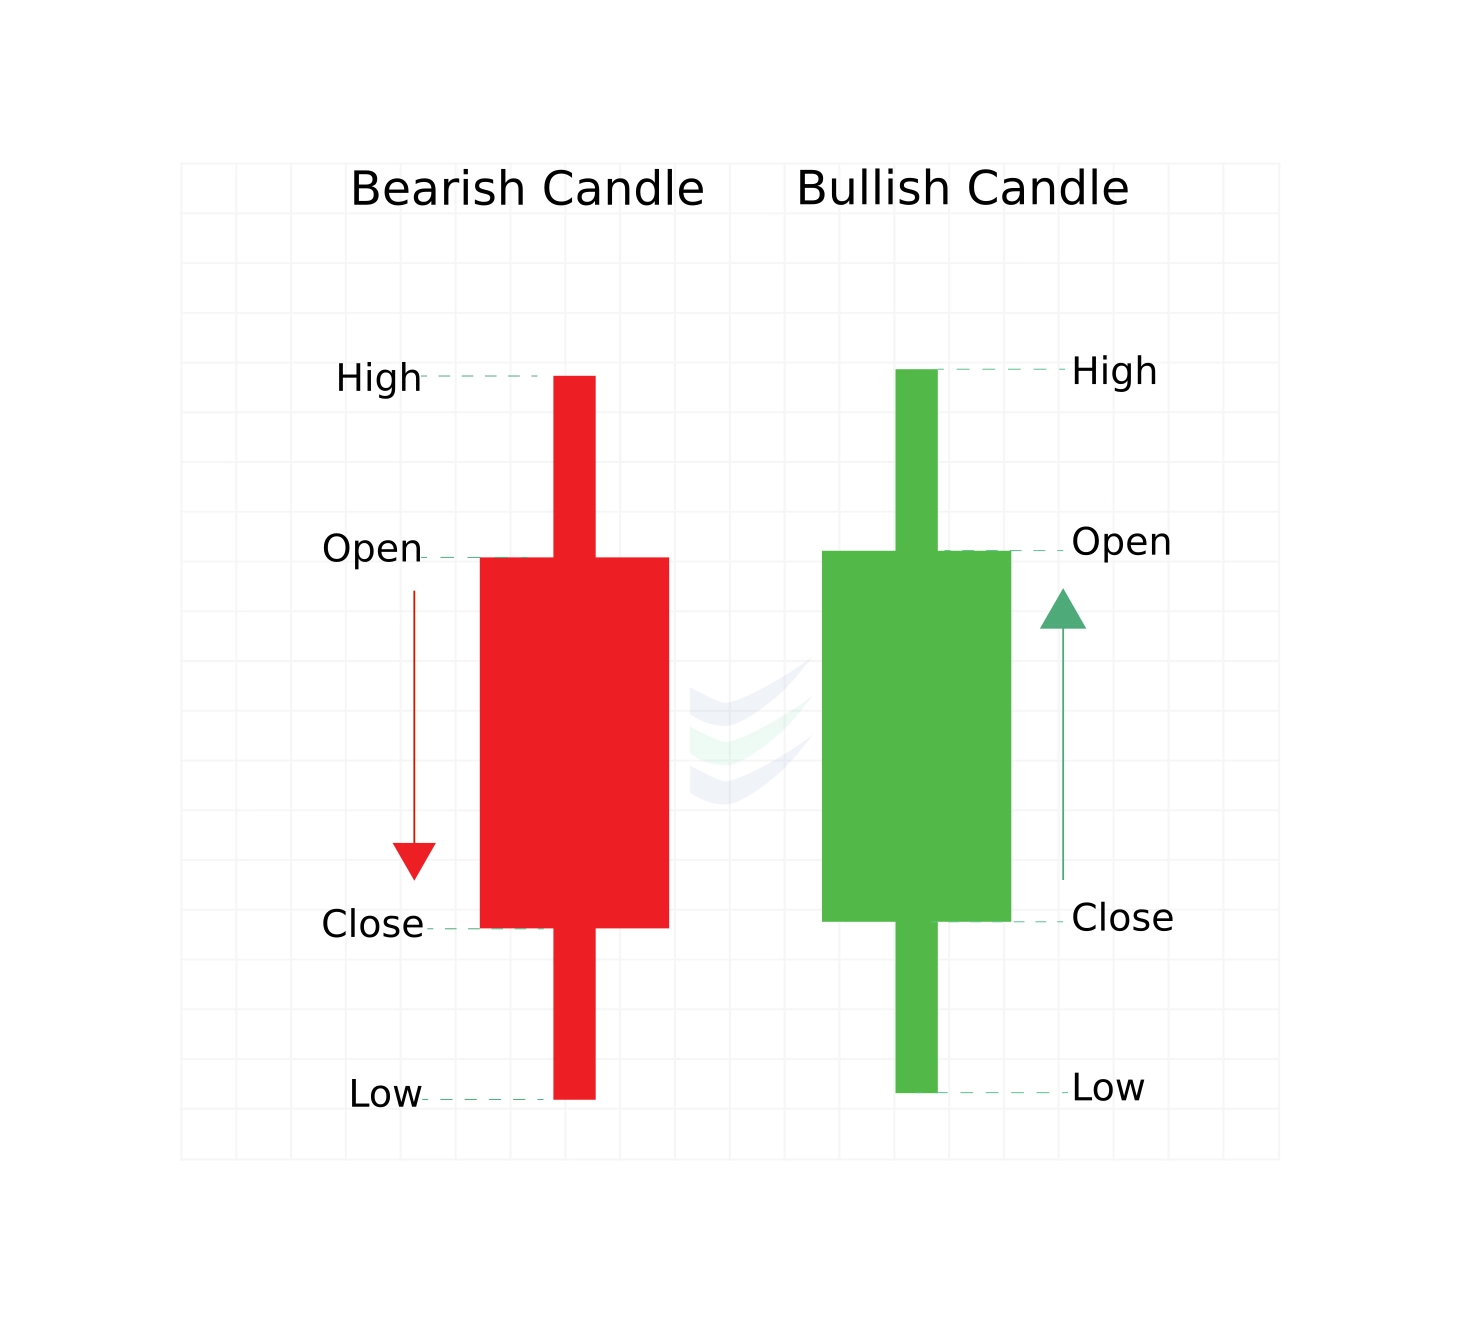
Candlestick patterns are a popular form of technical analysis used by traders and investors to make decisions in the financial markets. These patterns are formed by the price movements of an asset over a specific period and are represented visually as candlesticks on a price chart. Each candlestick typically consists of a body and one or two wicks (also called shadows or tails), and their shapes and positions provide valuable information about market sentiment and potential price direction.
Spinning Top Candlestick Pattern
The spinning top candlestick pattern is a common and widely recognized candlestick pattern used in technical analysis. It is characterized by its distinct shape, which represents market indecision or a standoff between buyers and sellers.
How does a spinning top candlestick look like?
A spinning top candlestick consists of a small, narrow body with upper and lower wicks (shadows or tails) of roughly equal length (vertical line). The body can be either bullish (green or white) or bearish (red or black) (horizontal line).
The size of the spinning top's body is relatively small compared to the surrounding candlesticks. It signifies that there is no significant dominance of either bulls or bears during the period covered by the candlestick.
When does a spinning top candlestick pattern is formed?
A spinning top candlestick is formed when there is a relative balance between buyers and sellers during a specific time period, leading to a small and narrow body with upper and lower wicks (shadows or tails) of approximately equal length. This candlestick pattern typically represents a state of market indecision and can occur under various circumstances like Transition from Uptrend to Downtrend, Transition from Downtrend to Uptrend, During periods of market Consolidation, Market Indecision, Exhaustion Points, Support and Resistance Levels and during Intraday Trading.
What does a spinning top candlestick pattern indicate?
A spinning top candlestick pattern tells traders that the market is currently in a state of indecision, with neither buyers nor sellers having a clear advantage. While it does not provide a definitive trading signal on its own, it serves as a warning sign and prompts traders to exercise caution and seek additional confirmation before making trading decisions. Traders should consider the broader market context and use spinning tops in conjunction with other technical analysis tools for more informed trading strategies.
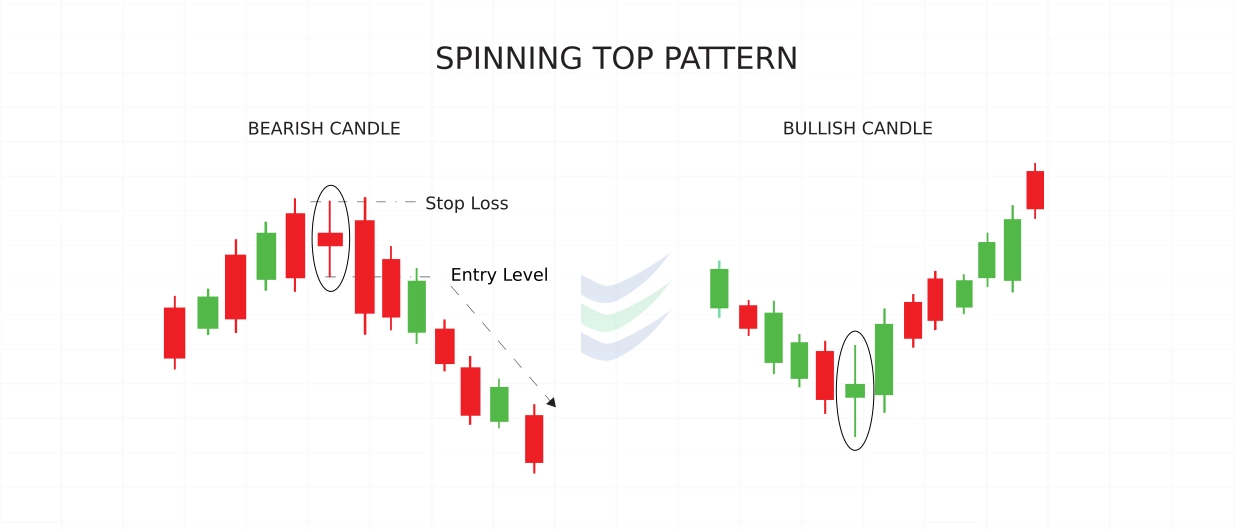
If the spinning top is seen at the top of a downtrend, it could mean that a bearish reversal might happen.This pattern is termed as Bearish Spinning Top Candlestick pattern. Conversely, if it occurs at the bottom of an uptrend, it could signal bullish reversal. This pattern is termed as Bullish Spinning Top Candlestick pattern.
How to trade when you see the spinning top candlestick pattern?
Trading based on the spinning top candlestick pattern involves using it as a signal of market indecision and being prepared for potential price reversals or continuations. Here's a step-by-step guide on how to trade when you see the spinning top candlestick pattern:
Identify the Spinning Top: The first step is to recognize the spinning top pattern on your price chart.
Analyse the Context: Consider the broader context of the market. Is the spinning top occurring after a strong trend, during a consolidation phase, or near significant support or resistance levels?
Look for Confirmation: A spinning top on its own does not provide a strong trading signal. To increase the reliability of your trade, look for confirmation from other technical indicators, patterns, or signals.
Other Candlestick Patterns: Look for other candlestick patterns that might follow the spinning top, such as bullish or bearish engulfing patterns, dojis, or hammers.
Determine Your Entry and Exit Points: Once you have identified the spinning top and obtained confirmation, decide on your entry and exit points. This includes setting a stop-loss order to limit potential losses and a take-profit order to secure profits.
Risk Management: Calculate your position size based on your risk tolerance and the distance between your entry and stop-loss levels. Ensure that your risk-reward ratio is favourable for the trade.
Place Your Trade: Execute your trade according to your trading plan. If the spinning top suggests a potential reversal, you might enter a trade in the opposite direction of the previous trend. If it suggests a continuation, you might align your trade with the existing trend.
Monitor the Trade: Keep a close eye on the trade after entering. Spinning tops often precede periods of increased volatility or price movements. Adjust your stop-loss and take-profit orders, if necessary, as the trade progresses.
Exit the Trade: Exit the trade when your predetermined take-profit or stop-loss levels are reached, or if you see a strong reversal signal that contradicts your initial analysis.
Review and Learn: After the trade are closed, review the outcome and analyse what worked and what didn't. This feedback can help you refine your trading strategy and improve your decision-making in future trades.
Marubozu Candlestick Pattern
The Marubozu candlestick pattern is a powerful and distinctive candlestick pattern used in technical analysis to signal strong market sentiment and potential trend reversals or continuations.
Marubozu Meaning
The word "Marubozu" is of Japanese origin and means "bald" or "shaved," signifying the absence of wicks or shadows (vertical lines) on the candlestick.

How does a Marubozu candlestick look like?
The Marubozu candlestick is characterized by its long body with either no upper or lower wick, indicating that either buyers (bulls) or sellers (bears) have full control of the market during the entire trading session.
A bullish Marubozu has a long green or white body with no upper wick, indicating that the opening price is equal to the lowest price of the session, and the closing price is equal to the highest price of the session. In other words, the entire trading session occurred in an upward price movement.
Whereas, a bearish Marubozu has a long red or black body with no lower wick, indicating that the opening price is equal to the highest price of the session, and the closing price is equal to the lowest price of the session. The entire trading session occurred in a downward price movement.
When does a Marubozu candlestick pattern is formed?
A Marubozu candlestick pattern is formed when there is strong and one-sided price movement in the market during a specific trading session.
Bullish Marubozu Candlestick Pattern:
A bullish Marubozu pattern is formed when the following conditions are met:
The opening price of the trading session is the same as or very close to the lowest price (no lower wick).
The closing price of the trading session is the same as or very close to the highest price (no upper wick).
The body of the candlestick is long and green or white, indicating a strong upward movement.
This pattern suggests that buyers were in complete control from the beginning to the end of the session.
Bearish Marubozu Candlestick Pattern:
A bearish Marubozu candlestick pattern is formed when the following conditions are met:
The opening price of the trading session is the same as or very close to the highest price (no upper wick).
The closing price of the trading session is the same as or very close to the lowest price (no lower wick).
The body of the candlestick is long and red or black, indicating a strong downward movement.
This pattern suggests that sellers were in complete control from the beginning to the end of the session.
Key points to consider when trading based on Marubozu patterns:
Confirmation: While Marubozu patterns are strong signals on their own, traders often seek confirmation from other technical indicators or chart patterns to increase the reliability of their trading decisions.
Volume: High trading volume on the day the Marubozu pattern forms can add confidence to its signal.
Market Context: Always consider the broader market context, including support and resistance levels, trendlines, and other factors, when interpreting Marubozu patterns.
Risk Management: Implement proper risk management strategies, such as setting stop-loss orders and take-profit levels, to manage potential losses when trading based on Marubozu patterns.
How to trade when you see the Marubozu candlestick pattern?
Trading based on the Marubozu candlestick pattern involves recognizing the pattern and using it as a signal for potential trend continuation or reversal. Here's a step-by-step guide on how to trade when you see a Marubozu candlestick pattern:
Identify the Marubozu Pattern
The first step is to identify the presence of a Marubozu pattern on your price chart. Look for a candlestick with a long body and no upper or lower wick. Determine whether it's a bullish (green or white) or bearish (red or black) Marubozu.
Analyse the Context
Consider the broader market context. Is the Marubozu occurring after a significant trend, near a support or resistance level, or at a key technical point on the chart? The context can affect the significance of the pattern.
Confirm the Pattern
While Marubozu patterns are strong signals on their own, traders often seek confirmation from other technical indicators, patterns, or market factors. Look for additional supporting evidence, such as volume, trendlines, or other candlestick patterns.
Determine Entry and Exit Points
Decide on your entry and exit points based on the Marubozu pattern's signal. If it's a bullish Marubozu pattern, consider entering a long (buy) position, and if it's a bearish Marubozu, consider entering a short (sell) position. Set stop-loss and take-profit orders to manage risk and secure profits.
Position Sizing and Risk Management
Calculate your position size based on your risk tolerance and the distance between your entry and stop-loss levels. Ensure your risk-reward ratio is favourable. Implement proper risk management techniques to protect your capital.
Place the Trade
Execute your trade according to your trading plan. Use market orders or limit orders, depending on your trading strategy and the current market conditions.
Monitor the Trade
Keep a close eye on the trade after entering. Monitor price action and market developments. Be prepared to adjust your stop-loss and take-profit orders as needed.
Exit the Trade
Exit the trade when your predetermined take-profit or stop-loss levels are reached, or if you see a strong reversal signal that contradicts your initial analysis.
Review and Learn
After the trade is closed, review the outcome and analyse what worked and what didn't. Consider how the Marubozu pattern performed in the specific market context. Use this feedback to refine your trading strategy for future trades.
Frequently asked questions
How Reliable Are Marubozu Patterns for Trading?
Marubozu patterns are considered relatively reliable due to their strong signals. However, like any technical analysis tool, they should be used in conjunction with other forms of analysis and confirmation to increase reliability.
Do Marubozu Patterns Require Confirmation?
While Marubozu patterns can be strong standalone signals, traders often seek confirmation from other technical indicators, patterns, or market factors to strengthen their trading decisions.
Can Marubozu Patterns Occur on Different Timeframes?
Yes, Marubozu patterns can appear on various timeframes, including intraday charts and longer-term daily or weekly charts. The significance of the pattern may vary depending on the timeframe.
What Is the Role of Volume in Confirming Marubozu Patterns?
High trading volume on the day the Marubozu pattern forms can add confidence to its signal. An increase in volume supports the idea of strong market sentiment in the direction of the pattern.
How Do I Manage Risk When Trading Marubozu Patterns?
Implement proper risk management techniques, such as setting stop-loss orders and take-profit levels, to manage potential losses. Calculate your position size based on your risk tolerance.
What Does a Spinning Top Suggest About Market Sentiment?
A spinning top suggests that the market is uncertain and that there is a standoff between buyers and sellers. It reflects a lack of conviction and a potential turning point or continuation of the prevailing trend.
Is a Spinning Top a Strong Signal for Trading?
A spinning top on its own is not a strong trading signal. Traders often use it as a warning sign or as part of a larger analysis. Its significance increases when it is followed by confirmation from other technical indicators or patterns.
How Do I Use Spinning Tops in My Trading Strategy?
To use spinning tops effectively, incorporate them into your overall trading strategy. Look for spinning tops in conjunction with other technical tools, such as support and resistance levels, trendlines, and additional candlestick patterns. Use them to prompt further analysis rather than as standalone signals.
Can a Spinning Top Occur on Different Timeframes?
Yes, spinning tops can occur on various timeframes, from short-term intraday charts (e.g., 15 minutes) to longer-term daily or weekly charts. The significance of a spinning top may vary depending on the timeframe. Shorter timeframes may reflect short-term indecision, while longer time frames could indicate potential shifts in the overall trend.
Are There Variations of the Spinning Top Pattern?
While the classic spinning top has a small body with equal-length upper and lower wicks, variations exist. For example, a long-legged doji is a spinning top with longer wicks, indicating even greater uncertainty. Traders may consider these variations when assessing market sentiment and potential price movements.