Knowledge Center Technical Analysis
Candlestick Patterns
Morning Star and Evening Star Candlestick Pattern
Difference Between Shooting Star and Morning Star Candlestick pattern
|
Shooting Star Candlestick Pattern |
Morning Star Candlestick Pattern |
|
The shooting star is a single candle, bearish candlestick pattern characterized by a small body, a long upper shadow, and little to no lower shadow. It suggests a potential trend reversal, as it indicates that buyers briefly pushed prices higher, but the session closed with significant selling pressure, often signalling a bearish reversal. Traders often use it as a signal to consider selling or shorting an asset. |
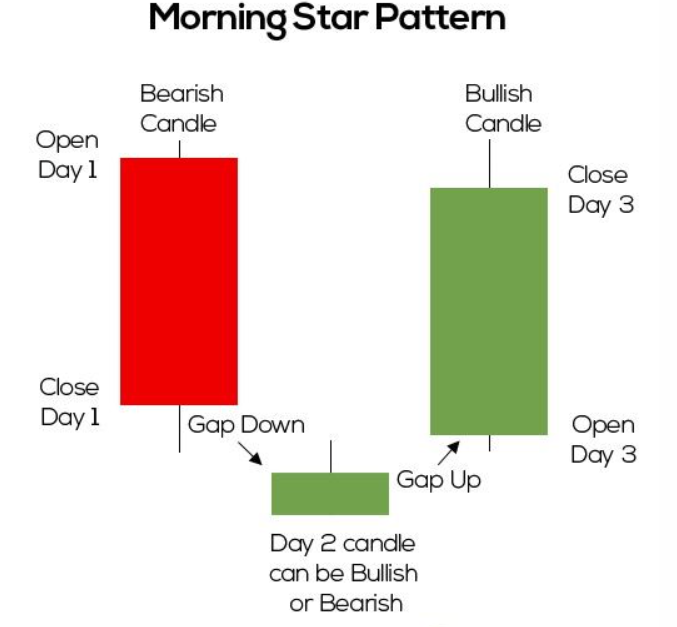
The morning star is a bullish candlestick pattern composed of three candles. 1st candle : Long and bearish candlestick 2nd candle: Small and indecisive candlestick 3rd candle : Long and bullish candlestick The morning star pattern is a bottom reversal pattern. It begins with a long bearish candle, followed by a small candle indicating indecision, and ends with a long bullish candle, signalling a potential trend reversal from bearish to bullish. Traders often view it as a buying opportunity. This is a reversal pattern that is found at the bottom of a downtrend. |
Difference Between Shooting Star and Evening Star Candlestick Pattern
|
Shooting Star Candlestick Pattern |
Evening Star Candlestick Pattern |
|
The shooting star patterns is a single candle, bearish candlestick pattern characterized by a small body, a long upper shadow, and little to no lower shadow. It suggests a potential trend reversal, as it indicates that buyers briefly pushed prices higher, but the session closed with significant selling pressure, often signalling a bearish reversal. Traders often use it as a signal to consider selling or shorting an asset. |
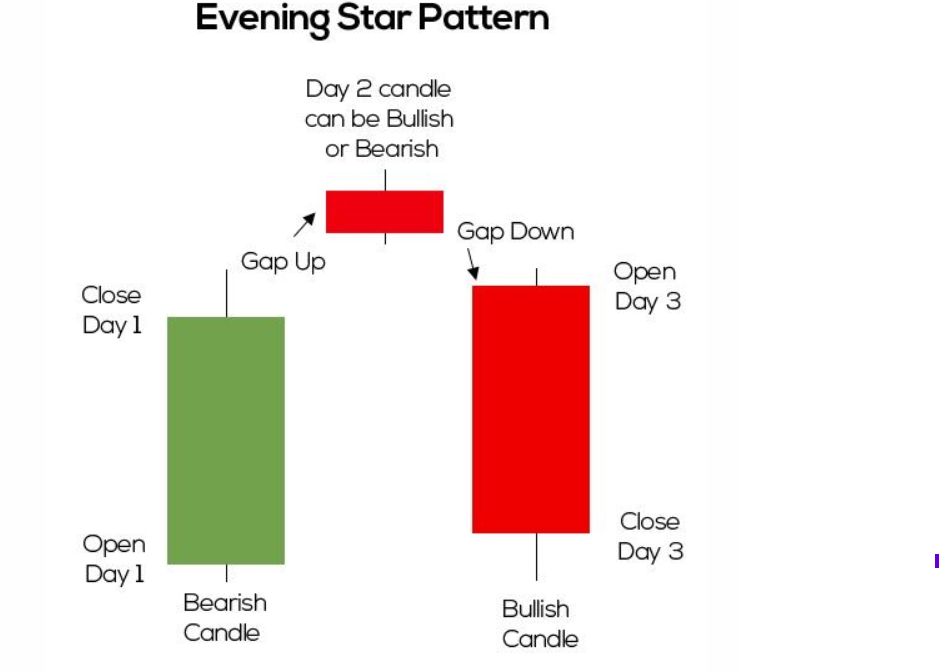
The evening star is a bearish candlestick pattern consisting of three candles. The evening star pattern is a top trend reversal pattern. It starts with a long bullish candle, followed by a small candle indicating indecision, and concludes with a long bearish candle, signalling a potential trend reversal from bullish to bearish. Traders often see it as a selling opportunity. |
Difference Between Morning Star and Evening Star Candlestick Pattern
|
Morning Star Pattern |
Evening Star Pattern |
|
Three candles pattern |
Three candles pattern |
|
Bullish candlestick pattern |
Bearish candlestick pattern |
|
Bottom reversal pattern – appears at the bottom of a downtrend |
Top trend reversal pattern – appears at the top of an uptrend |
|
It begins with a long bearish candle, followed by a small candle indicating indecision (bearish/bullish/neutral), and ends with a long bullish candle, signalling a potential trend reversal from bearish to bullish. |
It starts with a long bullish candle, followed by a small candle indicating indecision (bearish/bullish/neutral) and concludes with a long bearish candle, signalling a potential trend reversal from bullish to bearish. |
|
Morning star candle pattern indicates that sellers have failed, and buyers are dominating the market. |
Evening star candle pattern indicates that buyers have failed, sellers are dominating the market. |
|
From a significant support level, a morning star pattern indicates the potential for traders to open long positions. |
From an important resistant level, the evening star pattern tells traders to short a position. |
|
Traders often view it as a buying opportunity. |
Traders often see it as a selling opportunity. |
|
|
|
Characteristics of Morning Star and Evening Star Candlestick Pattern
Morning Star Candlestick Pattern
The Morning Star is a bullish candlestick pattern with the following characteristics:
First Candle: The pattern begins with a long bearish (red or black) candle, indicating a prevailing downtrend.
Second Candle: The second candle is a small-bodied one, often a doji or spinning top, signifying market indecision. This doji is also called Morning star doji.
Third Candle: The third candle is a long bullish (green or white) candle that closes well above the first candle's open, suggesting a potential trend reversal to the upside.
The Morning Star is considered a reliable signal for a bullish reversal when it occurs after a downtrend, as it indicates a shift in sentiment from bearish to bullish. Traders often use it to make buying decisions.
Evening Star Candlestick Pattern
The Evening Star is a bearish candlestick pattern with the following characteristics:
First Candle: The pattern starts with a long bullish (green or white) candle, indicating an ongoing uptrend.
Second Candle: The second candle is a small-bodied one, often a doji or spinning top, signifying market indecision. This Doji is also called Evening Star doji.
Third Candle: The third candle is a long bearish (red or black) candle that closes well below the first candle's open, suggesting a potential trend reversal to the downside.
The Evening Star is a reliable signal for a bearish reversal when it occurs after an uptrend. It signifies a shift in sentiment from bullish to bearish and is often used by traders to make selling decisions.
How to identify morning star and evening star candlestick patterns?
-
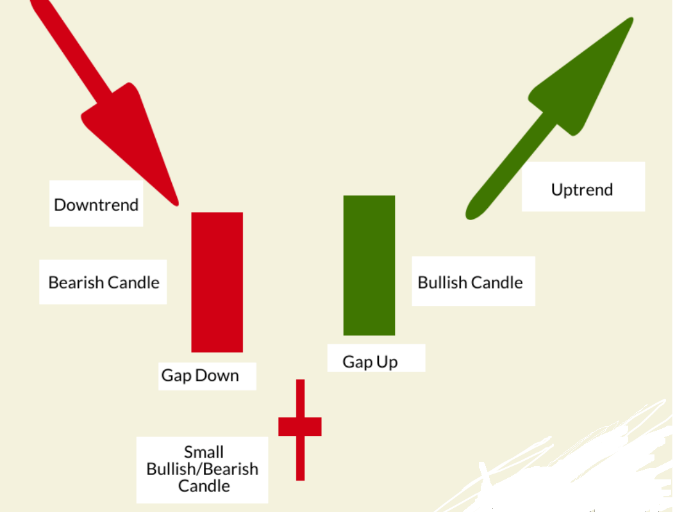
The morning and evening star patterns are reversal patterns.
-
The first candlestick is in the direction of the trend.
-
The second candlestick can be bullish or bearish and has a small body, denoting indecision in the market.
-
The third candlestick is a candlestick in the direction of the reversal, closing preferably beyond the halfway mark of the first candlestick.
When Is Morning Star Pattern Found?
1st candle: When a downtrend occurs, heavy selling takes place due to pessimism. (this is when the first candle forms) – It is long & bearish in nature.
2nd candle: The indecision between buyers & sellers gives rise to the second candle. – It could be a small candle or a Doji.
3rd candle: The anticipation of positive commodity news gives rise to the third candle. – It’s long and bearish.
A change in trend occurs when there is an increase in volume and commodity price.
Evening Star Candlestick Pattern
This is a reversal pattern that is found at the top of an Uptrend.
When Is Evening Star Pattern Found?
1st candle: When Uptrend occurs, heavy buying takes place due to pessimism. (this is when the first candle forms) – It is long & bullish.
2nd candle: The indecision between buyers & sellers gives rise to the second candle. – It could be a small candle or a Doji.
3rd candle: The anticipation of negative commodity news gives rise to the third candle. – It’s long and bearish.
A change in trend occurs when there is an increase in volume and a decrease in commodity price.
What Does a Morning Star Candlestick Pattern Indicate?
The Morning Star candlestick pattern is a strong bullish reversal signal. It indicates a potential reversal of the existing downtrend and a shift in market sentiment from bearish to bullish. When the Morning Star pattern appears, it suggests that buyers may be taking control, and there is a higher likelihood of a price reversal and the beginning of an uptrend.
Traders often use the Morning Star pattern as a signal to consider buying or going long on a particular asset, as it suggests that the selling pressure has diminished, and there is a possibility of an upcoming price increase. However, like any technical pattern, it is important to consider other factors and perform thorough analysis before making trading decisions.
What Does an Evening Star Candlestick Pattern Indicate?
The Evening Star candlestick pattern is a strong bearish reversal signal. It indicates a potential reversal of the existing uptrend and a shift in market sentiment from bullish to bearish. When the Evening Star pattern appears, it suggests that sellers may be taking control, and there is a higher likelihood of a price reversal and the beginning of a downtrend.
Traders often use the Evening Star pattern as a signal to consider selling or going short on a particular asset, as it suggests that the buying momentum has weakened, and there is a possibility of a forthcoming price decline. However, it's important to consider other factors and perform thorough analysis before making trading decisions, as no pattern is foolproof, and market conditions can change.
How to trade Morning Star Pattern and Evening Star Candlestick Patterns
Morning Star Trading
Morning star candlestick pattern is identified by a small bearish or bullish candle, followed by a long bullish candle.
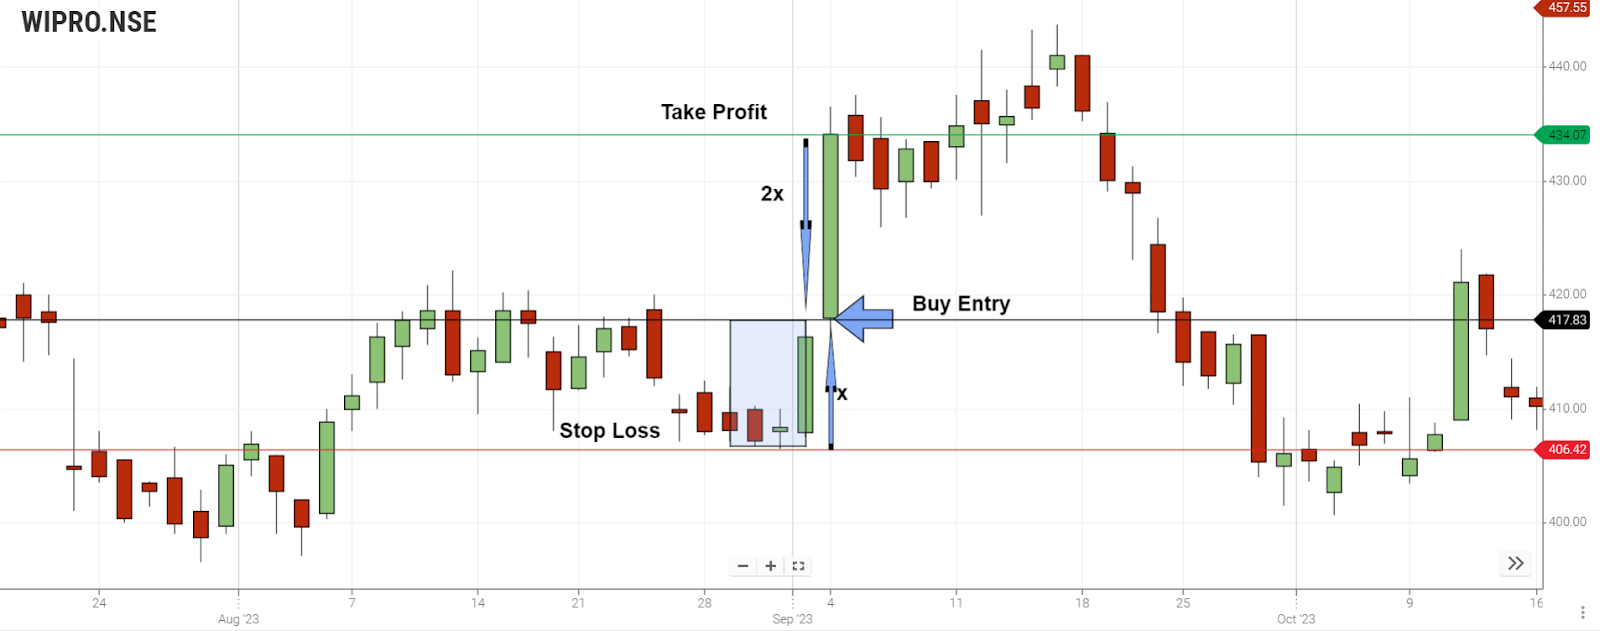
Long buy entry is placed at the opening of the next candle next to morning star candles. Stop loss order is placed at the low end of morning star candles. Target profit is placed at a distance from buy entry which is twice the distance between buy entry and stop loss order.
Evening Star Trading
Evening star candlestick pattern is identified by small bearish or bullish candle, followed by long bearish candle.
A short sell entry is made at the opening of the next bearish candle after the evening star pattern. Stop loss order is placed at the high end of the evening star candle pattern. Target profit is placed at a distance from sell entry which is twice the distance between sell entry and stop loss order.
Summary
Both the patterns are used to identify a trend. The Morning Star pattern can be treated as a Buy signal. The Evening Star pattern can be treated as a Sell signal. During an uptrend, high optimism causes heavy buying. The first candle forms. It’s long and bullish. The indecision between the buyers and sellers forms the second candle. It’s a small candlestick—or a Doji. The expectation of negative commodity news in the market forms the third candle. It’s long and bearish. When the volume increases and the price decreases, it suggests a change in trend. These patterns are used for trend identification. The Morning Star pattern is used as a buy signal. The Evening Star is used as a sell signal. It’s advisable to use a combination of patterns and indicators to determine your trading strategy. To ensure that our trading strategy is effective, it’s always recommended to mix and match the patterns and indicators.
Frequently Asked Questions
Are these patterns always reliable for trading decisions?
While Morning Star and Evening Star candlestick patterns are considered reliable, they are not infallible. It's essential to use them in conjunction with other technical and fundamental analysis to make well-informed trading decisions.
Can these patterns be found in various timeframes?
Yes, Evening star and Morning Star Candle Stick patterns can appear in different timeframes, from intraday charts to daily, weekly, and beyond. The timeframe can influence the significance of the pattern.
What is the significance of the doji or spinning top candle in these patterns?
The doji or spinning top candle in the second position of the pattern represents market indecision. It acts as a transition point from the existing trend to the potential reversal, highlighting uncertainty in the market.
Are there variations of the Morning Star and Evening Star patterns?
Yes, there are variations with different names, such as the "Abandoned Baby" and the "Morning Doji Star" for bullish reversals and the "Evening Doji Star" for bearish reversals. These variations emphasize the doji candle in the pattern.
Should traders wait for confirmation after spotting these patterns?
It's often advisable to wait for confirmation through subsequent price action before making trading decisions based solely on Morning Star pattern candlestick or Evening Star patterns. Confirmation can help reduce false signals.