Knowledge Center Technical Analysis
Candlestick Patterns
Doji Candlestick Pattern
Doji candlesticks occur when the opening and closing prices of an asset are almost the same, making their bodies very short compared to regular candlesticks.
They show that the market is uncertain, with buyers and sellers balanced and unable to strongly influence prices. Depending on the type of Doji, they can signal a slowing trend or a possible price reversal.
Understanding Doji patterns helps traders know when a trend might be ending, allowing them to exit trades, or when a new trend is beginning, helping them make profitable trades.
Classification Of Doji candlestick Pattern
There are four types of candlestick patterns:
1. Neutral Doji
2. Long-Legged Doji
3. Gravestone Doji
4. Dragonfly Doji
How to trade with different types of Doji Candlestick Pattern
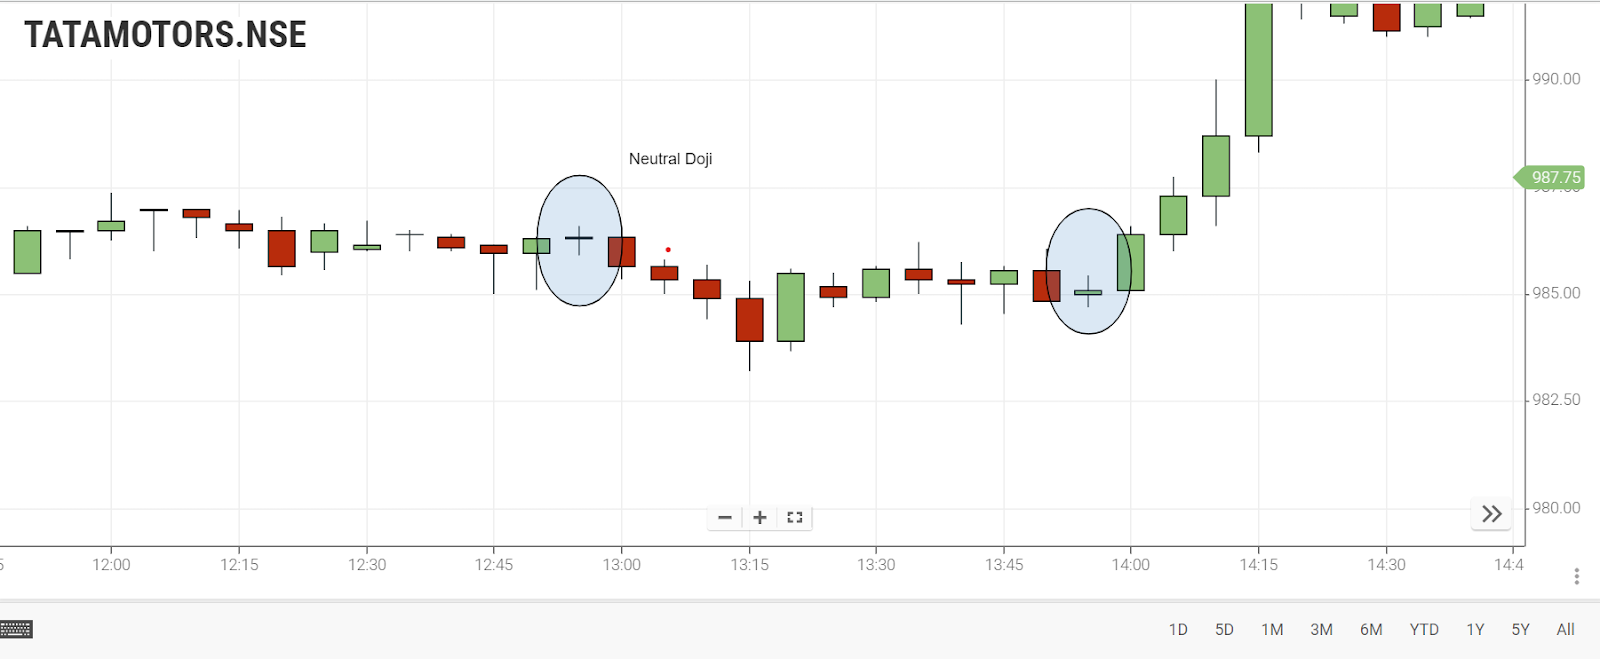
1. Neutral Doji
The Doji pattern is a small candlestick pattern that emerges when buying and selling activities reach equilibrium. It occurs between the day's highest and lowest prices, with the commodity opening and closing at the same level. This pattern signifies market indecision and uncertainty among traders. The future direction of the trend is determined by both the prior trend and the positioning of the Doji pattern in the market sequence. Traders closely monitor the Doji to anticipate potential changes and reversals in the market, making it a crucial indicator in decision-making.

If you see a neutral Doji candlestick during a time when prices are rising fast and, at the same time, the RSI (a measure of market momentum) is very high, it might mean the market is about to slow down or go down.
On the other hand, if this same type of candlestick appears when prices are falling, and the RSI is very low, it could suggest that the market might start going up again soon.
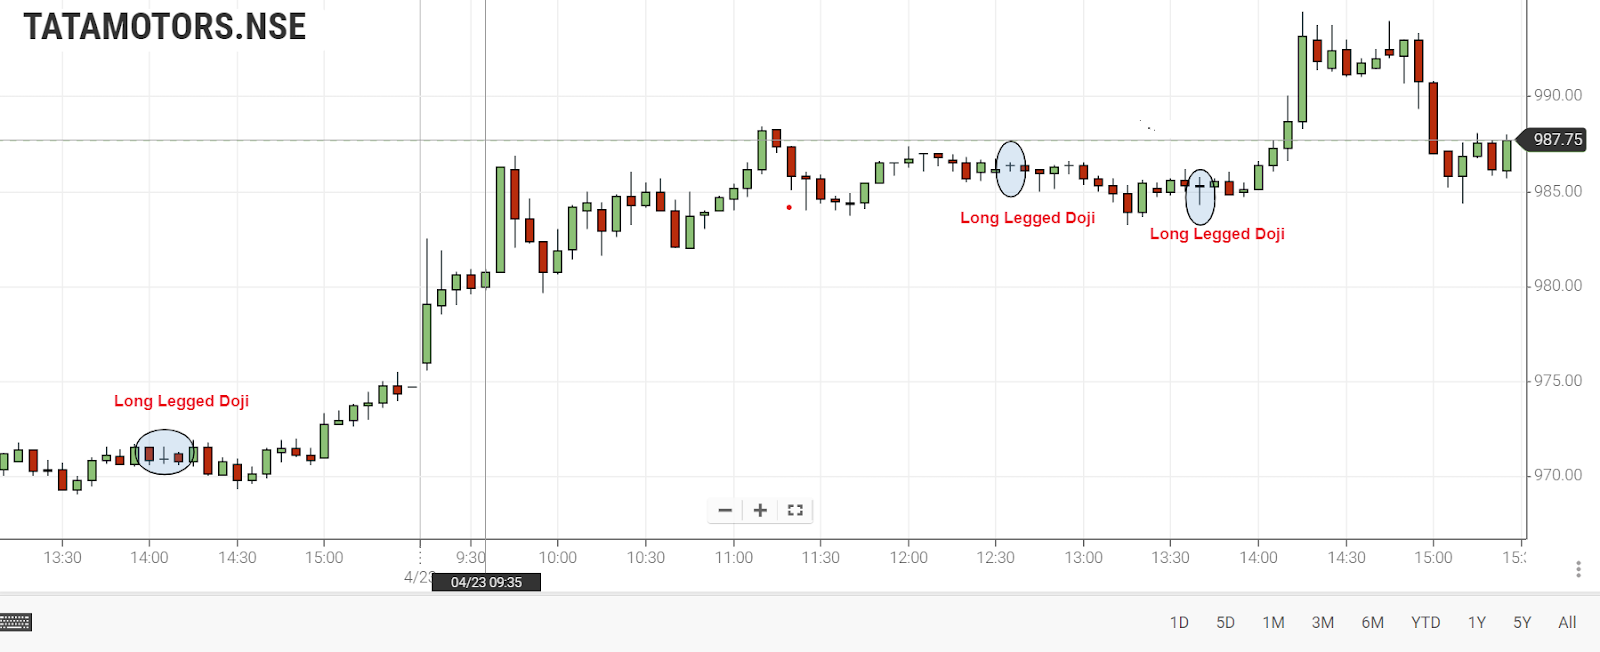
2. Long-Legged Doji
This pattern is called a long candlestick because it covers a lot of price range.
It happens when buyers and sellers are evenly matched.
The price starts and ends in the middle of the day's highest and lowest points.
Whether the market goes up or down next depends on how things were going before and this specific candlestick pattern.
Traders need to pay close attention to the closing price of a long-legged Doji candlestick. If the closing price is below the middle of the candle, especially near resistance levels, it's a bearish signal. On the other hand, if the closing price is above the middle, it's bullish, resembling a bullish pin bar pattern.

If the closing price falls right in the middle, it might indicate a continuation of the current trend. Traders can look at past candles to forecast future trends in this scenario.
3. Gravestone Doji
This pattern occurs at the end of a downtrend when buyers and sellers are evenly matched. The commodity starts and ends at the day's lowest price.
Where the trend goes next is influenced by previous trends and this specific Doji pattern.
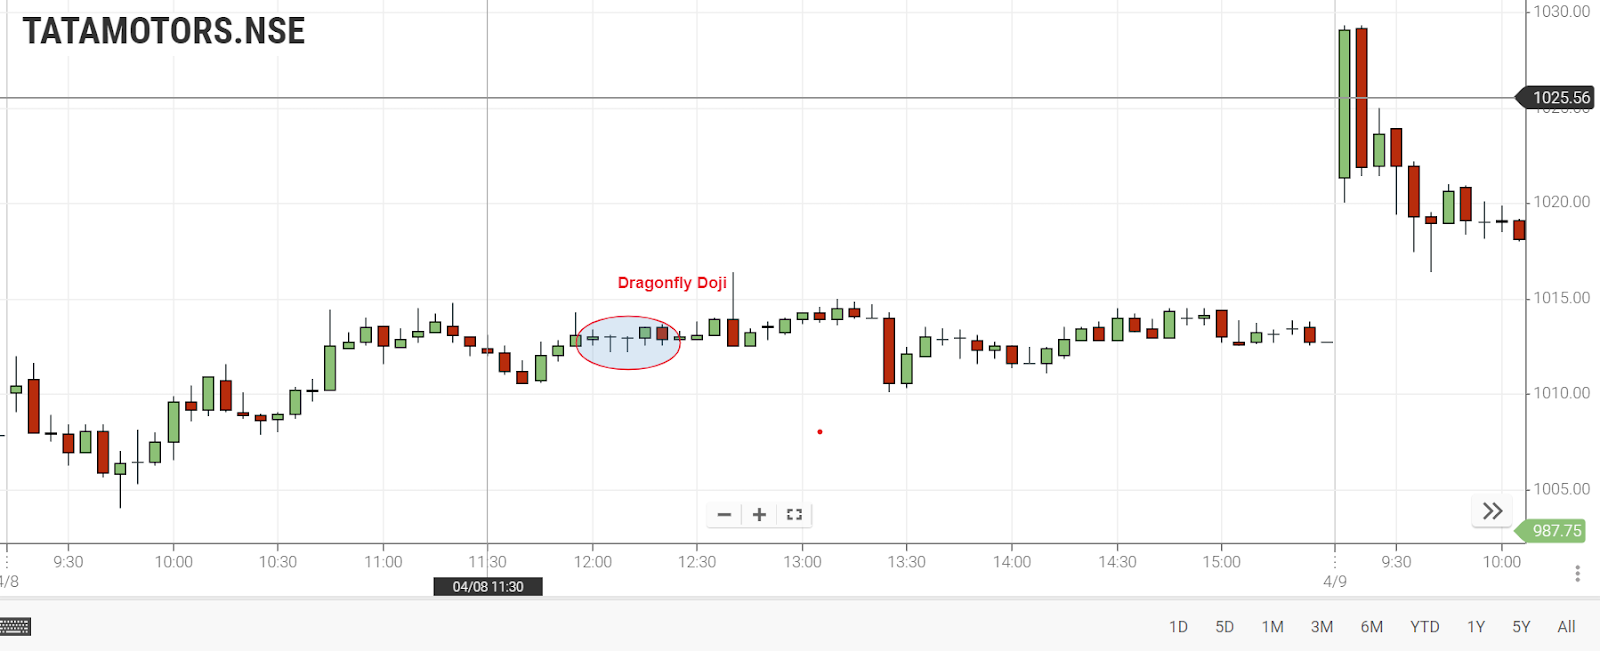
4. Dragonfly Doji
This pattern occurs at the top of an uptrend when buyers and sellers are evenly matched. The commodity starts and ends at the day's highest price.
If the Dragonfly Doji pattern appears at the end of a downtrend, it can be seen as a signal to buy.

On the other hand, if the candlestick appears during an uptrend, it suggests a possible reversal.
Hence, trading with the Doji candlestick signals market indecision, as its opening and closing prices are nearly identical. To understand this candle, traders should examine the preceding candles, searching for hints of an upcoming trend change. For instance, a series of preceding upward candles followed by a Doji suggests a pause in the bullish trend and a potential reversal, while the opposite indicates a potential pullback.
Uses of Doji candlestick pattern
-
Understanding the Doji pattern is valuable for recognizing trends.
-
If it forms at a support level, it can serve as a potential "entry point."
-
When it appears at a resistance level, it can be seen as a possible "exit point."
-
For a reliable trading strategy, it's advisable to combine various patterns and indicators.
Importance of Doji Signals in Candlestick Patterns
Candlestick patterns are incredibly versatile tools for both intraday and swing traders. They act as reliable indicators, warning about potential reversals, signaling entry points, and defining stop-loss levels all at once.
Sometimes, just one candle, like a Doji, or a series of candles, such as Three Black Crows, can provide powerful signals. Recognizing these patterns can optimize profits in various trading strategies. For experienced traders, these distinct candle shapes start to convey meaningful information, and spotting their potential becomes a high probability for profit.
How to Utilize Candlestick Chart Patterns in Intraday Trading
Intraday trading requires specific technical tools, such as candlestick patterns, to swiftly identify trends, be they continuations or pullbacks. Candlestick patterns offer numerous authentic trade signals, providing ample opportunities for intraday traders to enter trades promptly. Each aspect of a candlestick, whether its 'body' or 'shadow', serves as an indicator of the prevailing market sentiment. For instance, a Doji candlestick pattern's interpretation in intraday trades varies based on preceding candles, indicating either a bullish or bearish transition.
Nutshell
-
Doji Patterns: Signify market indecision, hinting at potential trend shifts.
-
Types: neutral, Long-Legged, gravestone, and dragonfly doji represent diverse market situations.
-
Trading Insights: Doji patterns aid in timely trade entries and exits, enhancing trading strategies.
-
Intraday Use: Intraday traders rely on these patterns for quick trend assessment and informed trading decisions.
Frequently Asked Questions
-
How many candlestick patte rns are there?
There are various candlestick patterns, with Doji being one of them, each providing unique insights into market behavior and potential trading opportunities.
-
Is a Doji bullish or bearish?
A Doji candle can be either bullish or bearish, depending on its context in the market and the preceding price action.
-
What is the meaning of the Doji candlestick?
A Doji candlestick represents market indecision, often occurring at key turning points in market trends.
-
How many types of Doji candlesticks are there?
There are several types of Doji candlesticks, including neutral Doji, Long-Legged Doji, dragonfly Doji, and gravestone Doji.
-
What does a Doji candlestick indicate?
A Doji candlestick indicates a balance between buyers and sellers, highlighting market uncertainty and potential trend changes.
