Knowledge Center Technical Analysis
Wedge Patterns
Broadening Bottom Chart Pattern
Introduction
A broadening bottom pattern usually forms in a downtrend and potentially signals a bull market reversal. It has the appearance of a megaphone as the price expands with higher highs and lower lows.
This chart pattern looks like a potential correction before moving lower but indicates a reversal in the previous trend. A broadening bottom is a form of consolidation and forms support and a new base for the bull reversal.
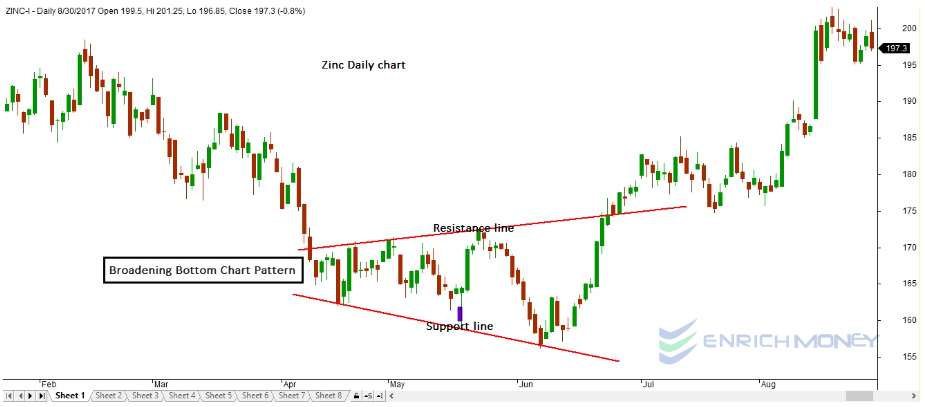
A Broadening bottom is established when the price halts before making a lower low (after making at least 2 highs and 2 lows) and heads higher taking out the previous high.
How does a Broadening Bottom Chart pattern look like?
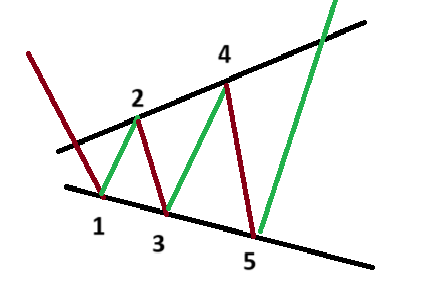
A Broadening triangle pattern is characterized by two diverging trendlines on a price chart, forming a widening or broadening shape. Here's a more detailed description:
Diverging of Trendlines:
Upper Trendline: Connects successive higher highs in the price action.
Lower Trendline: Connects consecutive lower lows in the price action.
Widening Shape:
As the pattern develops, the distance between the upper and lower trendlines increases, creating a broadening or megaphone shape.
When does a Broadening Bottom Chart pattern is formed?
A Broadening Bottoms is formed when the price action on a chart exhibits a specific set of characteristics. Here are the key conditions that contribute to the formation of a Broadening formation:
Diverging Trendlines:
The pattern is characterized by two trendlines moving in opposite directions. The upper trendline connects consecutive higher highs. The lower trendline connects consecutive lower lows.
Widening Shape:
As the pattern develops, the distance between the upper and lower trendlines increases, forming a broadening or megaphone shape.
Market Downtrend: The pattern often appears after a prolonged downtrend, indicating increased volatility and uncertainty as the market experiences wide price swings.
Volatility Expansion:
The pattern reflects an expansion of volatility in the market. The price alternates between higher highs and lower lows, indicating increased uncertainty. This volatility and divergence in trendline signify indecision among market participants. This could be due to changing fundamental factors or conflicting opinions about the future direction of the asset.
Potential Reversal: The Broadening Bottom pattern is often interpreted as a bullish reversal signal.
Confirmation Breakout:
The pattern is deemed complete when the price breaks above the upper trendline. This breakout above the upper trendline confirms the bullish reversal and is often used as a trigger for trades.
What does a Broadening Bottom Chart pattern indicate?
The Broadening Bottom pattern indicates several key aspects:
Increased Volatility and Indecision: The widening price range and diverging trendlines in a bullish expanding triangle pattern suggest a period of increased volatility and indecision in the market. This could be attributed to conflicting views among investors about the future direction of the asset.
Reversal Potential: The bottom chart pattern is often interpreted as a bullish reversal signal, especially when it forms after a prolonged downtrend. The higher highs and lower lows, along with the expanding pattern, may signify that sellers are losing control, and buyers are gaining strength.
Shift in Market Sentiment: The formation of a Broadening Bottom suggests a shift in market sentiment from bearish to potentially bullish. Traders and investors closely watch for a breakout above the upper trendline as a confirmation of this sentiment shift.
Caution and Confirmation: Traders should approach the Broadening Bottom pattern with caution and seek confirmation from other technical indicators or signals. False breakouts or breakdowns are possible, and confirming the pattern's validity can reduce the risk of making incorrect trading decisions.
Potential Opportunities: A successful breakout above the upper trendline may present a buying opportunity, anticipating a new uptrend. However, it's crucial to consider the broader market context and use risk management strategies.
How to trade when you see a Broadening Bottom Chart pattern?
Trading a Bullish Expanding Triangle pattern involves a systematic approach to capitalize on potential bullish reversal signals. Let's analyze the broadening chart pattern with the help of a charts.
Strategy 1:
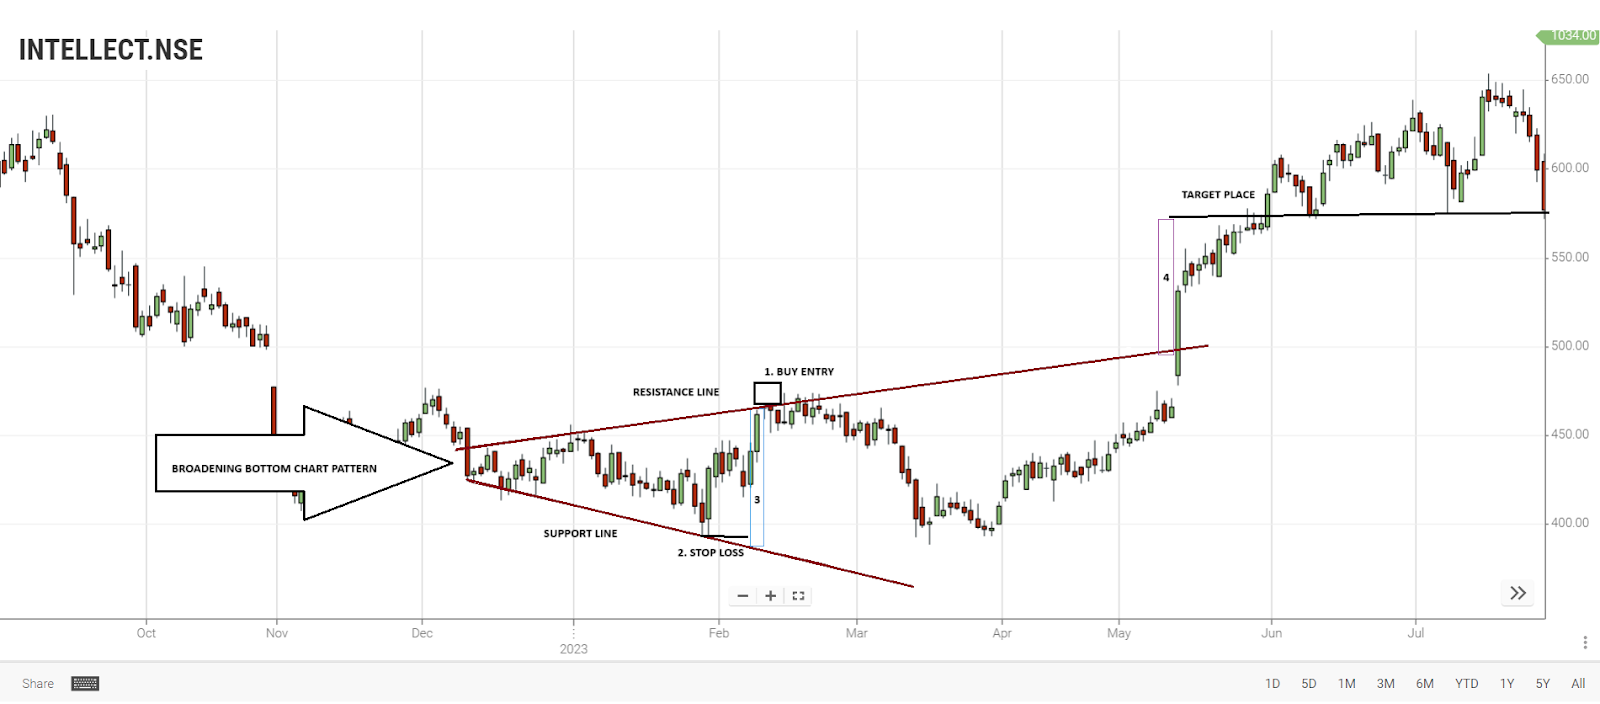
Description of the Broadening Channel pattern
1 – Buy order is executed by the trader
2 – Stop loss order will be executed
3 – Profit Target distance
4 - Target position to take profit
Generally, the broadening chart pattern is broken after 5 hits of the support lower trendline. It is observed that the price has started to break upwards of the overall size of the bottoming pattern
Procedure
Trade as soon as the price breaks out of the Broadening bottoms.
Enter the trade when the candlestick has closed above the Broadening upper trend line.
Place your stop loss on the other side of the Broadening bottoms below its lower trend line.
Before the consolidation of the market, calculate the initial rise in price.
Place the profit target the same distance above the broadening’s breakout point.
Strategy 2:
li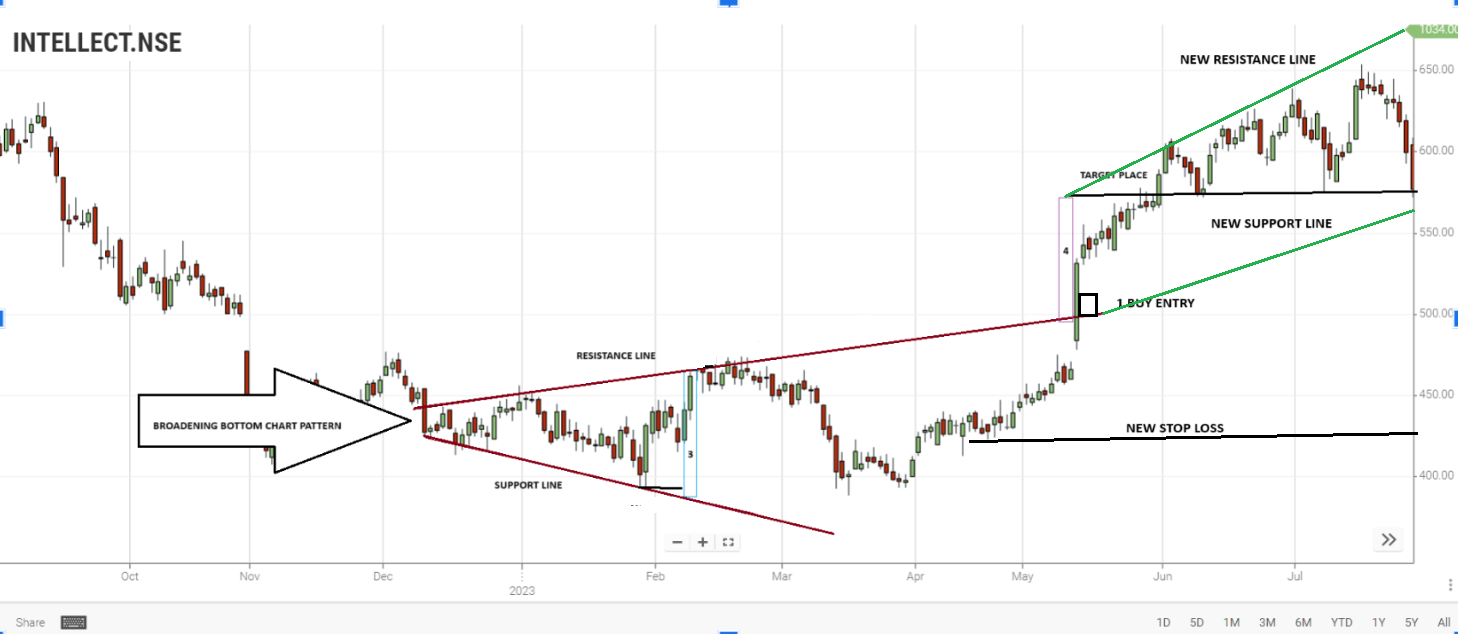
Description of the Broadening Channel pattern
1 – Buy order is executed by the trader after the price has bounced off the trend line
2 – New Stop loss order will be executed underneath the new support line
4 – Profit Target distance & Target position to take profit
Procedure
Wait for the price to rise above the broadening’s upper trend line.
Enter your trade as soon as the price rises above the broadening upper trend line.
Place a buy order after the price retests that trend line once the resistance breaks,
The broken resistance now becomes the support level.
Place your stop loss below the new support area.
Place your profit target.
Calculate the size of the broadening pole. Place your profit target an equal distance above the broadening breakout. (Entry of our trade)
Steps to consider when trading a Broadening Bottom
Identify the Pattern:
Confirm that a widening triangle pattern is forming by observing the diverging upper and lower trendlines and the widening shape on the price chart.
Wait for Confirmation:
Don't enter a trade solely based on the visual appearance of the expanding chart pattern. Wait for confirmation, typically in the form of a breakout.
For a bullish reversal, wait for the price to break above the upper trendline. For a bearish reversal, wait for a breakout below the lower trendline.
Understand the Prevailing Trend:
Determine the direction of the trend before the bottom pattern emerged. If it's after a downtrend, it might suggest a bullish expanding triangle reversal. If it's after an uptrend, it could indicate a potential bearish expanding triangle reversal;
Wait for the Breakout:
Patiently wait for a decisive breakout above the upper trendline. This breakout serves as a potential entry signal, indicating a shift from the downtrend to a potential uptrend.
Entry Point:
Consider entering a long (buy) position when the price convincingly breaks above the upper trendline. Some traders may wait for a close above the trendline to ensure the breakout's strength.
Stop-Loss Placement:
Implement a risk management strategy by placing a stop-loss order below the breakout point. This helps limit potential losses in case the breakout is a false signal.
Target Levels:
Identify potential target levels based on the pattern's projected price move. One common method is to measure the height of the pattern at its widest point and project this distance upward from the breakout point.
Monitor for Continuation Patterns:
Keep an eye on the price action after the breakout. Sometimes, a Broadening Bottom pattern may be followed by continuation patterns or additional bullish signals, providing opportunities for further trades.
Consider Fundamental Factors:
Supplement technical analysis with an assessment of fundamental factors that could support the bullish outlook. Positive news, earnings reports, or changes in market sentiment can reinforce the potential for an uptrend.
Regularly Review and Adjust:
Regularly review the trade and adjust stop-loss or take-profit levels based on the evolving market conditions. This helps manage risk and maximize potential profits.
Alternative Scenarios:
Be prepared for alternative scenarios. Not all breakouts lead to sustained uptrends, and the market can be unpredictable. Have a plan for managing trades that do not unfold as expected.
Summary
The broadening bottom develops in an uptrend in nature.
Getting known with broadening tops and bottoms are more or less the same, except that prices enter the formation after a downtrend.
If the general market is at a turning point (from down to up), prices should reverse course and exit at the top of the chart pattern, but there is no assurance.
Most of the time, 60 % of the pattern reverses the existing price trend. Upgrading on uncertainty, so make sure for the breakout.
It searches for higher highs and lower lows - the broadening bottom pattern that gives the pattern formation.
A minimum of at least two minor highs and two minor lows touching or nearing the trend lines that outline the pattern is required. Look for plenty of price crossings within the trend lines. The volume pattern is unpredictable, increasing in a rising price trend and moving back in a declining price trend.
Frequently asked questions
What is the significance of volume in the Broadening Bottom pattern?
Volume analysis can provide confirmation of the pattern's validity. An increase in volume as the pattern forms and a strong breakout with higher volume can strengthen the bullish signal.
How do I trade the Broadening Bottom pattern?
Traders typically wait for a clear breakout above the upper trendline before entering a long (buy) position. Stop-loss orders are often placed below the breakout point to manage risk, and target levels can be set based on the pattern's projected move.
Can the Broadening Bottom pattern signal false breakouts?
Yes, false breakouts are possible. Traders should be cautious and look for confirmation from other technical indicators or signals to avoid entering trades based solely on the pattern.
Are there variations of the Broadening Bottom pattern?
Yes, variations include the "Right-Angled and Ascending Broadening Formation" and the "Right-Angled and Descending Broadening Formation." These variations have specific characteristics but share the widening pattern of the Broadening Bottom.
How To Spot A Broadening Bottom Chart Pattern?
Broadening Chart Pattern can be confirmed by
Confirmation Of Chart Pattern:
A Broadening bottom is established when the price halts before making a lower low (after making at least 2 highs and 2 lows) and heads higher taking out the previous high.
The Pattern’s Psychology:
This chart pattern displays a unique shape; since its primary trait is that it has higher highs and lower lows. This chart pattern shows us a market that is putting an effort to push lower by attracting more sellers in by causing more worries.
Pattern Signal:
The Broadening Bottom is a bullish reversal.