Knowledge Center Technical Analysis
Wedge Patterns
Ascending Broadening Wedge Pattern- A Trader’s Guide
Introduction
In the world of trading, recognizing chart patterns is essential. One such pattern is the ascending broadening wedge, known for predicting price moves. This guide will explain the pattern, how to spot it, and what it means for prices. We'll also cover trading strategies and risk management. Whether you're new or experienced, this guide will help you use the ascending, broadening wedge in your trading. Let's explore this pattern and improve our trading skills together.

Ascending Broadening Wedge in simple terms:
-
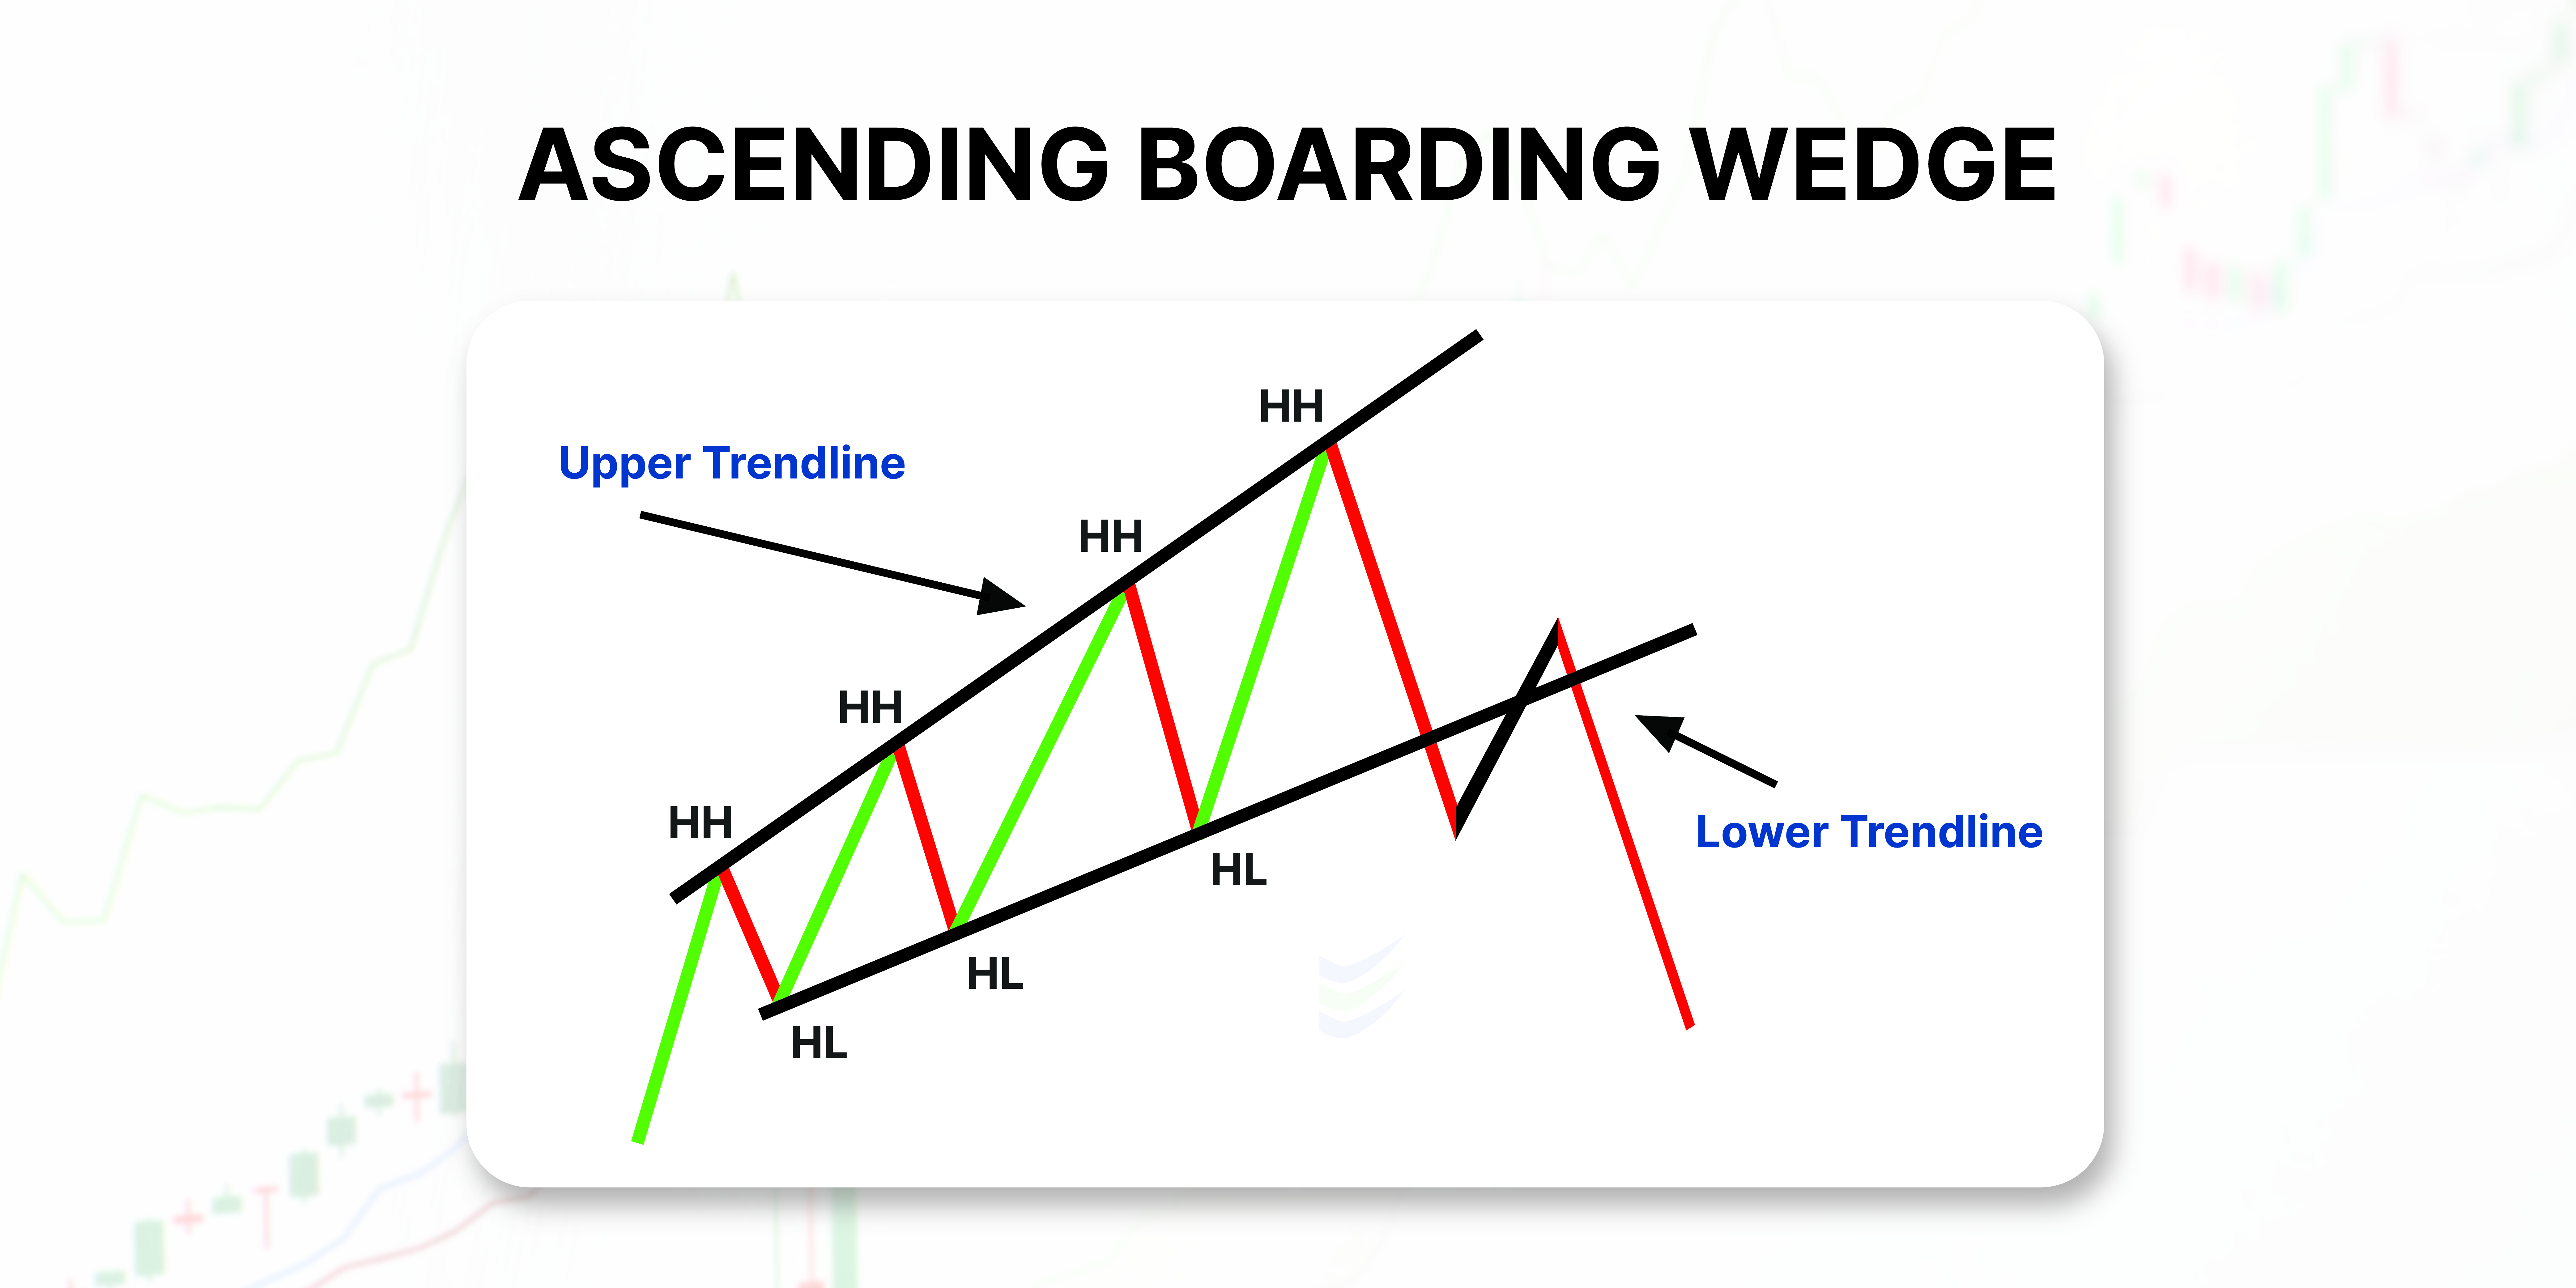
Higher Highs and Higher Lows: Prices make higher highs and higher lows, indicating upward momentum.
-
Widening Trendlines: The upper and lower trendlines move apart over time, showing increasing price volatility.
-
Breakout Potential: Keep an eye on the breakout. If prices break above the upper trendline, it could signal a bullish move. Conversely, a break below the lower trendline might indicate a bearish trend.
-
Volume Matters: Pay attention to trading volume. A breakout with high volume often confirms the validity of the pattern.
Remember, while the ascending broadening wedge can provide clues about potential price moves, it's just one tool in your investor toolkit. Combine it with other analyses and risk management strategies to make informed investment decisions."
Trading in an ascending, Broadening Wedge Pattern
Having understood the Ascending Broadening Wedge pattern in simple terms, let's break down how you can trade within an ascending broadening wedge pattern, especially if you're new to investing.
Step 1: Confirm the Pattern Before anything else, make sure you can clearly see those expanding trendlines on your chart. That's your signal that the pattern is there.
Step 2: Trading Within the Range There are a couple of ways you can approach trading in this pattern. Some folks like to trade within the range. That means if the price is bouncing up and down within the wedge, they might buy when it's close to the lower trendline and sell when it's near the upper trendline.
Step 3: Breakout Trading Another approach is to wait for a breakout. If the price breaks above the upper trendline, that could be your cue to buy. On the flip side, if it breaks below the lower trendline, it might be time to consider selling.
Step 4: Swing Trading Now, for swing traders, here's a tactic: Jump in when the price is on the rise within the wedge. Then, make your move when it touches the upper trendline. But don't forget to set a stop-loss order just below the lower trendline to manage your risk.
Step 5: Look for Those Touches Keep an eye out for the price line touching those upper and lower trendlines multiple times during the pattern's formation. These touches can offer you trading opportunities.
Step 6: Follow the Breakout Finally, remember this golden rule: When trading in an ascending broadening wedge, go in the direction of the breakout. If it breaks out upward, think bullish. If it goes downward, consider a bearish trade.
But here's the deal, no matter which strategy you choose, always make sure you've got a solid risk management plan in place. These strategies work best as part of your overall trading strategy."
Examples to understand the Ascending Broadening Wedge pattern.
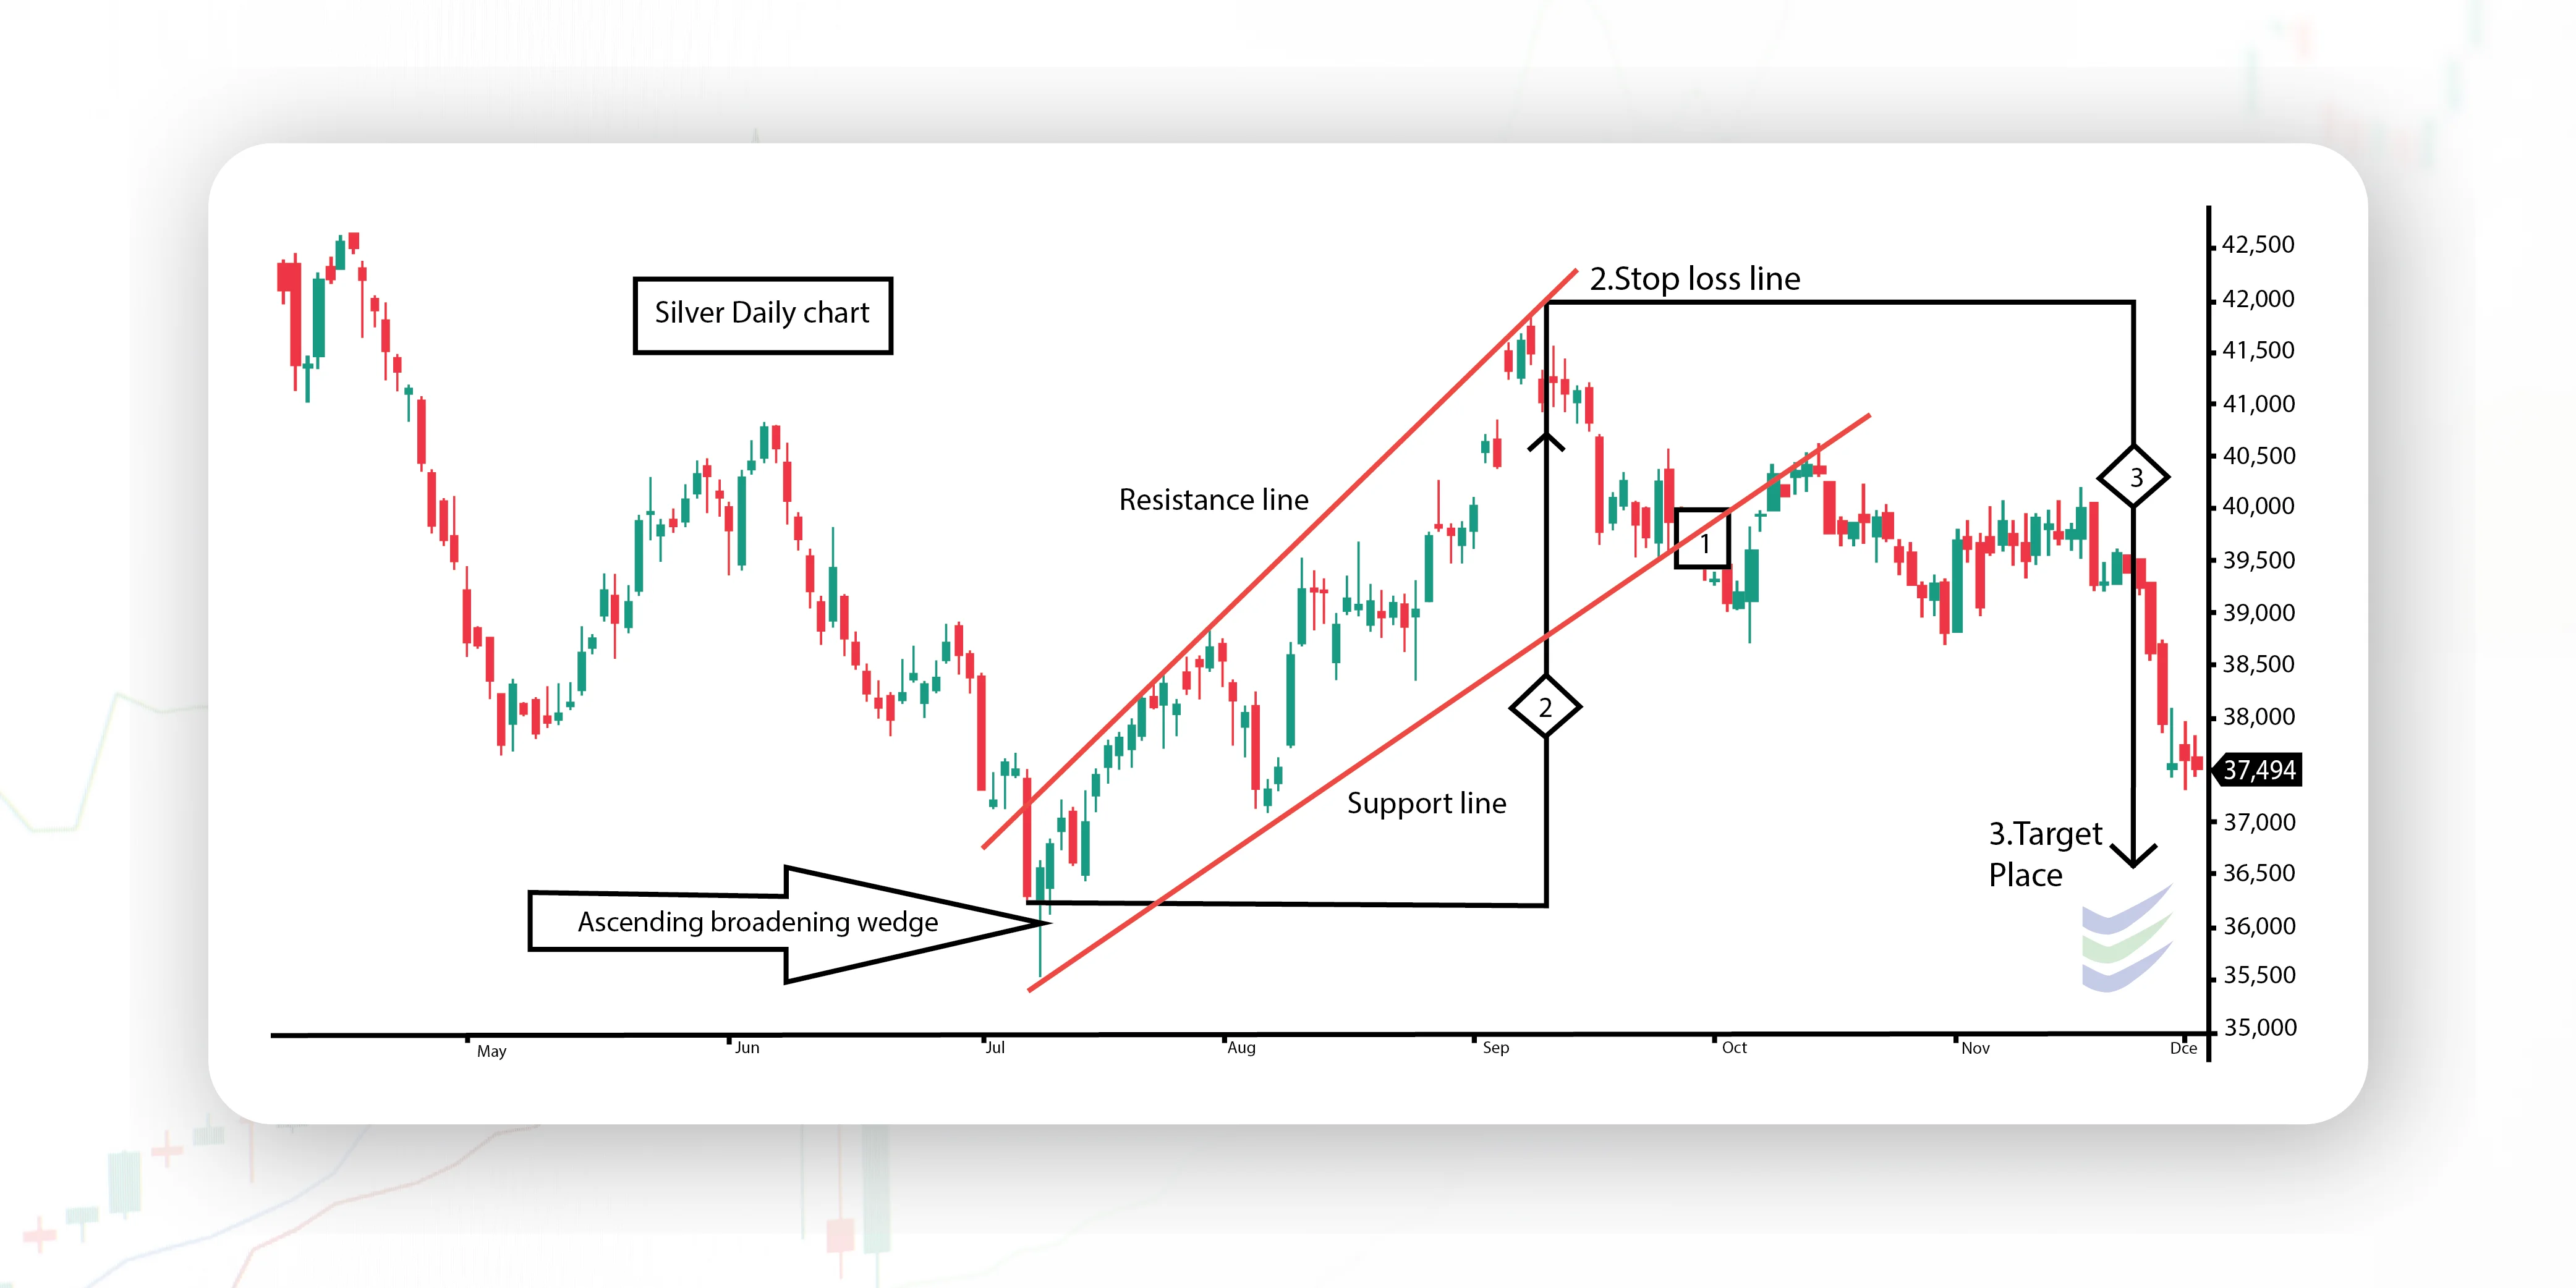
In the chart above, we've got an example of the ascending, broadening wedge pattern. Now, what's interesting here is that there's a slight drop after the breakout. Technically, we wouldn't call it a "partial decline" because it happens after the breakout, but I have to admit, it does look kind of neat on the chart.
Let's take another simple example:
When the price moves higher highs and higher lows, it shows the break of key levels. The price will break a resistance level, On each higher high,. This shows the number of sellers is increasing with time,but they are weak and cannot compete with buyers.
On every wave’s formation, the wave size increases, showing that buyers require more effort to push the price in the bullish direction. Buyers will fail to keep the bullish momentum after 3–5 attempts. This will cause a bearish trend reversal,as many sellers will enter the market.
Understanding technical terms relating to Ascending Broadening Wedge (ASC BW Pattern)

Short entry: The point at which the price, broke the lower trendline.
Back of the wedge: The point where the stop loss would move above the new resistance area.
Profit Target: When we take into account the height of the back of the wedge and lengthen that distance down from the entry,it is the profit target.
Stop Loss: It has to be placed above the higher trendline while trading a ascending, broadening wedge.
Conclusion
In conclusion, the ascending broadening wedge pattern can be a fascinating indicator in the world of trading. It shows us the tug-of-war between buyers and sellers and offers potential insights into future price movements.
Frequently Asked Questions:
What is an ascending, broadening wedge pattern?
It's a chart pattern where price swings between two expanding trendlines (expanding wedge), indicating a potential market.
How to trade using Ascending broadening wedge pattern?
You can buy near the lower trendline and sell near the upper one, or wait for a breakout to buy or sell.
Are there any red flags to watch out for with this pattern?
Yes, if you see the price touching those trendlines several times, it might be a sign that the trend could change direction.
When should I consider bullish and bearish trades using this pattern?
Trade in the direction of the breakout; if it goes up, it is a ascending bullish trade, and if it goes down,it is a ascending bearish trade.
Is this pattern reliable for trading decisions?
No, use it in conjunction with other indicators and risk management strategies for informed trading.
