Knowledge Center Technical Analysis
Trend Analysis
How Do We Trade Using A Trend Line?
Introduction
Trend lines are diagonal lines drawn either above or below the price, serving as valuable indicators of the current trend direction and signaling shifts in trends. Additionally, they function as support and resistance levels, offering opportunities for entering and exiting positions.
Trading with trend lines can be approached in two primary ways:
-
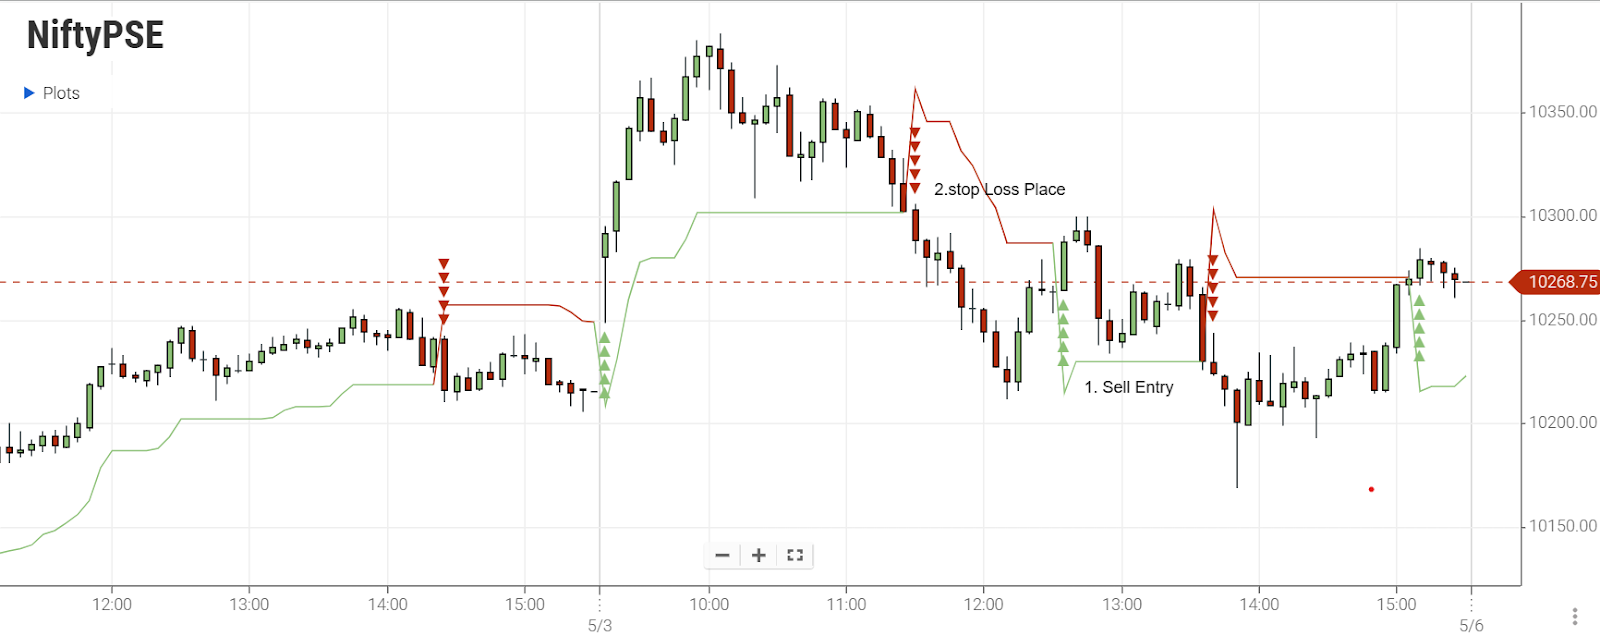
Using trend lines as support or resistance:
One common strategy is to consider trend lines as potential points of support or resistance in the market.
For instance, if the price finds resistance at a trend line pattern, it can signal a trading opportunity.
Traders often set their stop loss levels just above the identified trend line.
This approach is clearly demonstrated in the chart example, where the trend line serves as a resistance level and traders use it for entry.
-
Trendline Breakout Strategy:
The trendline breakout strategy involves recognizing when the price breaks through a trend line, indicating a potential change in the trend.
Traders can choose between two entry methods: the aggressive and the conservative approach.
-
Aggressive Entry:
In this method, traders act swiftly as soon as the candlestick breaks through and closes on the opposite side of the trend line pattern.
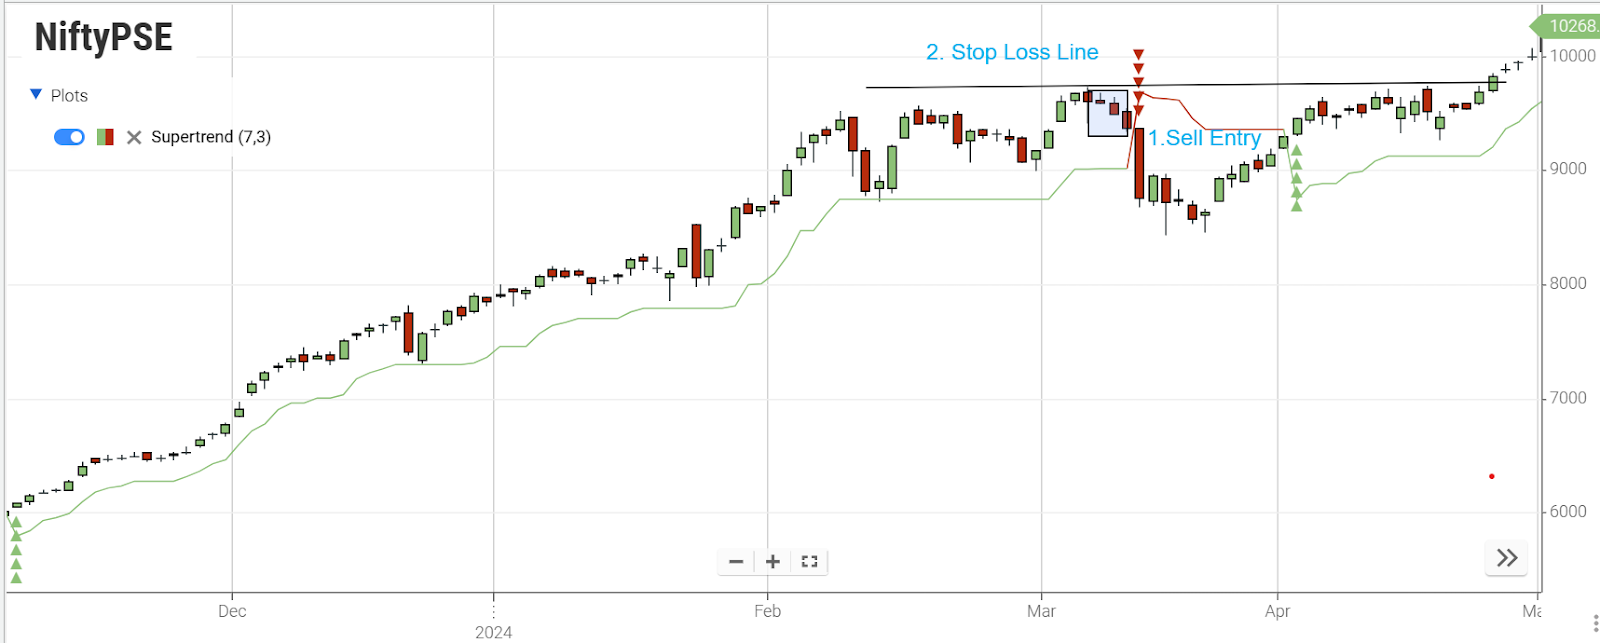
For example, if there's a trendline breakout (a breakout trend) to the downside, traders may consider a short entry.
To manage risk, a stop loss is typically placed just above the trend line.
The chart example above illustrates an aggressive entry following the candlestick's closure on the opposite side of the trend line.
-
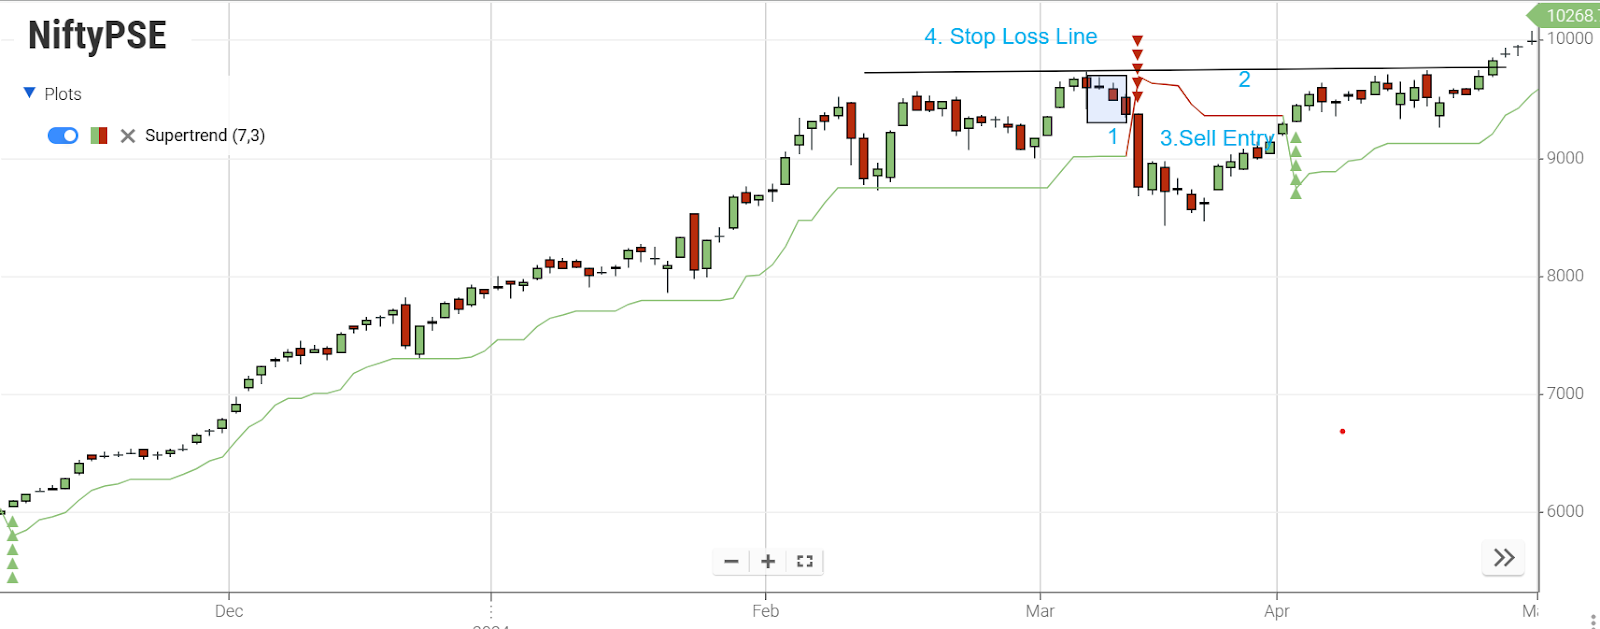
Conservative Entry:
A safer way to trade after a trend line break is to wait. First, let the price break the trend line. Then, see if it touches the trend line from the other side, like a wall or a floor. If it does, you can consider making your move.
-
The price goes down past the trend line.
-
Wait for the price to return to the trend line and face resistance.
-
When you're sure the breakout is real, make a short trade.
-
Put a stop loss above the trend line for safety.
The chart above illustrates a situation where a trend line, initially supporting the price, is broken. Later, the price checks it from the opposite side, acting as resistance. This strengthens the belief that the breakout will probably persist. Once the trend line has been confirmed as resistance, you can consider taking a short position and put a stop loss on the opposite side of the trend line for safety.
Be cautious with trend line breaks.
Be careful when dealing with trend line breaks. It's wise to wait until a candlestick has either closed on the opposite side of the trend line or tested for support or resistance. If there's no closure on the other side, it's usually not regarded as a genuine break.
-
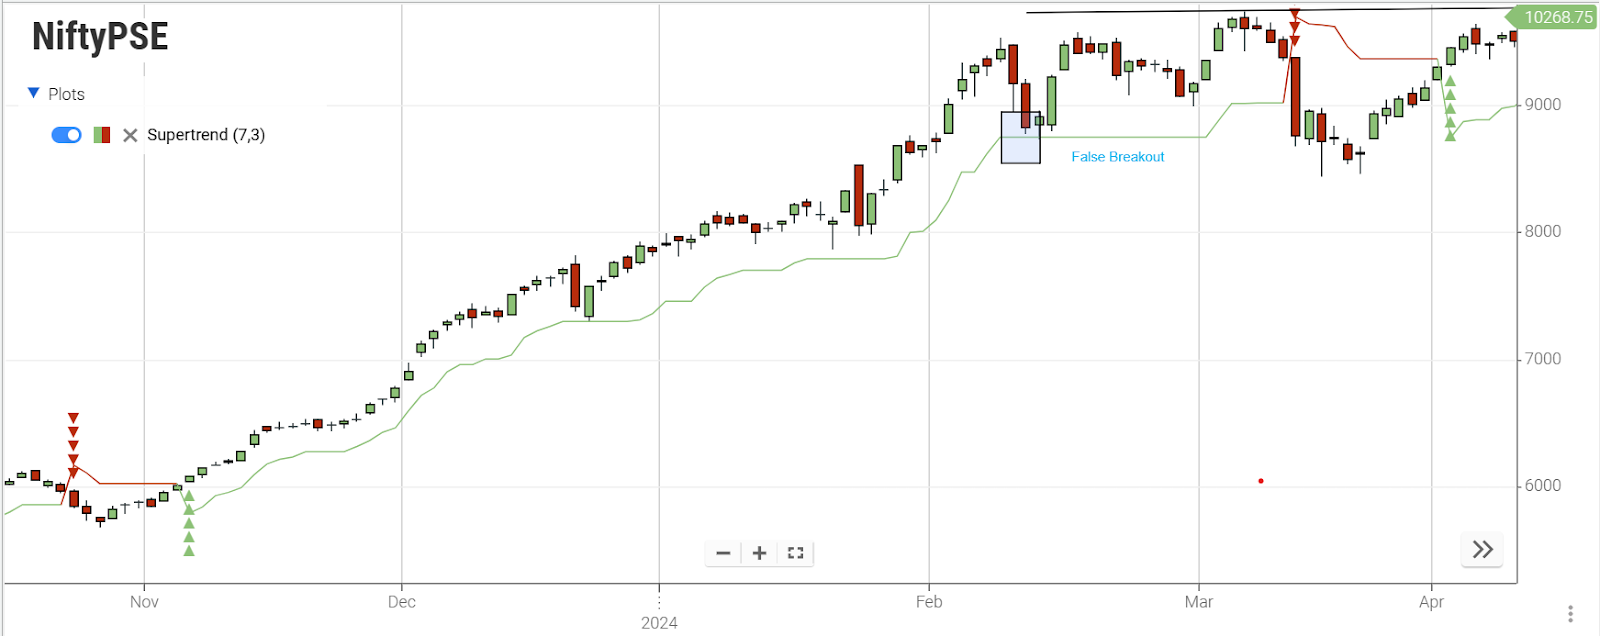
False Breakout
In the chart above, the price initially dropped below the trend line. However, it later rebounded, and the candlestick ended up closing above the trend line. If a trader had entered a trade immediately when the price initially broke through, it would have resulted in a losing trade.
Key Takeaways
In summary, trend lines are invaluable tools for trading:
-
They help spot trends and guide trading choices.
-
Draw below for uptrends and above for downtrends.
-
Verify with at least three highs or lows.
-
More touches make it stronger.
-
Use them as support or resistance for trades.
-
Trendline breakouts offer trading opportunities.
-
Consider automated systems for better trendline trading strategies.
Frequently Asked Questions
-
What is a trend line trading strategy?
A trend line trading strategy is a method using trend lines to identify trends and decide when to buy or sell assets.
-
What are the types of trendlines in technical analysis?
Types of trendlines include uptrend lines (below price for upward trends), downtrend lines (above price for downward trends), horizontal support lines (at support levels), and horizontal resistance lines (at resistance levels).
-
What is a trendline breakout strategy?
A trendline breakout strategy is about trading when the price breaks a trendline, signaling a potential trend change.
-
What is a trading line?
A trading line is another term for a trendline, a diagonal line used to identify trend directions.
-
How do I trade a trendline breakout?
To trade a trendline breakout, identify the trendline, wait for a breakout, confirm it with a close or test, and then enter the trade with a stop loss.
-
How can I use the trendline breakout strategy effectively?
Use different timeframes for confirmation, combine with indicators, manage risk with stop loss orders, stay patient for strong confirmation, and practice on historical data to refine your approach.