Knowledge Center Technical Analysis
Trend Analysis
Identifying support and resistance levels
To pinpoint support and resistance levels, one examines areas on the price chart where the market consistently halts or changes direction. These are zones where buyers or sellers actively participate in the market.
Practice Session:
Exercise 1:
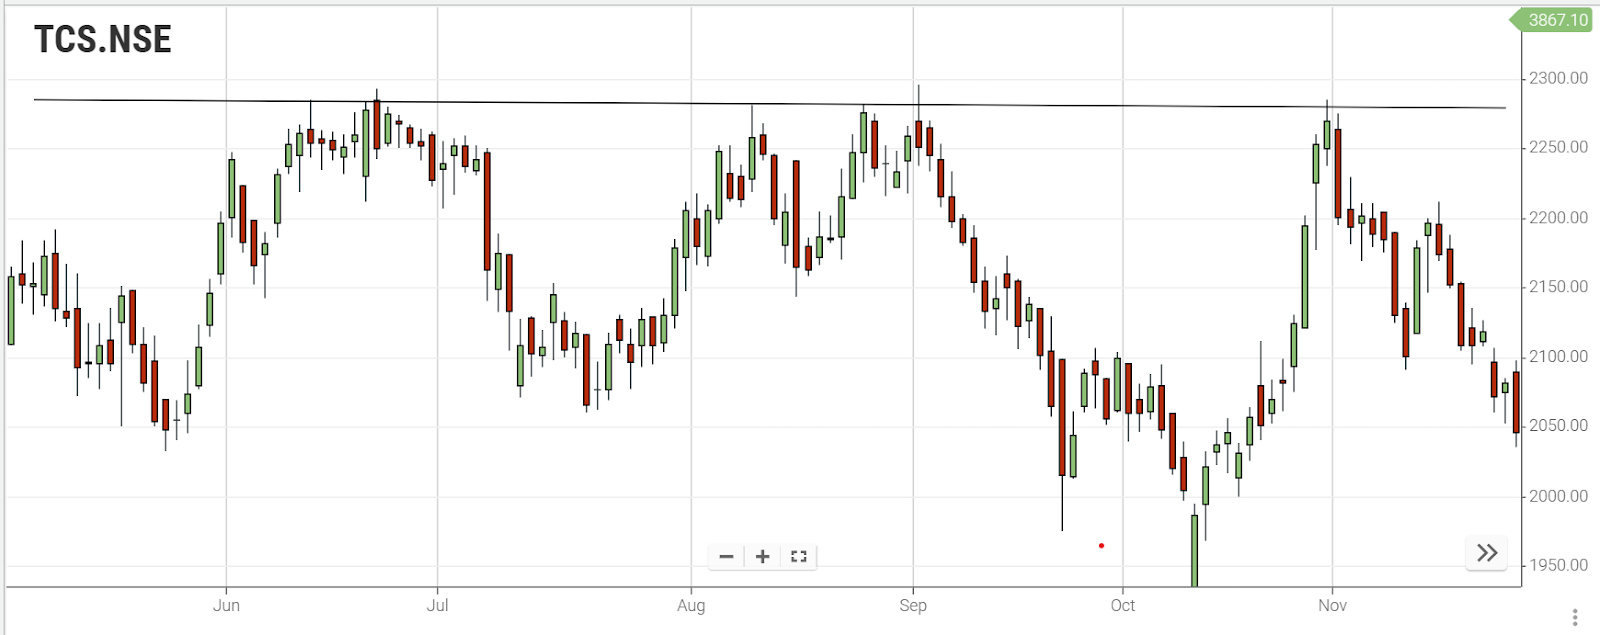
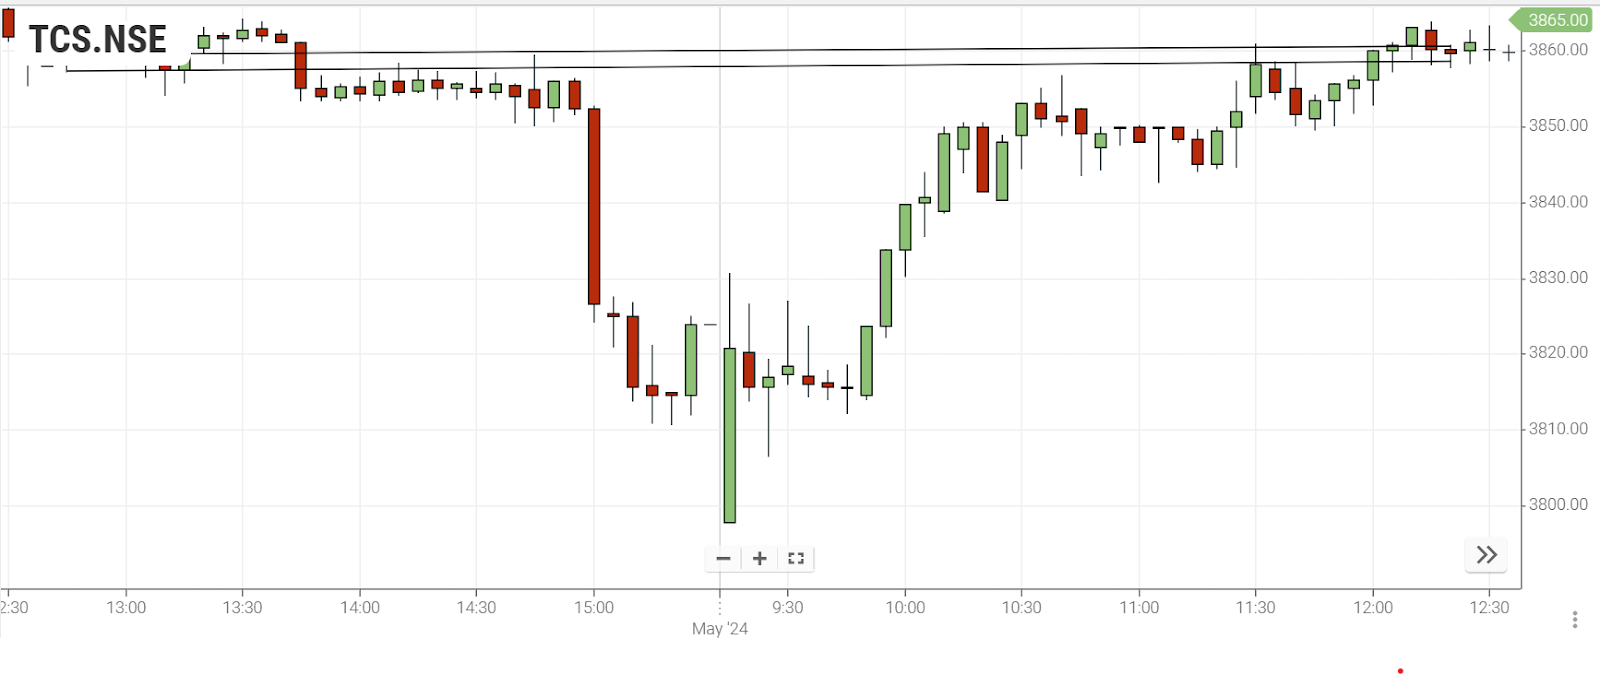
The depicted chart illustrates instances where the price consistently increases and reaches the same level repeatedly. By drawing a horizontal line at the points where the price appears to halt, it becomes possible to identify a resistance level, indicative of sellers entering the market and causing the price to stall.
Exercise 2:
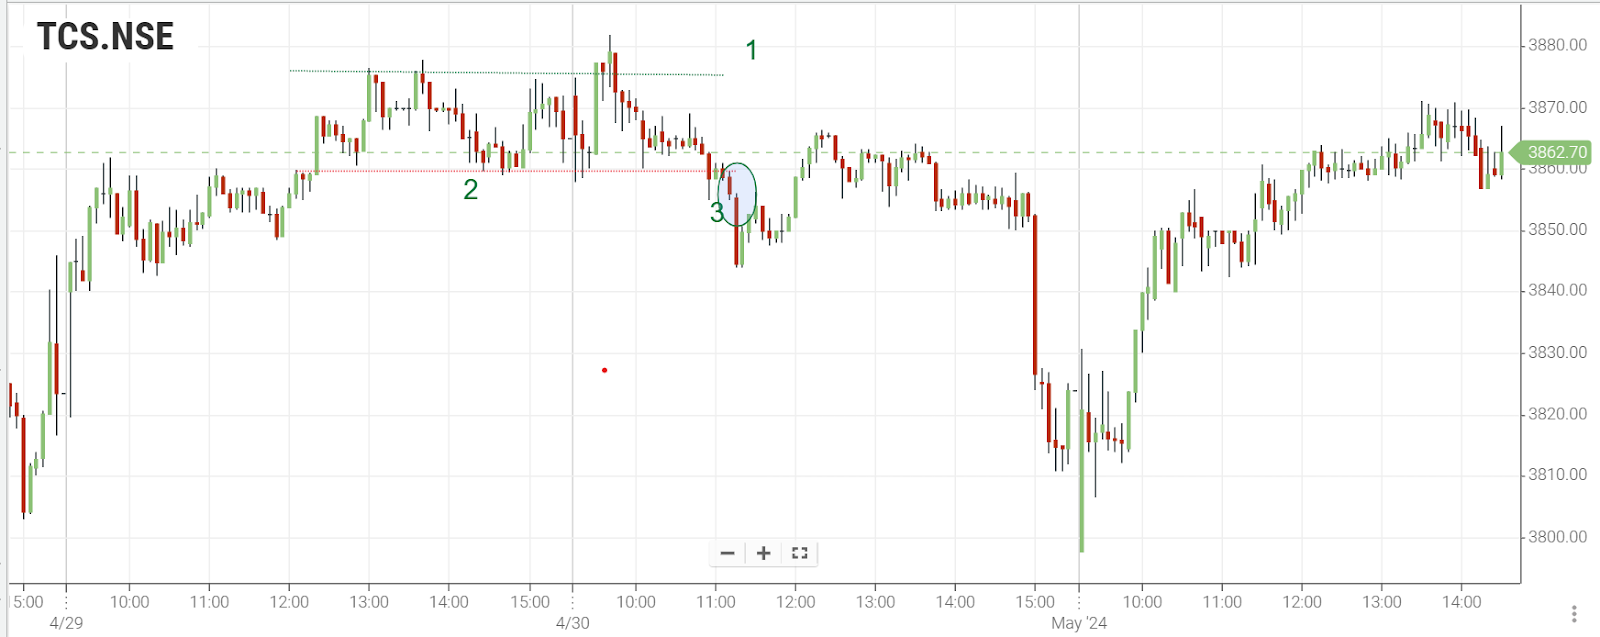
In the chart below, there's an instance where the price descends to a specific level, experiences repeated halts, and subsequently reverses its direction upward. To identify a support level, a horizontal line is drawn at this particular price level. This assists in recognizing a zone where buyers enter the market consistently, prevailing over the sellers, and causing a reversal in the price movement.

Support and resistance in a range
In a sideways market, the price repeatedly touches the same support and resistance levels before finally breaking out of the trading range.
-
Price finds resistance in a range
-
Price finds support in a range
-
The price ultimately breaks out of the range with the support.
As evident from the chart above, the resistance level acts as a distinct upper limit, while the support level serves as a clear lower boundary for the range. A breakout occurs when sellers prevail over buyers, penetrating the established support level.
Establishing support and resistance levels based on candle wicks and bodies.
The next two charts illustrate instances of setting support or resistance lines by considering both the wicks and bodies of the candles. The chart below demonstrates an example of using the wicks of the candles to position a resistance line.
The chart below illustrates an example of employing the bodies of the candles to establish a resistance line. There is no universally correct method for placing support and resistance; rather, it depends on the trader's preference or the strategy being employed.
Support and resistance zones
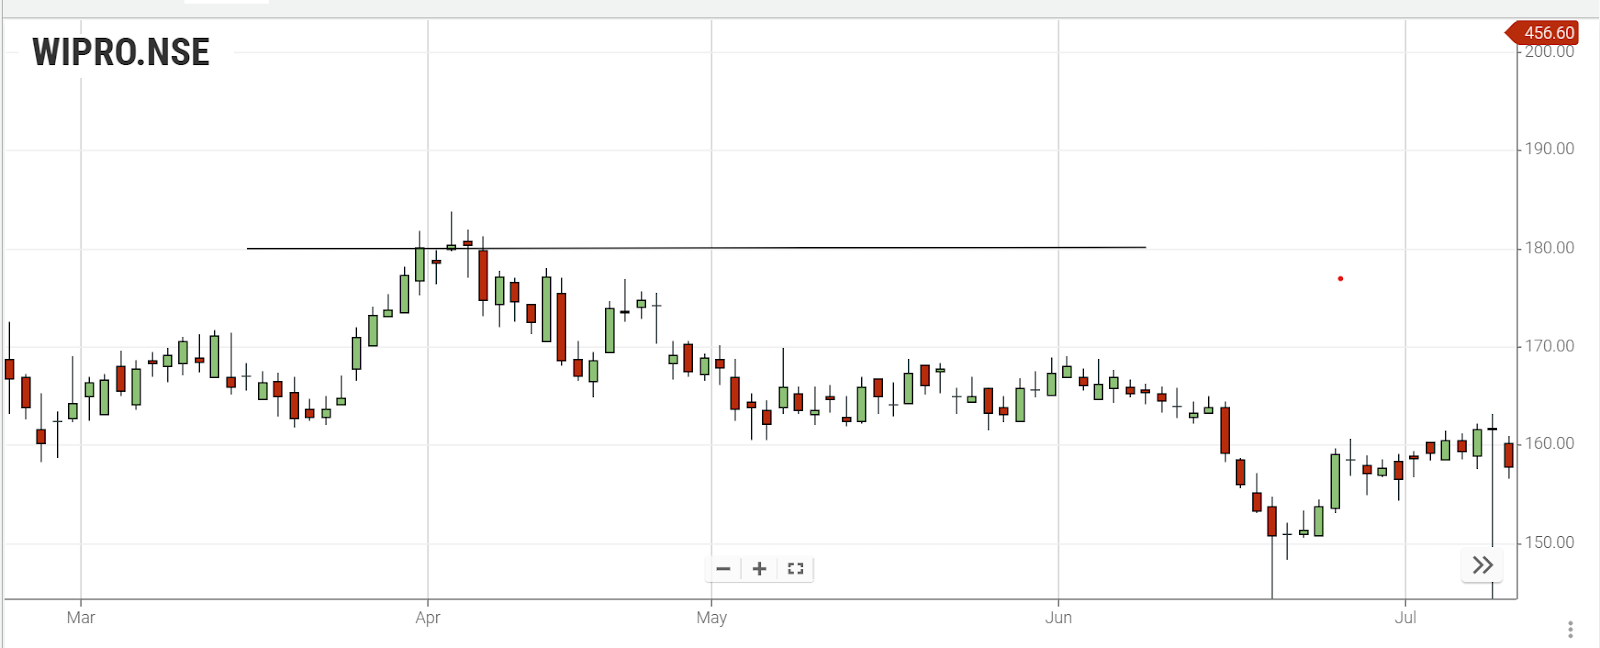
Support and resistance levels are not always easily determined with a single line; hence, it is often more effective to define a zone. In the chart below, you can observe that the price faces resistance multiple times at various levels, highlighting the importance of considering a broader support and resistance zone.
There isn't a specific price level where sellers consistently enter the market; rather, sellers dominate buyers at various price levels. Nevertheless, what is evident is the existence of a resistance 'zone,' indicating the range of prices at which sellers are actively entering the market.
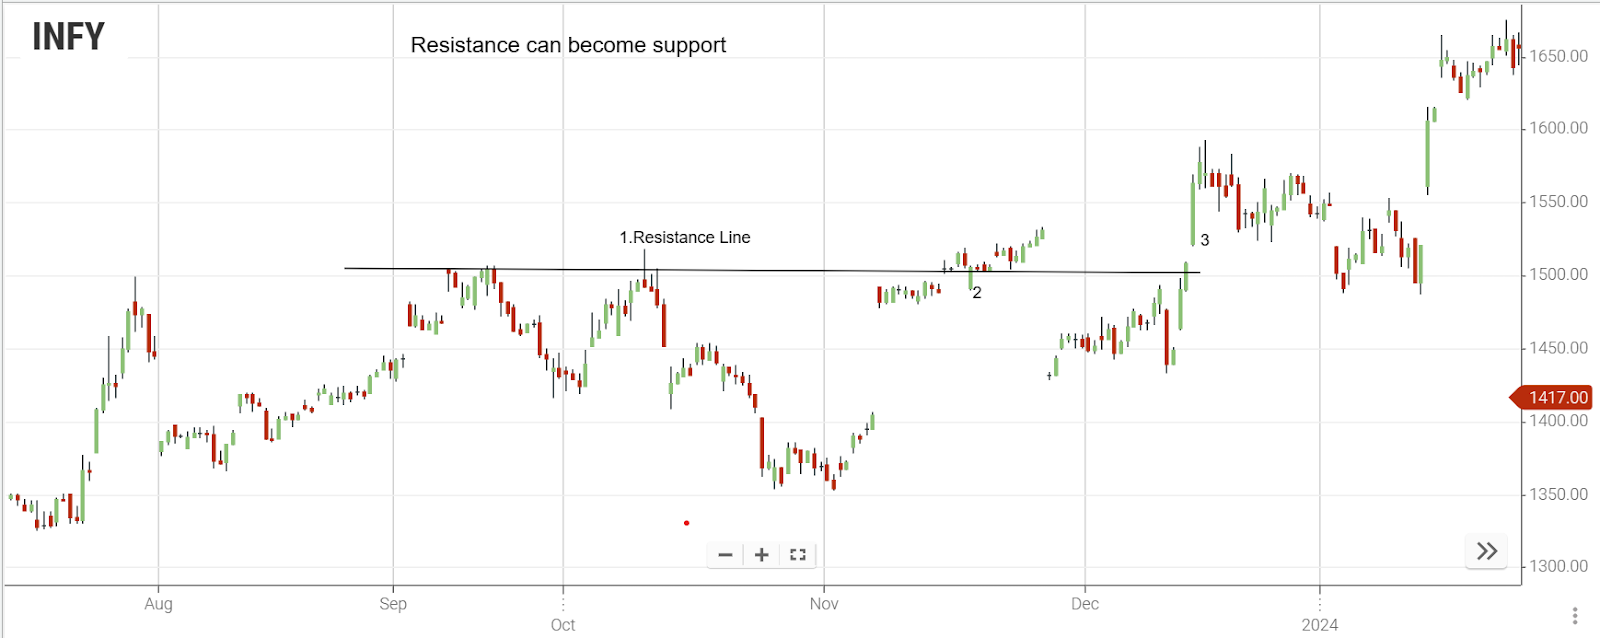
Resistance can become support
Price breaches a support or resistance level when one side prevails over the other. Following breakthrough support or resistance, it's not uncommon for the price to revisit the breakout level before resuming its movement. In such instances, the former support may act as resistance, or the previous resistance may turn into support.
In the example from the chart below, the price successfully broke through a resistance level, signifying the buyers' dominance over the sellers at that particular price point.
-
Price encounters resistance.
-
Price breaches the resistance.
-
The price retraces to the former resistance level, now functioning as support.
Those who sold when the price hit the resistance level would be losing money as the price kept going up. When the price returns to the old resistance level, traders who bet on the price going down will give up and buy, adding more buying power.
New traders who haven't joined the market yet might also start buying at this price, expecting the price to go up. This additional buying pressure causes the price to keep rising. The old resistance level now acts like a support level, holding the price from falling back down.
Note: Closing a Position: To end a long position, you sell your asset to the market.To end a short position, you purchase the asset.
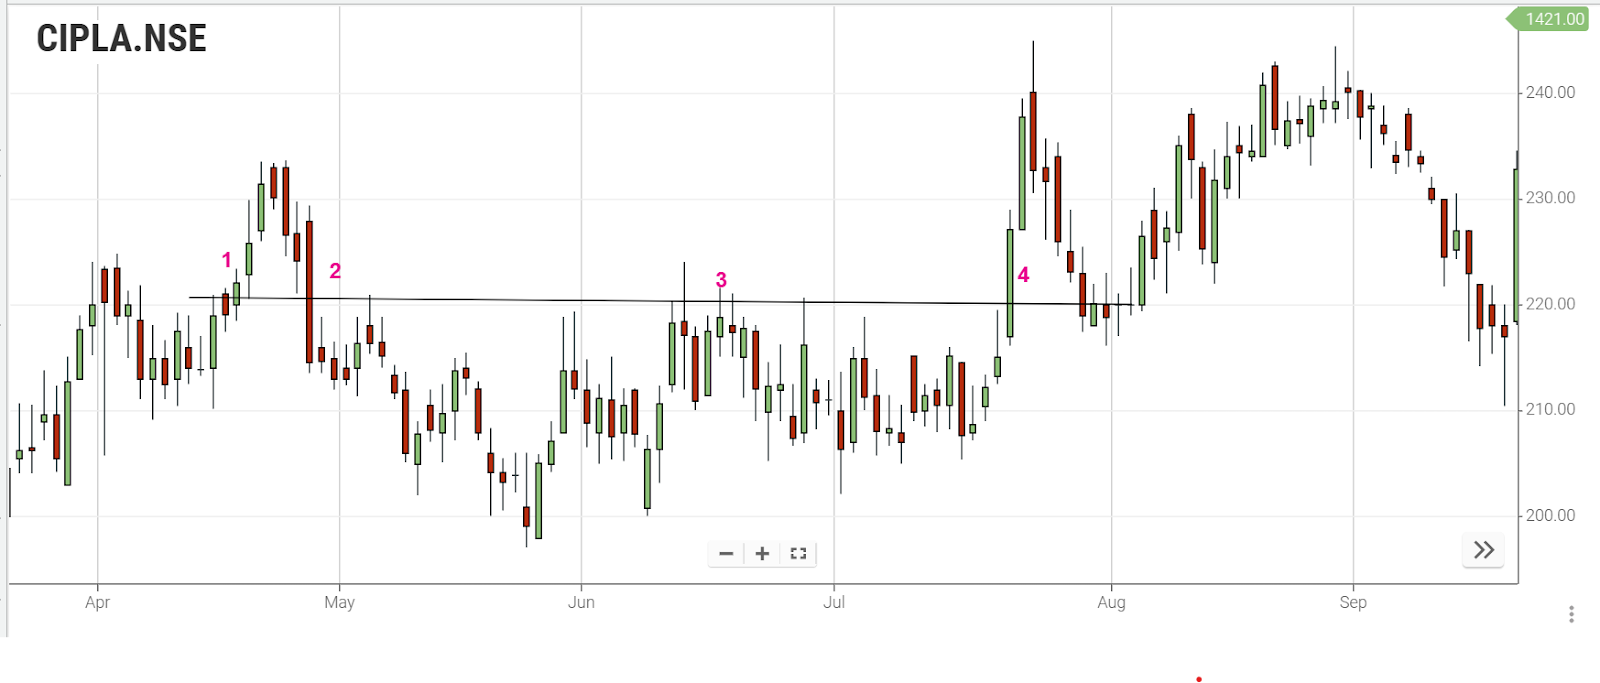
Support can become resistance
Likewise, if the price surpasses a support level and later returns to that level, sellers may enter the market, causing the price to decline further. The chart below provides additional instances of support transforming into resistance and resistance transforming into support. In this example, the same price level serves as both support and resistance on multiple occasions.
-
Price discovers support.
-
Price breaches the support.
-
The price retraces to the prior support, now acting as resistance.
-
Price surpasses the resistance and subsequently finds support again.
Nutshell:
-
Resistance Level: Sellers at this level prevent the price from rising, causing a reversal to the downside.
-
Identify Support and Resistance: Use horizontal lines on the chart where the price frequently halts to determine support and resistance levels.
-
Drawing Lines: Use candlestick wicks or bodies to draw support and resistance lines when the approach is stable.
-
Interchangeable Roles: Support can turn into resistance, and resistance can transform into support.
-
Beware of False Breakouts: Exercise caution to avoid being misled by false breakout signals.
-
Reversals: The price might feign breaking through support or resistance but ultimately reverse in the opposite direction.
Frequently Asked Questions:
-
How do I identify support and resistance levels on a price chart?
To pinpoint support and resistance, examine areas where the market consistently halts or changes direction. These are zones where buyers or sellers actively participate.
-
Can you explain the concept of support and resistance in a sideways market?
In a sideways market, prices repeatedly touch the same support and resistance levels before breaking out. Support acts as a lower boundary, and resistance acts as an upper limit.
-
How do I establish support and resistance using candle wicks and bodies?
Consider both the wicks and bodies of candles to set support or resistance lines. There's no universal method; it depends on trader preference or strategy.
-
What is the significance of support and resistance zones?
Support and resistance levels aren't always determined by a single line. Defining a zone is often more effective, considering the price faces resistance at various levels.
-
Can you explain why support can become resistance and vice versa?
When a price breaks through a support or resistance level, it may come back to that level before continuing. In such cases, the former support may act as resistance, and vice versa, based on market dynamics.