Knowledge Center Technical Analysis
Trend Analysis
Trading Support and Resistance Levels
For newcomers in the share trading arena aiming to stabilize their positions, understanding two fundamental concepts is crucial: support and resistance.
Beyond the basics for beginners, these concepts bring complexities that assist traders in planning their entry and exit strategies when a specific stock approaches support or resistance levels.
These support and resistance levels are fundamental trading tips recognized by seasoned investors, aiding in strategic decision-making regarding entry and exit points.
Understanding Support Levels:
Support, also known as a support level, represents a price point at which investors plan their entry into the stock market. It is a level below which the stock is unlikely to drop, based on the historical performance of the specific stock. This situation leads to two outcomes: confirmation, where investors choose the stock, expecting it to rise, and abolition, which occurs when the price exceeds the support level, prompting the market to seek a new equilibrium.
Understanding Resistance Levels:
Conversely, a resistance level is the opposite of a support level and is primarily associated with selling activities. It is the point where buyers meet sellers, occurring at the ceiling rather than the floor. Two scenarios unfold: if more sellers increase volume, the price is likely to drop off the ceiling, signifying the resistance level. Alternatively, increased buyer volumes can cause a significant drop in the resistance level, propelling share prices above the ceiling. This shift is positive, indicating that the resistance level may become a new support level for the stock.
Reading Support and Resistance Levels on a Chart:
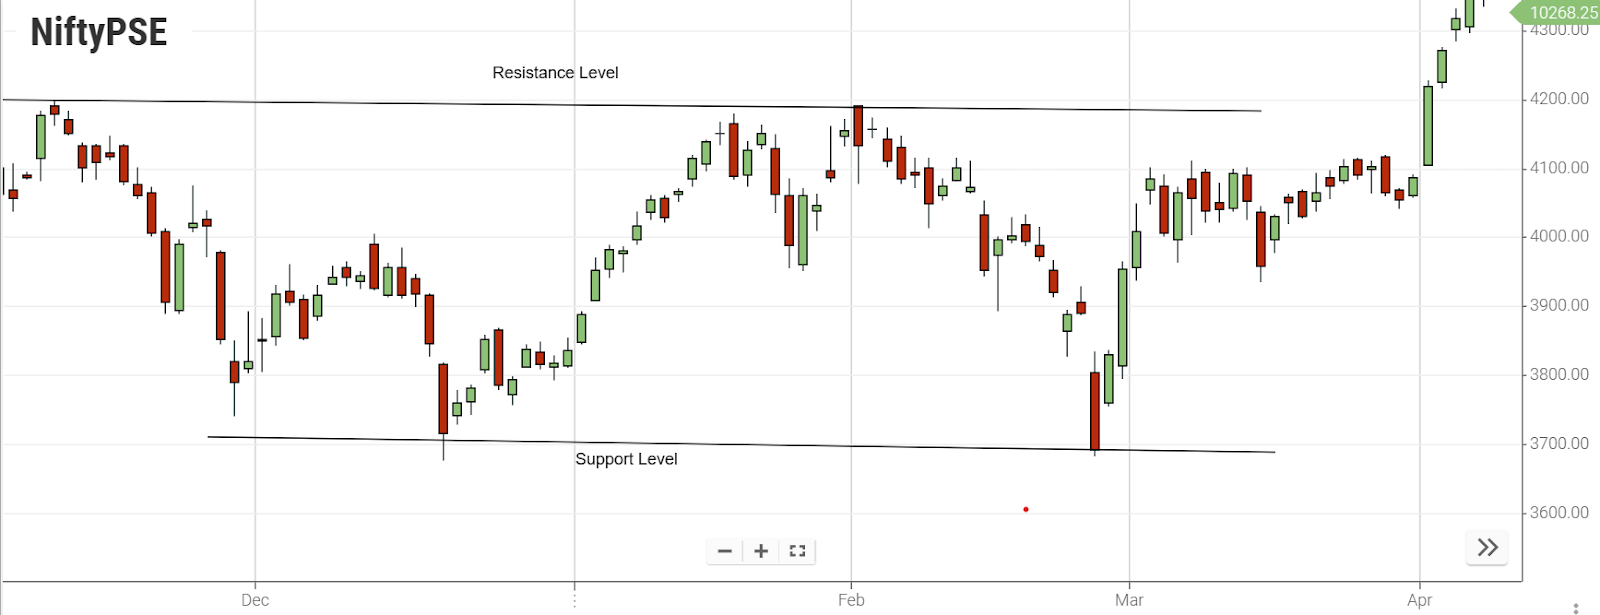
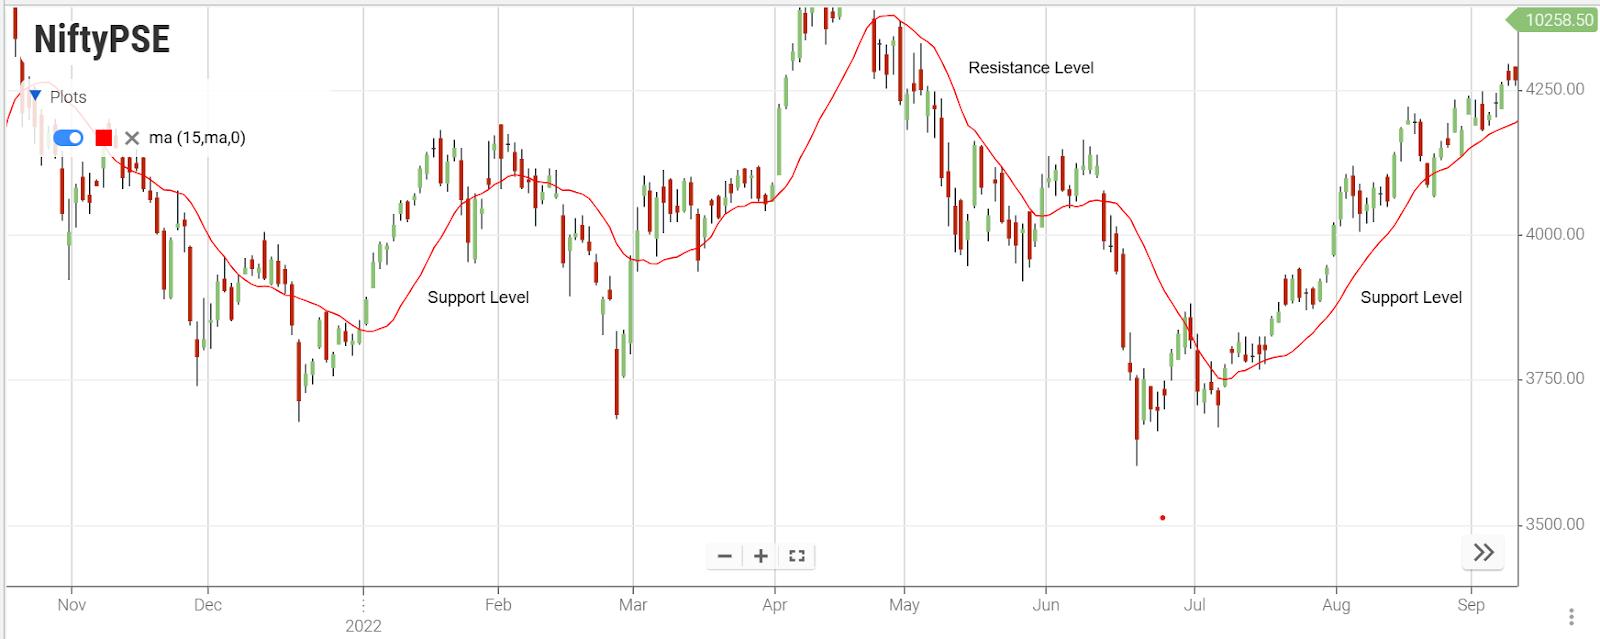
Discovering support and resistance zones on a price chart is simpler than it may seem. Traders just need to concentrate on significant price turning points within a given time frame. Usually, a turning point where prices rapidly decline can be labeled as a resistance zone. Conversely, a turning point where prices rebound higher can be identified as a support zone.
Upon identifying these critical price turning points, extend a horizontal line to the right. Prices often exhibit a memory, frequently reversing direction from levels they have acknowledged in the past.

Advantages of Support and Resistance:
Support and resistance present a multitude of benefits for traders and investors. Initially, support levels serve as a solid foundation or a lower threshold for an asset's price, signifying a point where demand holds strong enough to halt further price declines. By pinpointing and monitoring these support levels meticulously, traders can make judicious choices regarding their market entries and exits, thereby minimizing potential losses and maximizing gains. Conversely, resistance levels function as a barrier or an upper limit, indicating a point where supply is robust enough to impede further price ascents.
Understanding and keeping tabs on these resistance levels can assist traders in gauging opportune moments to sell or secure profits. Moreover, support and resistance levels double as psychological benchmarks, prompting many market participants to initiate buy or sell orders around these pivotal points. Consequently, this activity tends to enhance trading volume and liquidity, fostering more precise price movements and refined trade execution strategies. Overall, proficiency in utilizing support and resistance analysis equips traders with a valuable toolset for navigating market trends and fortifying their trading methodologies.
Disadvantages of Support and Resistance:
Despite their utility, support and resistance levels come with inherent drawbacks. One limitation lies in their subjectivity and susceptibility to varying interpretations among traders, leading to inconsistencies in analysis. Furthermore, support and resistance levels do not offer foolproof indications. They rely on historical price data and assume that market behavior will remain consistent in the future. However, market dynamics are prone to change, rendering these levels unreliable.
Additionally, support and resistance levels can sometimes trigger self-fulfilling prophecies, as numerous traders converge to buy or sell at these junctures, resulting in crowded trades and potential price manipulation. Lastly, support and resistance levels may prove ineffective in choppy or highly volatile markets characterized by unpredictable and frequent price swings. Hence, it becomes imperative for traders to incorporate supplementary indicators and analysis methodologies to complement support and resistance levels, facilitating more informed trading decisions.
Nutshell:
-
Support and resistance are depicted as areas on your chart, not just lines.
-
The more support and resistance levels are tested, the stronger they become.
-
Trading at support and resistance can offer more favorable risk-to-reward conditions.
-
When prices break past a support level, they often transform into a new resistance level.
-
Conversely, if prices break out above a resistance level, that level could serve as support in the future.
Frequently Asked Questions
-
What are the support and resistance levels in commodity trading?
Support and resistance levels in commodity trading are horizontal price points on a chart that connect lows to lows and highs to highs. These levels help traders anticipate potential market movements.
-
How can I trade support and resistance levels effectively?
Effective trading at support and resistance levels involves identifying significant turning points on a chart. By marking these key levels and understanding their historical significance, traders can plan entry and exit strategies.
-
What is the significance of support levels in the stock market?
Support levels in the stock market represent price points where investors plan their entry. It's a level below which stocks are less likely to drop, leading to confirmation or abolition scenarios based on market reactions.
-
How do I read support and resistance levels on a chart?
Reading support and resistance levels on a chart involves focusing on turning points where prices decline or rebound. By extending a horizontal line from these critical points, traders can anticipate potential market reversals.
-
Why is it important to set stop-loss based on support and resistance levels?
Setting stop-loss based on support and resistance levels is crucial, as these levels often act as barriers preventing further market movement. Placing stop-loss orders beyond these areas helps manage risk and avoid potential losses.

