Knowledge Center Technical Analysis
Trend Analysis
Sell On-Resistance Area
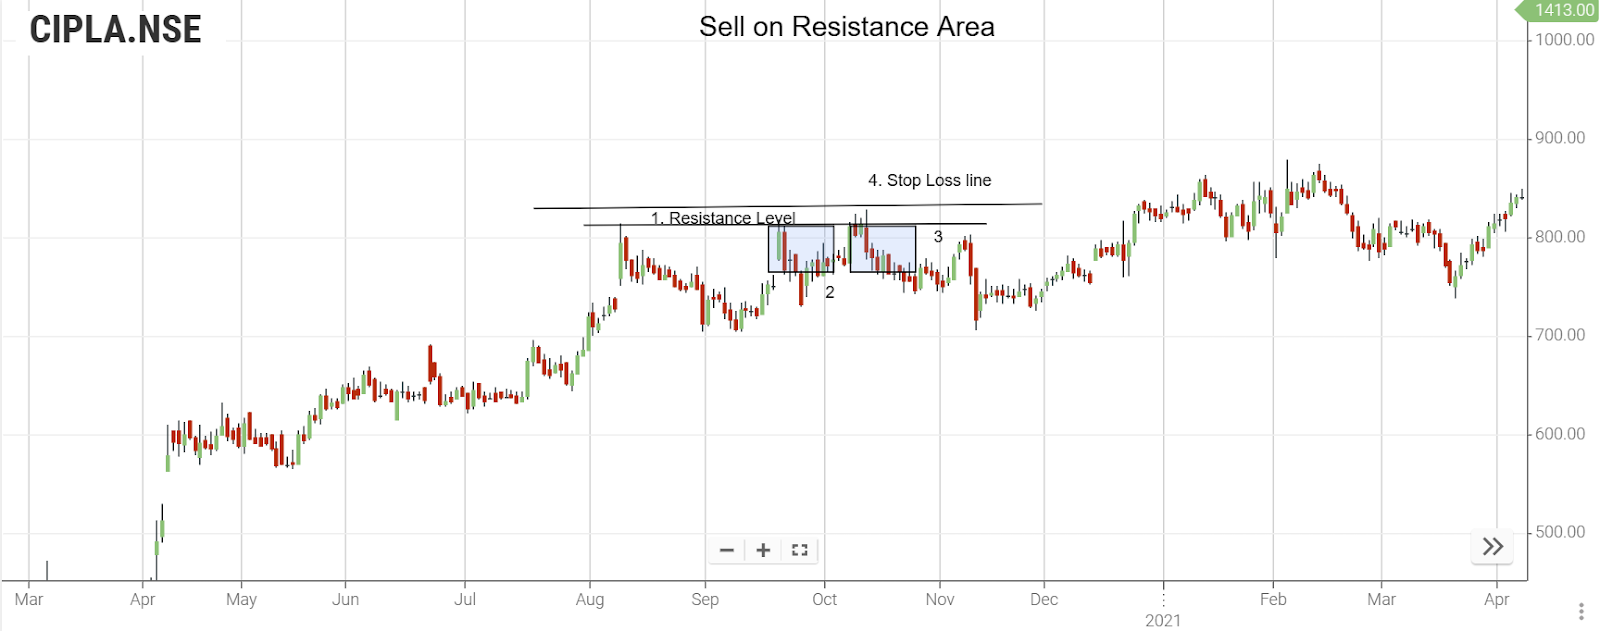
Resistance levels serve as potential entry points for initiating new short positions. In the provided chart, a distinct resistance level is identified, indicating a likelihood of price decline upon reaching this level. A strategic approach involves entering a new short position at this specific price with a recommended stop loss set beyond the identified resistance level.

No.1: Resistance Level
No. 2: Price encounters resistance at this level
No. 3: Initiate a short entry after the price level effectively holds as resistance
No. 4: Place the stop loss above the resistance level.
False breakouts
The chart below illustrates a situation where the price seemed to breach a resistance level but failed to sustain above it—commonly referred to as a false breakout.
-
Price encounters resistance.
-
Price broke through the resistance level but failed to sustain above it.
If a trader aims to initiate a long position after a resistance level break, it's prudent to wait until the established resistance turns into support to avoid falling for a false breakout.
Likewise, for entering short trades after a support level breach, it's wise to wait until the support transforms into resistance to steer clear of false breakouts.
Considerations when using support and resistance:
Support and resistance levels are subjective, varying among traders.
Identification of key support and resistance levels improves with experience, preventing the tendency to identify too many potential reversal points in the price.
Nutshell:
-
Support is a price level where sufficient buyers halt further price declines and cause an upward reversal.
-
Resistance is a price level where ample sellers prevent further price increases and lead to a downward reversal.
-
Support and resistance levels are identifiable by placing horizontal lines on a chart where the price consistently stops.
-
Use either the wicks or bodies of candlesticks to draw support and resistance, maintaining consistency in your approach.
-
Support can transform into resistance, and vice versa.
-
Exercise caution with false breakouts, where the price appears to breach support or resistance but reverses in the opposite direction.
Frequently Asked Questions
-
How can one purchase at support and sell at resistance?
The strategy involves buying when prices are at support levels and selling when prices are at resistance levels. Note that these levels are zones, not exact points.
-
How do you trade at support?
The basic strategy is to buy at the support level and sell at the resistance level, recognizing that these are zones of potential demand and supply changes.
-
How does resistance work?
Resistance in the share market indicates how easily current flows in a circuit, measured in ohms (Ω). Current increases with decreased resistance and decreases with increased resistance, which is crucial for maintaining proper current flow.
-
What is the professional support and resistance trading strategy?
These indicators identify predetermined levels where market prices are expected to stop and reverse. This technical analysis helps analyze price charts and determine market direction and entry points.
-
How do you calculate resistance levels?
Use pivot points (PP):
The formula for calculating the first resistance level (R1) is (2 times the pivot point) minus the low.
Second resistance (R2) = PP + (High – Low)
Third resistance (R3) = High + 2 (PP- Low)
