Knowledge Center Technical Analysis
Trend Analysis
How to Draw Trendline
What is a Trendline?
A trendline is a graphical representation in a chart or graph that shows the general direction and momentum of a data series. Typically, Trendlines in technical analysis are used for financial markets or other forms of data analysis.
Use of Trendline
Trendlines are used to identify and illustrate the prevailing trend or pattern in the data, making it easier to make predictions or decisions based on historical price movements or other variables.
How to Draw Trend lines?
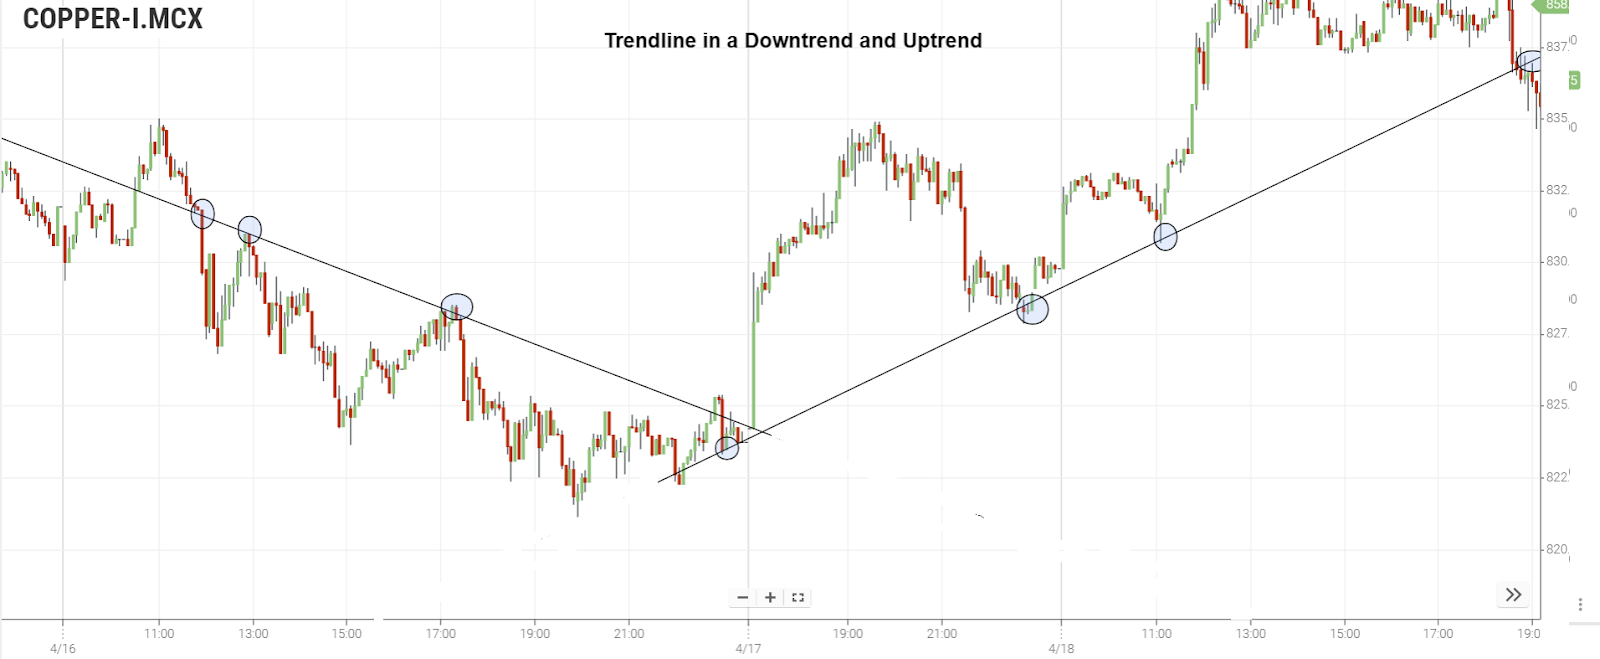
In a price chart for a financial instrument, such as a stock, currency pair, or commodity, a trendline is drawn by connecting two or more significant points, such as lows or highs, on the chart. There are two primary types of trendlines:
1. Uptrend Line or Support Trendline: A line drawn below the price data connecting a series of higher lows. It represents an upward or bullish trend in which the asset's price is generally rising.
2. Downtrend Line or Resistance Trendline: A line drawn above the price data connecting a series of lower highs. It represents a downward or bearish trend in which the asset's price is generally falling.
Trendlines help traders and analysts identify support and resistance levels, as well as potential entry and exit points for trades. They provide a visual guide to the direction and strength of the market trend and are a fundamental tool for technical analysis.
How To Draw Trendline in Chart?
A trendline takes shape when you can connect at least two or more price swing points or pivot points with a diagonal line. It's often referred to as a sloping line, and it's created on a chart by linking two or more data points. Generally, trendlines drawing will have three points. They are
-
Starting Point:
This is the initial point from which the line originates and serves as the starting point. When it comes to creating trend lines, it's essential to understand that you require a minimum of two market points to initiate a trend line.
-
Validation Point:
This is the second point, or point 2, which validates the straight line when connected to point 1. After identifying the second swing high or low, you can establish a connecting trend line.
-
Confirmation Point:
The third point is of significant importance as it provides validation to the trendline. While it's possible to establish a trendline with just two points, the third point serves to confirm its validity. It's essential to remember that any pair of reference points can create a trendline, but it's the presence of the third touch point that solidifies the slope's reliability. Therefore, before placing substantial reliance on a specific gradient, it's advisable to seek that third touch point for increased confidence.
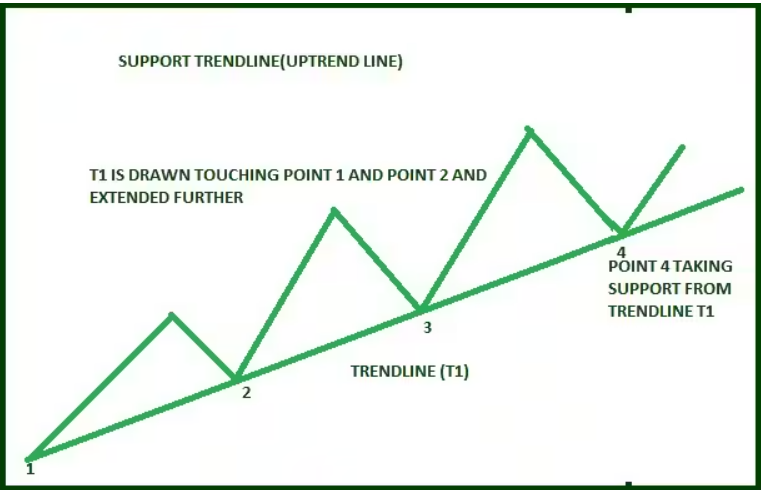
The diagram above illustrates a support trendline and how point 3 has confirmed the trendline drawn from points 1 and 2. It also demonstrates how point 4 found support at the trendline. Interestingly, point 4 presented a favourable buying opportunity, highlighting how trendlines offer support, and prices tend to rebound upon reaching them.
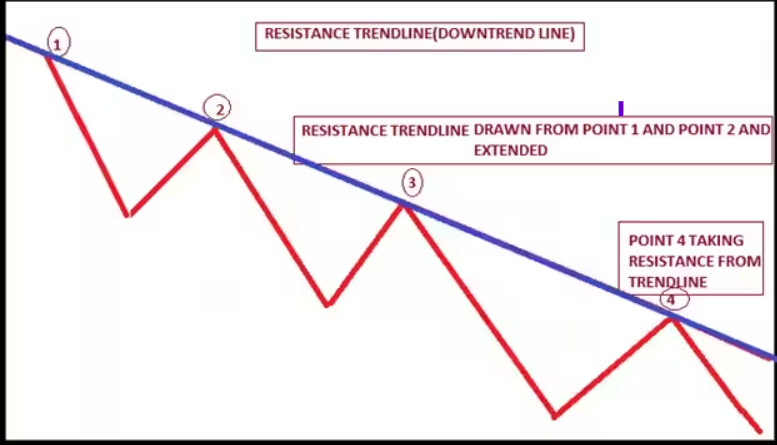
As previously mentioned, a resistance trendline can be drawn in a similar manner. However, it's worth noting that prices often encounter resistance at points 3 and 4 and subsequently trend lower. In the provided chart, a blue trendline is drawn by connecting point 1 and point 2. Notably, points 3 and 4 have encountered resistance at this blue trendline, presenting a selling opportunity.
Key Considerations for Trendlines
Here are some essential considerations when studying trendlines:
1. Bullish and Bearish Trends: A trendline above the price action signifies a bullish trend, while a downward-sloping line acts as resistance, indicating a bearish trend.
2. Higher Time Frame Dominance: The trend of a higher time frame takes precedence over that of a lower time frame. Trendline trading strategy of trading in the direction of the higher time frame trend is often more profitable.
3. Maximizing Touch Points: When drawing trendlines, aim to capture as many touch points as possible without intersecting candle bodies, even if there's some overlap from the candle's high or low.
4. Line Chart Effectiveness: Trendlines drawn using closing prices on a long-term chart are particularly effective. They are useful for trendline analysis on breakout and can be applied to various chart types.
5. Acceleration After a Break: When a trendline is broken as either support or resistance, the subsequent price movement should exhibit acceleration in the direction of the breakout. A lack of such acceleration can indicate a potential false breakout.
6. Flipping Dynamics: Once a trendline is breached, the role of support becomes resistance, and resistance turns into support in the price action.
How To Draw Trend Line in Candlestick Chart?
Locate the trendlines. Demonstration:
-
In an uptrend, the trendline is drawn beneath the price.
-
The trendline includes the highs during a downtrend and the lows during an uptrend.
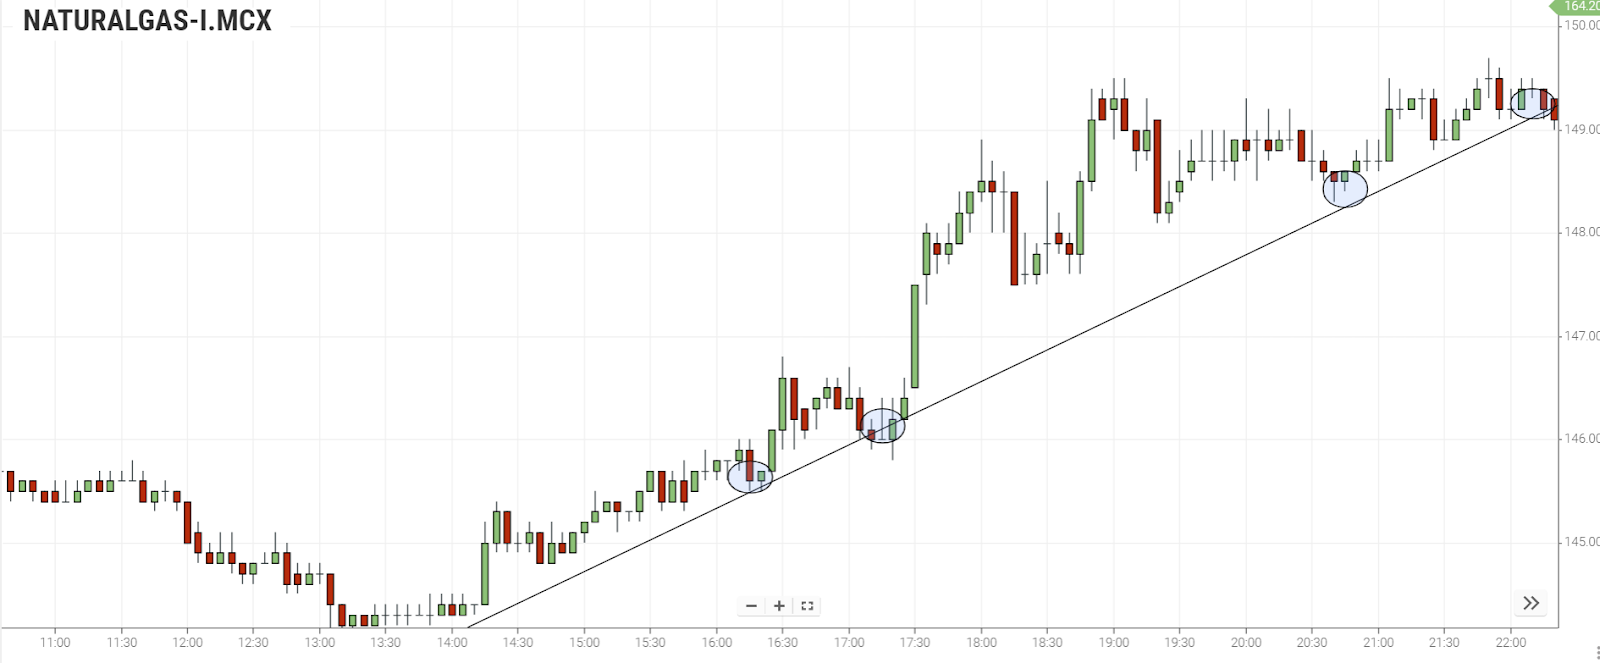
The chart above is an illustration that depicts how to draw a trend line using the bodies of the candles.
-
To create a trendline, you need at least two swing highs or swing lows.
-
The credibility of a trendline is established when a minimum of three highs or lows are employed.
-
The higher the number of times the price interacts with a trendline, the stronger its validity, as it garners more attention as a support or resistance level.
-
When sketching a trendline, many traders opt for wicks, while some favour the candlestick bodies, both of which are acceptable methods.
Summary
A summary of the lesson covered thus far:
-
Trend lines, drawn either above or below the price, serve as indicators of the prevailing trend and the points at which a trend shift may occur. Additionally, they function as valuable support and resistance levels, facilitating position entry and exit.
-
In an uptrend, trend lines are positioned below the price, whereas in a downtrend, they are located above it. For an uptrend, a straight-line links two lows, while in a downtrend, it connects two highs. To validate a trend line, it must connect with a minimum of three highs or lows.
-
The degree of validation of a trend line increases as the price interacts with it more frequently.
-
A trading technique involves monitoring a trend line break, wherein the price breaches the trend line.
Frequently Asked Questions
How to draw trend lines correctly?
1. Identify at least two significant swing highs or lows in the price chart.
2. Draw a straight line connecting these points for an uptrend or downtrend.
3. To increase validity, aim for a minimum of three touches along the trendline, and consider using wicks or candlestick bodies when drawing.
How to draw trend lines in forex?
To draw trendlines in forex:
1. Identify at least two prominent swing highs or lows on the forex price chart.
2. Connect these points with a straight line for either an uptrend or a downtrend.
3. Seek confirmation by looking for at least three touches along the trendline, and consider drawing the trendline through wicks or candlestick bodies for accuracy.
How to draw trendlines on stock charts?
1. Locate two or more significant swing highs or lows on the stock chart.
2. Draw a straight line connecting these points, positioning it below the price for an uptrend and above for a downtrend.
3. Verify the trendline's validity with at least three touches along it, whether as support or resistance.
How to draw trend lines for intraday?
1. Identify key intraday swing highs and lows on your chart.
2. Connect these points with a straight line, keeping it below the price for uptrends and above for downtrends.
3. Ensure trendline validation by observing at least three price touches for support or resistance during the intraday trading session.
When do we always draw trend lines above the candles?
1. Draw trendlines above the candles when identifying a downtrend.
2. Locate two or more significant swing highs in the price chart.
3. Connect these points with a straight line, placing it above the price to delineate the trend's resistance.