Knowledge Center Technical Analysis
Trend Analysis
Support Become Resistance
When Support Becomes Resistance?
A fascinating aspect of support and resistance is observed when the underlying asset's price successfully breaks through an identified level. It's not unusual for a former support or resistance level to undergo a transformation.
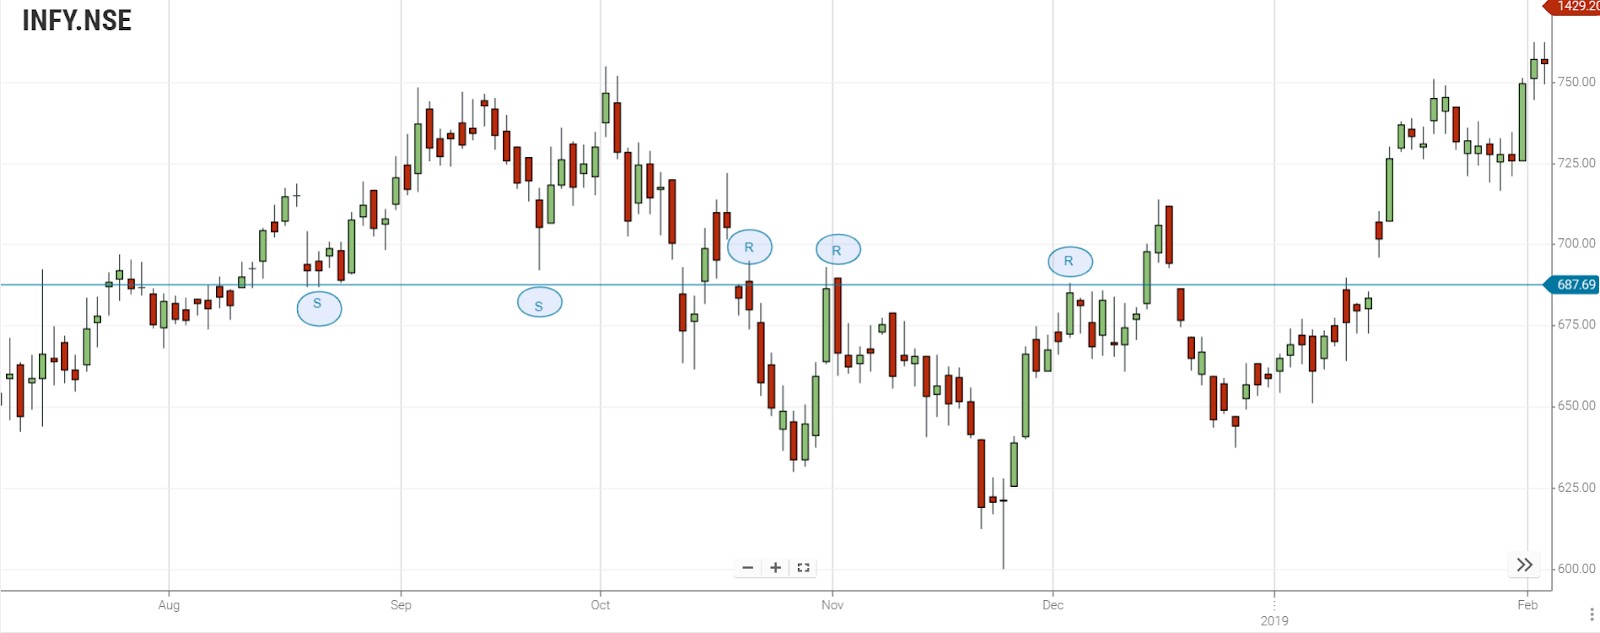
In the chart depicted above, the dotted line initially represents the support level at S. However, once the price falls below this level (as shown as R), the once-supportive line often transitions into a new, short-term resistance area.
Why Does Support Become Resistance?
Support becoming resistance is a common occurrence in the stock market due to shifts in investor sentiment. When a price level that previously acted as a support (where buying interest was observed) is breached, it can flip roles and become a resistance level. This happens because investors who bought at the support level and expected the price to rise may now become sellers, trying to break even as the price approaches their original entry point. The psychological shift from viewing a level as a support to now seeing it as a potential resistance reflects changing perceptions and market dynamics.
Practice Session:
Identify accurately drawn support levels. Demonstrate the concept of support and resistance within a range. In a market characterized by consolidation, the price repeatedly encounters the same support and resistance levels before eventually breaking out of the range.

1 – Support Level
2 – Prices breaks through support level
3 – Support turns into resistance points.
The above illustration depicts a distinct upper limit provided by the resistance level and a well-defined lower limit by the support level within the range. A breakout ensues when sellers exert dominance, breaching the established support level.
Example
In the below chart, when the support level is broken, sellers enter the market, causing the price to persistently decline upon returning to this level. The illustration below illustrates the transformation of support into resistance .The specific price level in this depiction functions as both support and resistance on multiple occasions.
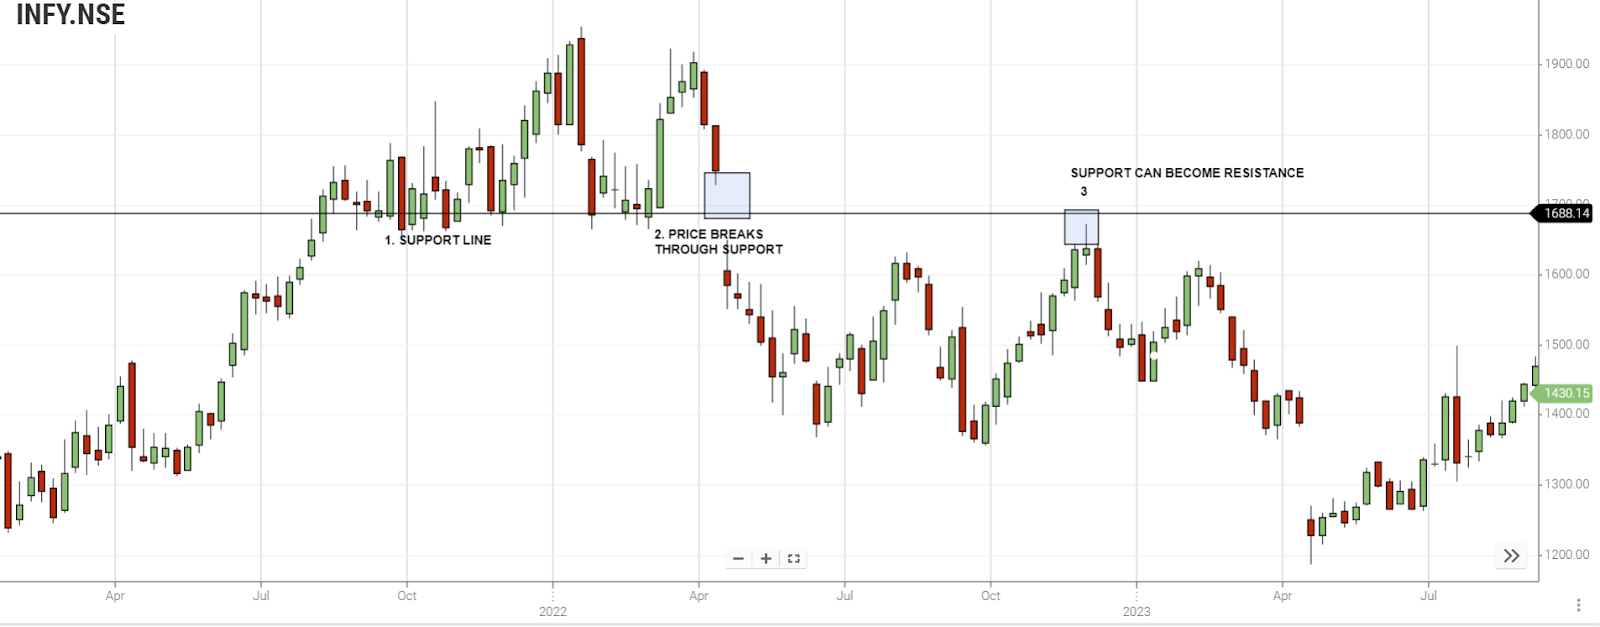
In the above chart, when the price has been decreasing to break the support level.Now the support line breakout happens and changes the support line into a new resistance line.At the price 1688.14 the price breaks the support level marked as ‘Support Range break out’ and thus the support becomes resistance.
Summary
-
Support levels feature sufficient buyers to prevent further price decline and initiate an upward reversal.
-
Resistance levels involve ample sellers to hinder further price ascent and prompt a downward reversal.
-
Identify support and resistance levels by placing horizontal lines on the chart where the price frequently halts.
-
When employing a reliable approach, use candlestick wicks or bodies to establish support and resistance.
-
Note that support can transform into resistance, and vice versa.
-
Exercise caution to avoid false breakouts where the price feigns breaking through support or resistance but subsequently reverses direction.
Frequently Asked Questions
When Resistance Becomes Support?
When resistance becomes support, it signifies a notable shift in market dynamics. Former resistance levels, once surpassed, transform into new support levels. This reversal indicates a positive change in investor sentiment, as the price, which previously faced selling pressure, is now viewed as a level where buyers are likely to step in. This phenomenon is often interpreted as a bullish signal, suggesting potential upward momentum in the security's price. Traders closely monitor these transitions as they provide insights into evolving market trends and opportunities for strategic entry points.
What Is Support Resistance in Stock Market?
Support and resistance are key concepts in the stock market, representing levels where the price tends to stop or reverse its direction. Support is a level where buying interest is significant, preventing the price from falling further. Resistance is a level where selling interest is notable, impeding the price from rising further.
How To Draw Support and Resistance for Intraday?
For intraday:
-
Identify key price levels and pivot points.
-
Focus on round numbers and psychological levels.
-
Draw trendlines connecting highs and lows.
-
Watch volume profiles for significant trading activity.
-
Use dynamic indicators like moving averages.
-
Stay adaptable, adjusting levels based on real-time price action. Visit Enrich Money to stay updated with real-time price levels.
How To Find Support and Resistance Levels in Bank Nifty?
Find Bank Nifty support and resistance:
-
Use prior highs and lows.
-
Calculate pivot points.
-
Consider round numbers.
-
Draw trendlines for trend analysis.
-
Analyze volume profiles.
-
Utilize moving averages.
-
Apply Fibonacci retracements.
-
Note price gaps.
-
Review option chain data.
-
Monitor intraday price action for adjustments.
Access comprehensive research on Bank Nifty through Enrich Money.
How To Trade Support and Resistance Breakout?
Trade support/resistance breakout:
-
Identify key levels.
-
Wait for a confirmed breakout.
-
Confirm with increased volume.
-
Set stop-loss for risk management.
-
Establish profit targets.
-
Use indicators for confirmation.
-
Trade in line with the trend.
-
Monitor price action for reversals.
-
Stay informed about relevant news from Enrich Money.
-
Review and learn from each trade.