Knowledge Center Technical Analysis
Trend Analysis
Resistance Analysis
What is Resistance in Trading?
Resistance in trading refers to a price level at which a stock or other financial asset struggles to break above, often seen as a ceiling preventing further price increases. Traders often use resistance levels to make decisions about buying or selling, as breaking through resistance can indicate a potential upward trend, while failure to break through can suggest a reversal or continuation of a downward trend.
What is the Resistance Level?
The significant prices at which buyers have already entered the market in adequate quantity, and they pause to reverse the price movement.
The traders use these price levels to analyze the likely entry of buyers again into the market.
Example
Consider a scenario where you hold a long position in shares of company ABC, presently priced at Rs. 100. The prevailing upward momentum encounters resistance at Rs. 110. Consequently, you've determined to seize profits when the market reaches Rs. 110 in the next uptick.
As the market indeed ascends, you close your position, prompting many other market participants to also sell their shares, leading to a downturn. This sell-off indicates that the asset has confronted a resistance level at Rs. 110 and is poised to retreat once more.
Should the market successfully breach this resistance, it would likely experience a rally fuelled by heightened market confidence, establishing Rs. 110 as the new support level where buyers enter the market.
Analysis of Resistance Levels
This can be analyzed on price charts with horizontal lines where there is a pause in price at the same level again and again.
When the price moves higher, it will undoubtedly hit the ceiling. This is the point at which the price pauses and reverses.
How To Plot Resistance Level and Support Level for Any Given Security?
Many traders utilize charting software available on platforms like Enrich Money or in apps like Orca App to pinpoint support and resistance levels. The steps employed in plotting the support and resistance levels are Choose the security for analysis, such as a stock, index, or currency pair.
-
Select the desired time frame for analysis, whether daily, weekly, or monthly.
-
Plot the price data of the security on a chart with the chosen time frame, using charting software or an online platform.
-
Identify areas on the chart where the price has consistently bounced off a specific level (support) or struggled to break through a certain level (resistance). Use horizontal lines on the chart to mark these levels.
-
Verify these levels by examining trading volume and price action around them. High trading volume and price reversals suggest strong support or resistance.
-
Utilize the identified support and resistance levels to inform trading decisions, such as buying at a strong support level or selling at a strong resistance level.
Illustration
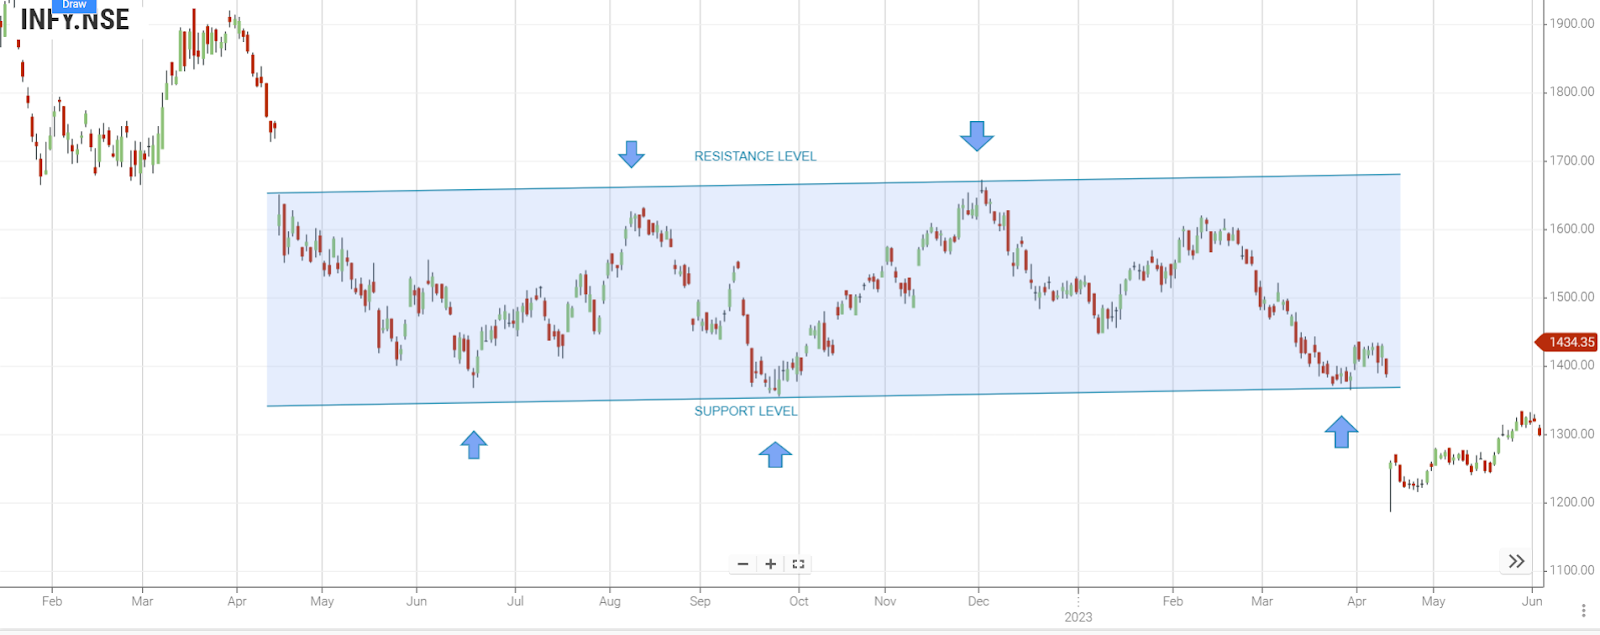
Consider the resistance chart below, where it is observed that the price repeatedly pauses in the same place. The buyers enter the market in this place. It shows that placing a horizontal line where the price seems to pause assists us in finding a resistance level where sellers are entering the market and stopping the price.
The above chart demonstrates the utilization of candle bodies to establish the resistance line. Placing support and resistance does not adhere to a fixed method. Traders need to adopt a suitable plan and strategy for effective implementation.
Support and resistance levels should not be determined with a single line; establishing a zone is more effective.
Practical Session
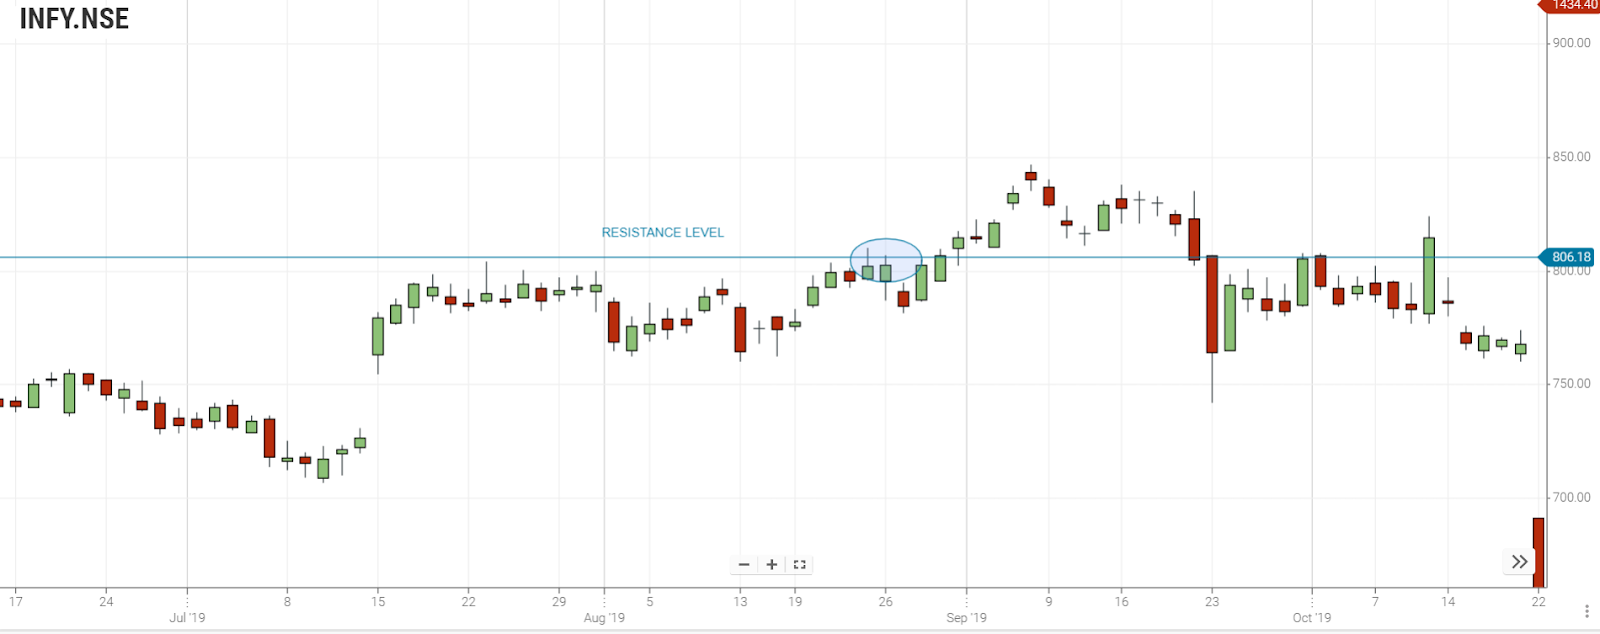
We need to observe where the price repeatedly pauses in the same place. The buyers enter the market in this place.
The illustration below shows that placing a horizontal line where the price seems to pause assists us in finding a resistance level where sellers are entering the market and stopping the price.

The chart above illustrates using the bodies of the candles for the resistance line.
There is no definite method for placing support and resistance. A suitable plan and strategy have to be adopted by the trader.
Support and resistance levels cannot be settled correctly with a single line. It is better to establish a zone.
Which indicators or strategies incorporate the use of level of support and resistance?
Support and resistance levels find applications in various indicators and strategies within technical analysis. Here are a few examples:
-
Trend Lines: Trend lines are drawn to ascertain the trend direction in a security. Connecting a series of higher lows forms a support level, while connecting lower highs creates a resistance level.
-
Moving Averages: Moving averages smooth out price data to identify the overall trend. When the price is above the moving average, it acts as a support level; when below, it acts as a resistance level.
-
Breakout Strategies: Breakout strategies aim to capitalize on price movements post a security breaking through a key support or resistance level. Traders often wait for high trading volume before entering a trade in the breakout direction.
-
Pivot Points: Pivot points consist of horizontal support and resistance levels calculated based on the previous day’s price action. Traders commonly use these levels to pinpoint potential entry and exit points for their trades.
How To Avoid False Breakouts?
Long trade: Once the price has broken through a resistance level, wait until the previously established resistance level is shown to hold as support.
Short trade: Once the support level has broken, wait until the support has held as resistance.
Conclusion
At the support level, there are adequate buyers to stop the price from falling further and reverse the cost to the upside.
At the resistance level, there are adequate sellers to stop the price from rising further and reverse the cost to the downside.
Place horizontal lines on a chart where the price seems to stop repeatedly to find the support and resistance levels.
When our approach is stable, we can use the wicks or the bodies of the candlesticks to draw support and resistance.
Support can become resistance, and resistance can become support.
We need to be careful to avoid false breakouts.
The price may pretend to break through support or resistance but will reverse in the opposite direction.
Frequently Asked Questions
How is resistance identified on a price chart?
Resistance is identified on a price chart by observing points where the price has repeatedly faced selling pressure and struggled to move higher. These points are marked as resistance levels.
How can traders use resistance levels in their strategies?
Traders use resistance levels to set profit targets, place stop-loss orders, and make decisions on entering or exiting positions. Breakouts above resistance levels can trigger buying opportunities.
What factors contribute to the creation of resistance levels?
Resistance levels are created by an influx of selling orders, profit-taking by traders, or a general consensus that the current price is too high.
How does volume relate to resistance analysis?
High trading volume around a resistance level often strengthens its significance. Increased volume during a failed attempt to break resistance or a successful breakout adds credibility to the analysis.
Can resistance analysis be applied to different timeframes?
Yes, resistance analysis can be applied to various timeframes, such as daily, weekly, or monthly charts, depending on the trader's preferences and the nature of the market.
How does news and external events impact resistance levels?
News and external events can influence resistance levels, especially if they trigger a significant change in market sentiment. Positive news may lead to attempts to break resistance, while negative news may reinforce resistance.