Knowledge Center Technical Analysis
Trend Analysis
How Do We Trade With Fibonacci Levels?
Using Fibonacci levels in trading is like having a special tool. It helps traders figure out how prices might change. Traders use this tool to draw lines on a price chart. These lines are called "Fibonacci levels." They work just like regular support and resistance lines, guiding traders on when to buy or sell.
Set Up of Fibonacci Retracement Levels In Meta Trader 4 (Or) Ami Broker Chart
|
Fibonacci levels help identify support and resistance on your price chart. |
The Fibonacci tool is used to measure a price move. When the price goes up or down, you can easily see where it started and ended. With the Fibonacci tool, you calculate this distance, and it automatically shows Fibonacci retracement and extension levels on the chart. These levels act like support and resistance points. The calculations are based on the Fibonacci sequence, but in this lesson, we'll focus on how to use the tool, not the math behind it.
Linking Moves A to B Using the Fibonacci Retracement Tool
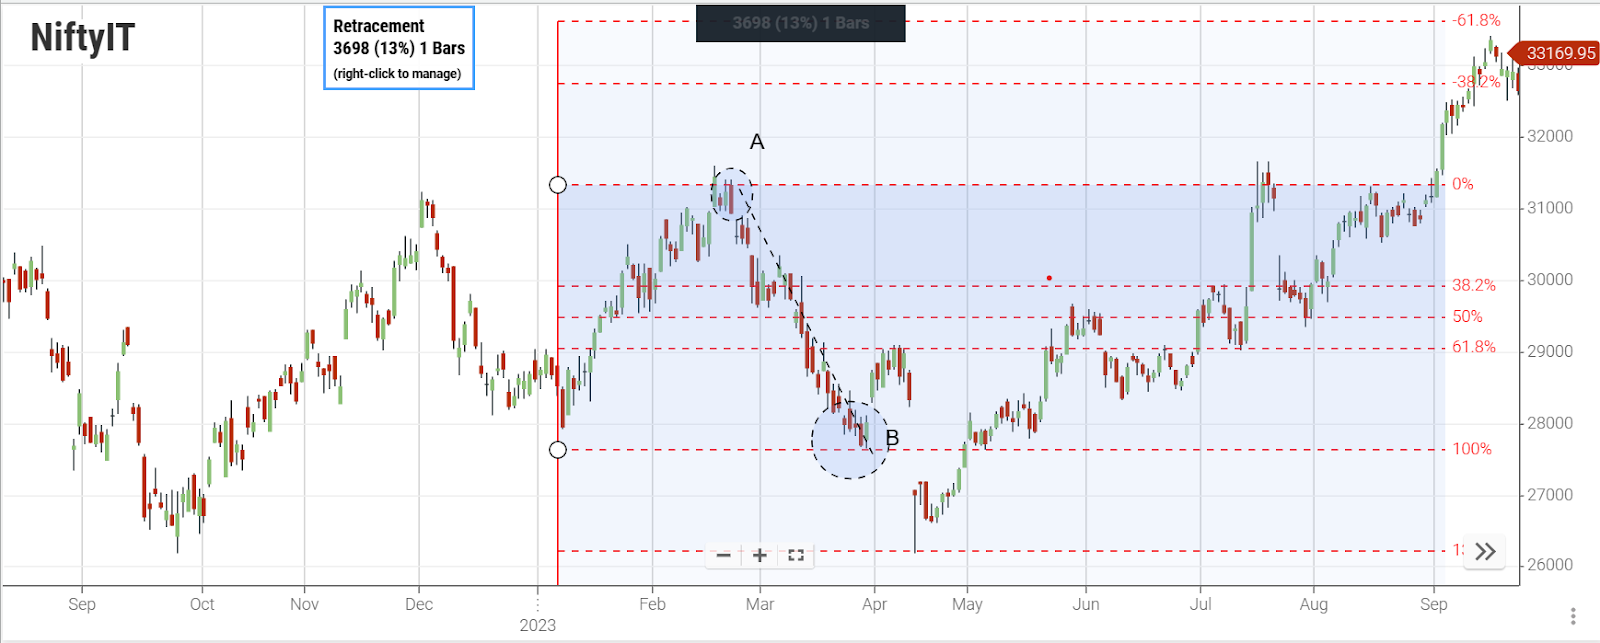
When analyzing a downtrend:
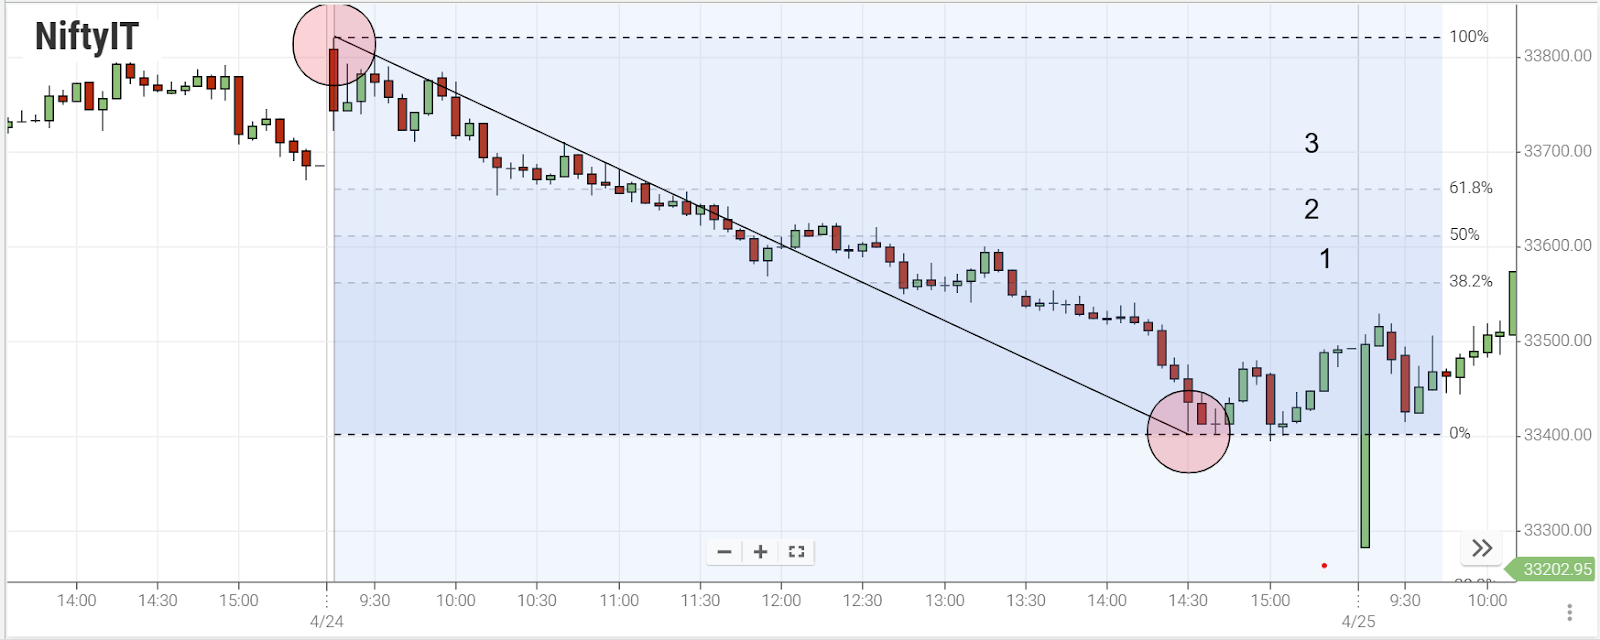
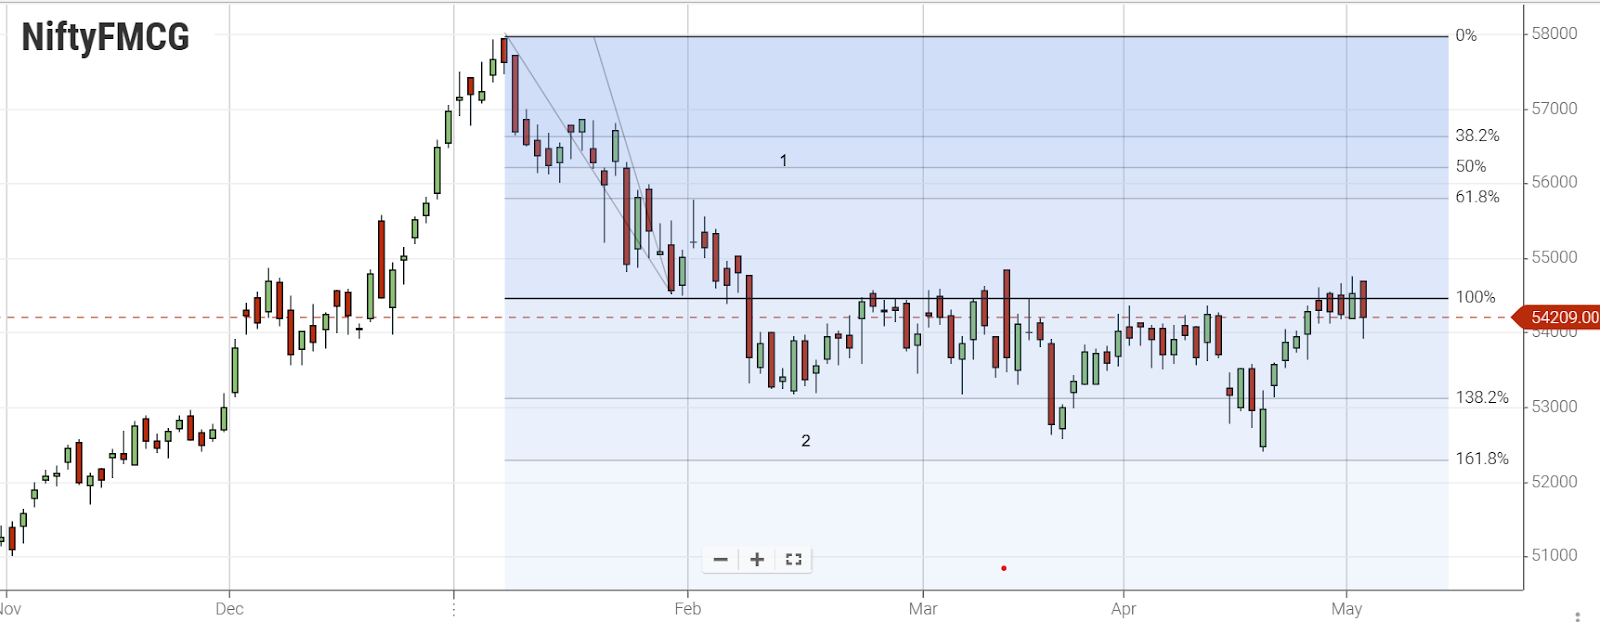
The Fibonacci tool is used manually. In a downtrend, you apply the tool from the beginning of the downward move to the end, always from left to right. The following chart demonstrates how this process is carried out.
The chart below shows 38.2%, 50%, and 61.8%. These levels are commonly used even when other retracement levels have been identified and are effective in trading.
1: The tool begins at the top when it is drawn.
2: It concludes at the bottom, drawn from left to right.
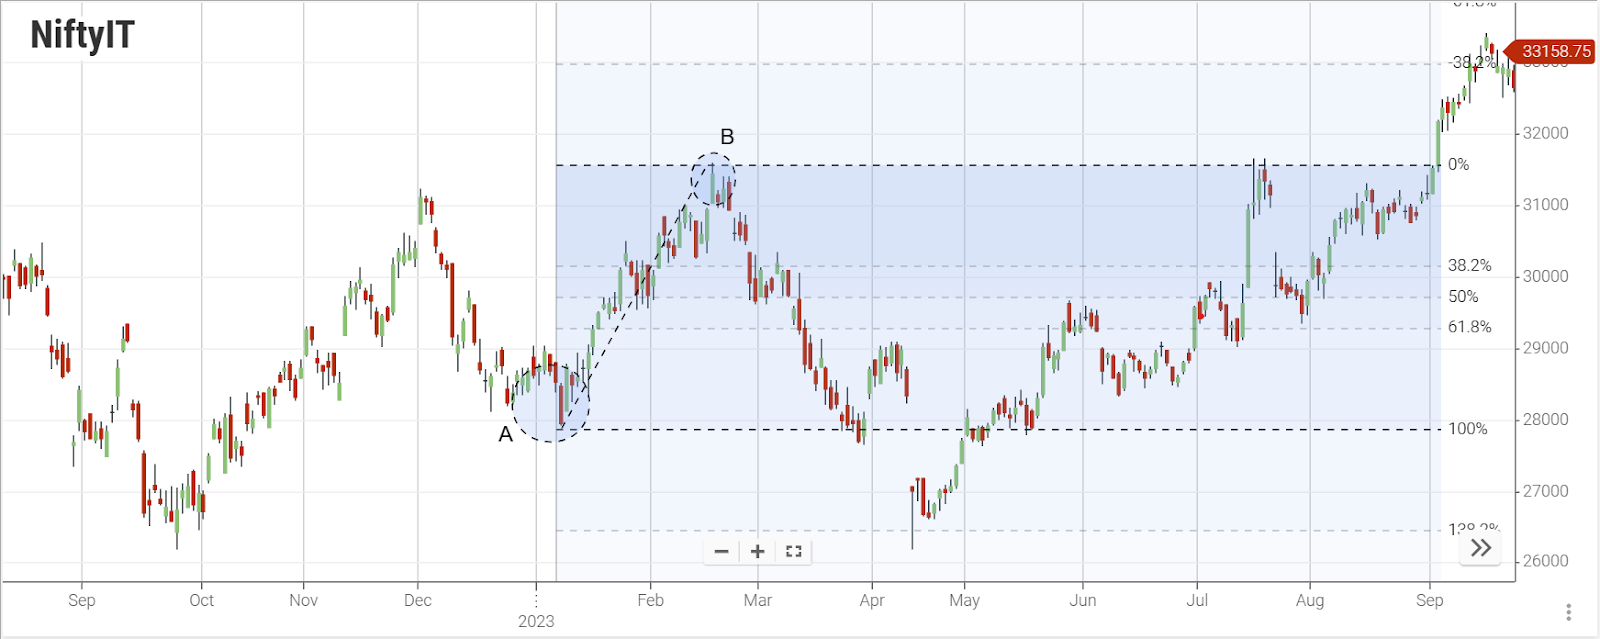
When analyzing a Uptrend
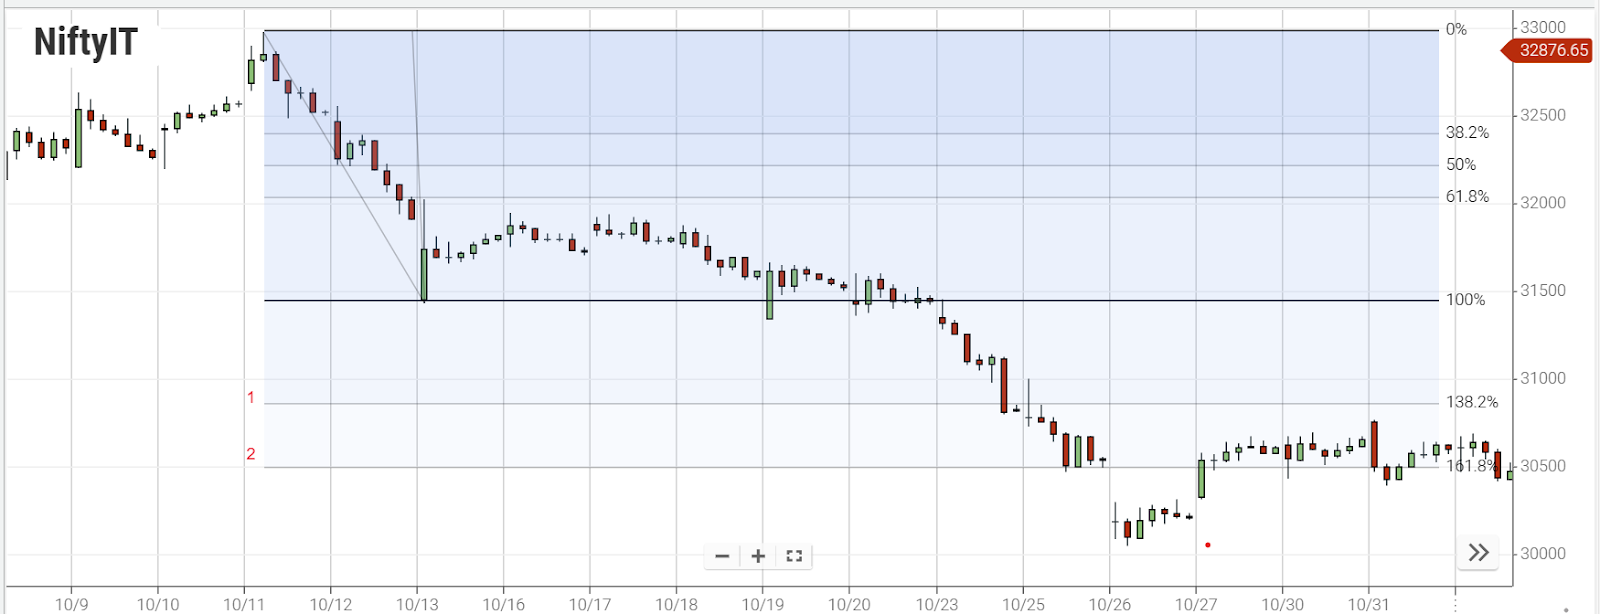
When there's an upward move, the tool is used from the bottom, ending at the top—always applied from left to right. This method comes to life in the visual representation provided in the chart below
A. The tool is started from the bottom.
B. It is ended at the top, drawn from left to right.
In MT4, Fibonacci levels are automatically generated. Once the Fibonacci tool is applied, it positions these levels between the starting and ending points of a move, visible in the charts above. These points are referred to as retracement levels.
These Fibonacci levels are represented as percentages of the total move. For instance, the level placed exactly halfway between the start and the end of the move is the 50% retracement level. If the price retraces halfway back, it's considered to have retraced to the 50% level. This level then functions as either support or resistance, depending on the direction of the trend.
In essence, these retracement levels indicate the extent to which a pullback might occur.
In the chart below, you'll find the 38.2%, 50%, and 61.8% levels. These are frequently used points to which the price might retreat. It's worth noting that there are additional retracement levels that have been identified and prove effective as well.
-
38.2% level
-
50.0% level
-
61.8% level
Choosing the Appropriate Entry Point
To choose the right level to enter the market, traders have two approaches:
-
Aggressive Entry: Traders can choose to enter the market as the price reaches each retracement level. They enter at each level, placing a stop loss on the opposite side of the Fibonacci level. If the stop-loss is triggered, they enter again at the next level and continue this process until the price moves in their favor. This method is more aggressive in using the Fibonacci tool for entries.
-
Patient Entry: Alternatively, traders can wait until the price finds support or resistance at these Fibonacci levels. They observe the price for signs of support or resistance, wait for the price to move back in the original trend direction, and then enter the market.
Fibonacci extension levels
Fibonacci extension levels serve not only to identify retracement levels for support or resistance but also to project where the price might reach. Traders use Fibonacci extensions for profit-taking or even making entries against the current trend.
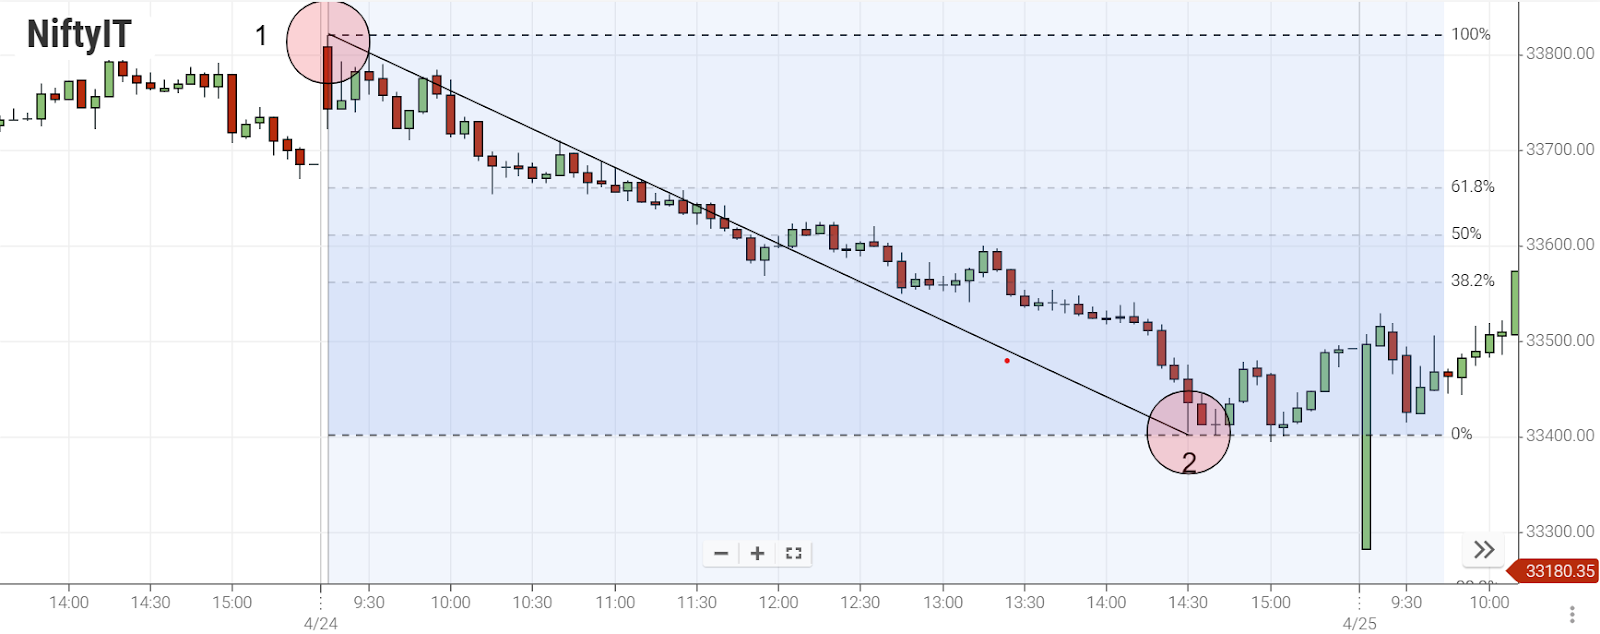
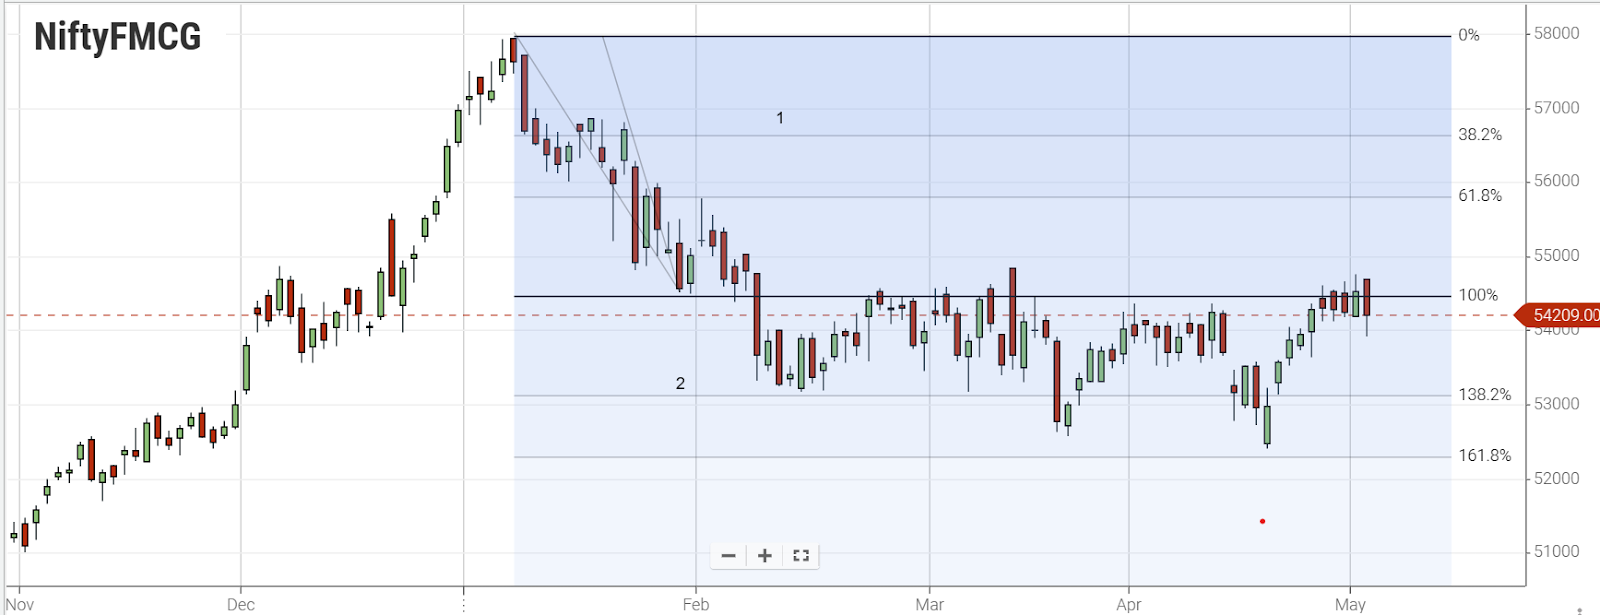
Traders often rely on common extension levels such as 138.2% and 161.8%, although there are various other extensions used by different traders. The example below illustrates extension levels in a downtrend.
Strategy 1:
-
138.2% extension level
-
161.8% extension level
Strategy 2:
Traders utilize the Fibonacci tool to enter a position at a retracement level when the price pulls back and exit at one of the extension levels when the price moves further.
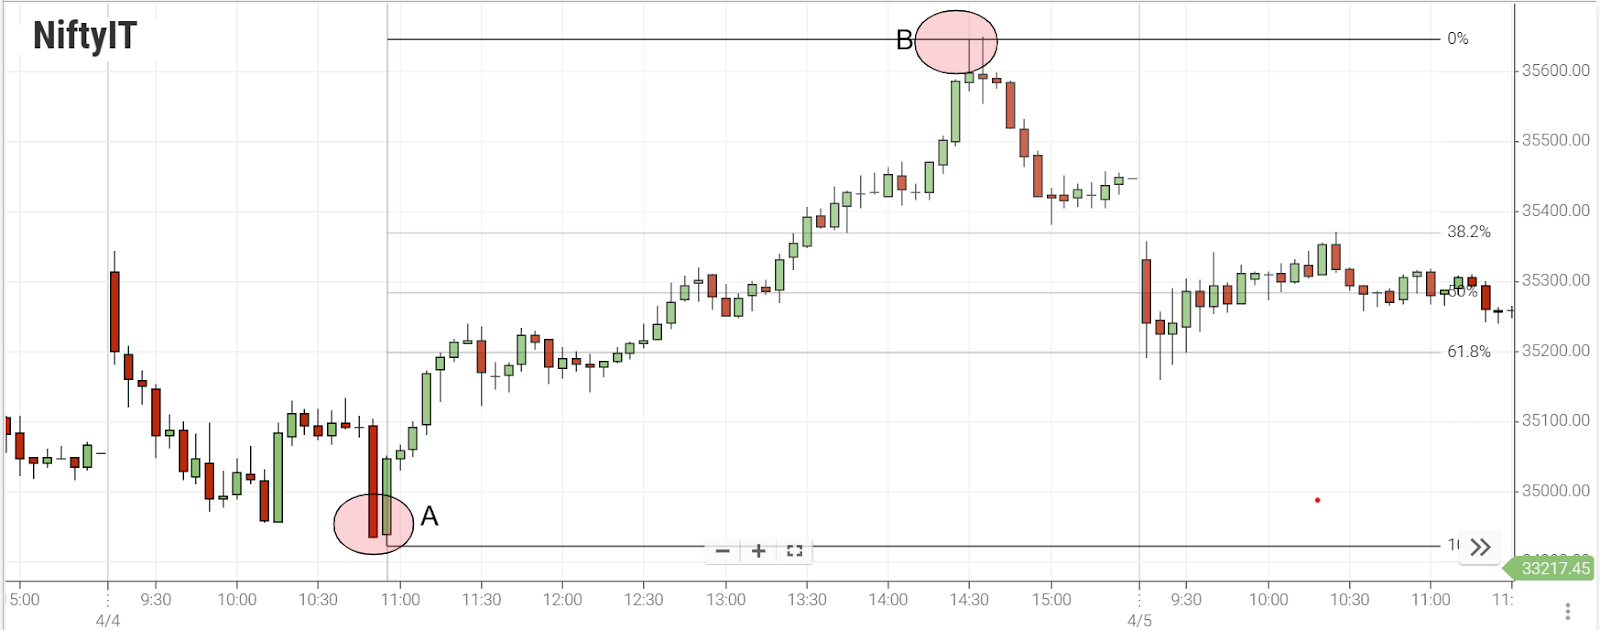
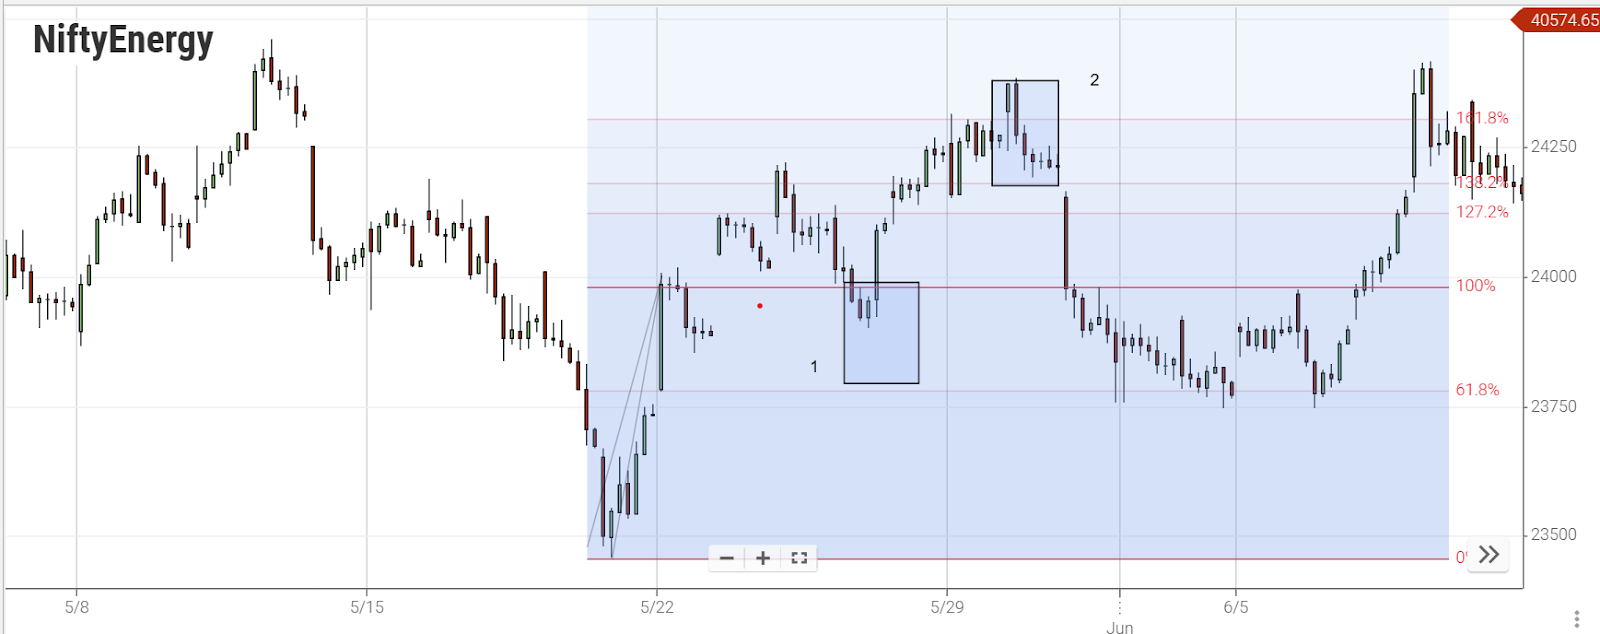
The chart below displays the extension levels of the Fibonacci tool applied to an uptrend, clearly showing both the retracement and extension levels.
-
Potential long entry at a retracement level
-
Potential exit at an extension level
How to Determine the Profit-Taking Extension Level
To maximize profitability, traders can match extension levels with corresponding retracement levels. For instance, if the price retraced to the 38.2% level, the related extension level would be 138.2.
-
Short entry at 38.2% retracement level
-
Corresponding extension level of 138.2%
Strategy 3: The related extension to the 50.0 or 61.8 retracement level is 161.8
-
Short entry at 50.0% retracement level
-
Corresponding extension level of 161.8%
Fibonacci retracement and extension levels are correlated with each other.
The self-fulfilling prophecy concept is relevant in this context. Banks and large financial institutions often aim to take their profits, targeting specific Fibonacci extension levels. They anticipate that other banks and traders will do the same, creating a self-fulfilling prophecy where these levels become significant points of action.
However, it's crucial to understand that this isn't a strict rule. For extension levels to be effective, they must align with a confirmed trend, which doesn't happen every time.
A simpler approach to using extension levels is to exit a trade when the price encounters significant support or resistance at these Fibonacci levels. If the price struggles to break through a Fibonacci level, it can be considered a good exit point.
Nut Shell:
-
The Fibonacci tool places support and resistance lines on a chart based on price movement.
-
Always apply from left to right for both uptrends and downtrends.
-
Retracement levels are between the start and end of a move, indicating possible price reversals.
-
Common retracement levels: 38.2%, 50%, and 61.8%, used for market entries.
-
There are two entry methods: aggressive (entering at each level) and passive (waiting for price reversal).
-
Extension levels show where prices could go beyond the initial move.
-
Common extension levels: 138.2% and 161.8%, used for market exits.
-
Retracement and extension levels can match; for example, retracement to 38.2% often extends to 138.2%, and retracement to 50% or 61.8% may extend to 161.8%.
Frequently Asked Questions
-
What is the fundamental principle behind the Fibonacci trading strategy?
Fibonacci's trading strategy relies on specific price levels derived from the Fibonacci sequence, guiding traders on potential entry and exit points in the market.
-
How can one determine Fibonacci levels for Nifty trading today?
Traders can calculate Fibonacci levels for Nifty based on the most recent price movements, aiding in making informed trading decisions for the day.
-
What's the significance of Fibonacci retracement in Bank Nifty trading?
Fibonacci retracement in Bank Nifty trading helps identify potential reversal points, allowing traders to anticipate market movements for better strategy planning.
-
How does Fibonacci trading benefit beginners in the market?
Fibonacci trading offers beginners a structured approach to understanding market trends, providing clear levels for entries and exits, making trading less complex.
-
What's the difference between Fibonacci retracement and extension levels?
Fibonacci retracement levels indicate potential reversal points, while extension levels project where prices could move beyond the initial trend, aiding traders in profit-taking strategies.
-
How can Fibonacci levels be utilized effectively in intraday trading?
In intraday trading, Fibonacci retracement levels can guide traders on entry and exit points within the same trading day, enhancing short-term trading decisions.