Knowledge Center Technical Analysis
Wedge Patterns
Rising Channel Chart Pattern
The rising channel chart pattern (also known as ascending channel pattern) is a technical analysis pattern commonly observed on price charts. It is a continuation pattern that indicates the persistence of an existing upward trend in the market. Traders and investors often use this pattern to make informed decisions about potential entry and exit points in the market.
How does a Rising Channel Chart pattern look like?
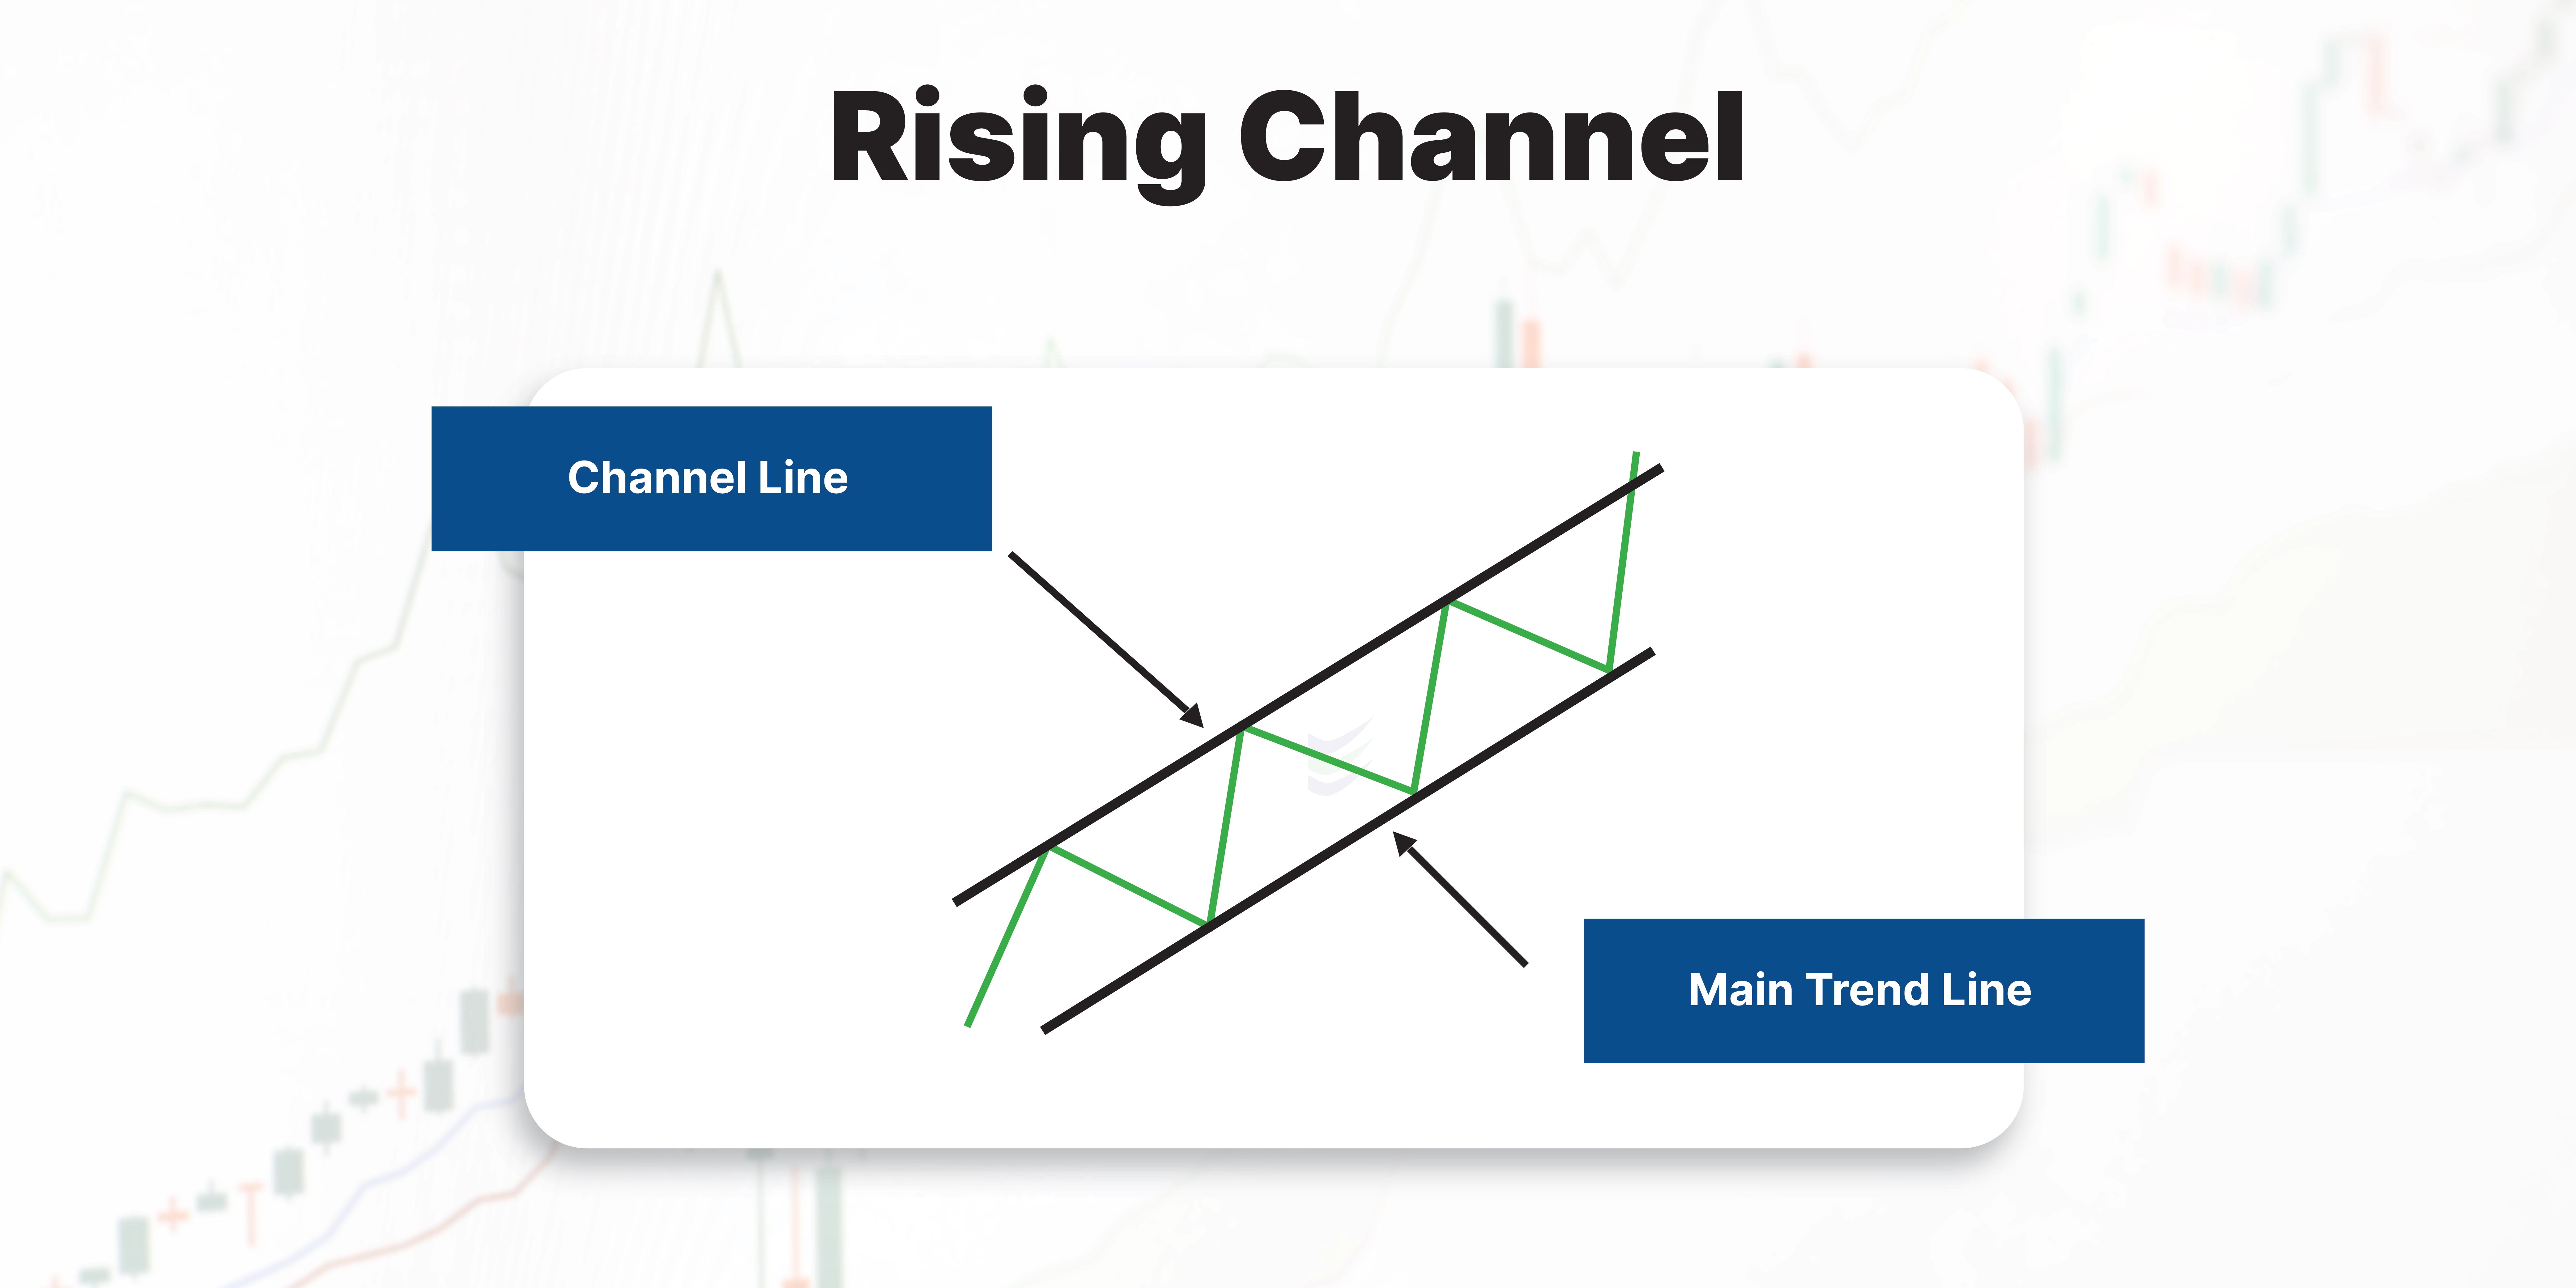
A rising channel chart pattern has a distinctive appearance on a price chart. It is characterized by two parallel trendlines that slope upwards, indicating an ongoing uptrend in the market.

Here's how a rising channel pattern typically looks:
Upper Trendline: The upper trendline connects the highs or peaks of the price movements. It runs parallel to the lower trendline and is typically at a higher level on the chart. It is also called the Channel line or secondary trend line or Resistance Line
Lower Trendline: The lower trendline connects the lows or troughs of the price movements. It also runs parallel to the upper trendline and is below it.It is also called the main trendline or primary trendline or Support Line.
Price Movements: Within the rising channel, the price tends to oscillate between the upper and lower trendlines. Traders can observe a series of higher highs and higher lows as the price progresses, indicating a strong uptrend.
Channel Width: The distance between the upper and lower trend lines represents the width of the channel. This width can vary, and traders often pay attention to how the price behaves within this channel.
Volume: Volume analysis can be a valuable complement to identifying a rising channel. Typically, traders look for decreasing volume as the price moves within the channel. This can indicate a potential weakening of the trend.
When does a Rising Channel Chart pattern is formed?
A Rising Channel Chart pattern is typically formed during an existing uptrend in the financial markets. It emerges as a result of the price consistently making higher highs and higher lows over time. Here's when a rising channel pattern is typically formed:
Established Uptrend: The rising channel pattern occurs within an established uptrend, which means that the market has been experiencing a series of upward price movements. This could be a continuation of a previous uptrend or the beginning of a new one.
Higher Highs and Higher Lows: As the uptrend progresses, the price makes successive higher highs and higher lows. These higher highs are usually reached at or near the upper trendline of the rising channel, and the higher lows are found near or along the lower trendline.
Parallel Trendlines: The rising parallel channel pattern takes shape as traders connect these higher highs and higher lows with two ascending parallel channel trendlines. The upper trendline joins the highs, and the lower trendline connects the lows. These trendlines should slope upward and run roughly parallel to each other.
Multiple Touchpoints: To confirm the validity of the rising channel pattern, it's important to have multiple touchpoints along both the upper and lower trendlines. These touchpoints demonstrate that the pattern is not a random occurrence but a consistent price movement within the channel.
Decreasing Volume (Optional): While not a strict requirement, some traders look for decreasing trading volume as the price moves within the rising channel. A decrease in volume may indicate a potential weakening of the trend, although it should be used in conjunction with other analysis tools.
What does a Rising Channel Chart pattern indicate?
A Rising Channel Chart pattern indicates several important aspects of the price action within an ascending channel in uptrend in the financial markets:
Continuation of Uptrend: The primary interpretation of a rising channel pattern is that it suggests the continuation of an existing uptrend. This means that the bullish sentiment and buying pressure in the market remain intact.
Higher Highs and Higher Lows: Within the rising channel, traders observe a series of higher highs and higher lows. This pattern of higher highs indicates that buyers are consistently pushing prices higher, demonstrating a strong uptrend.
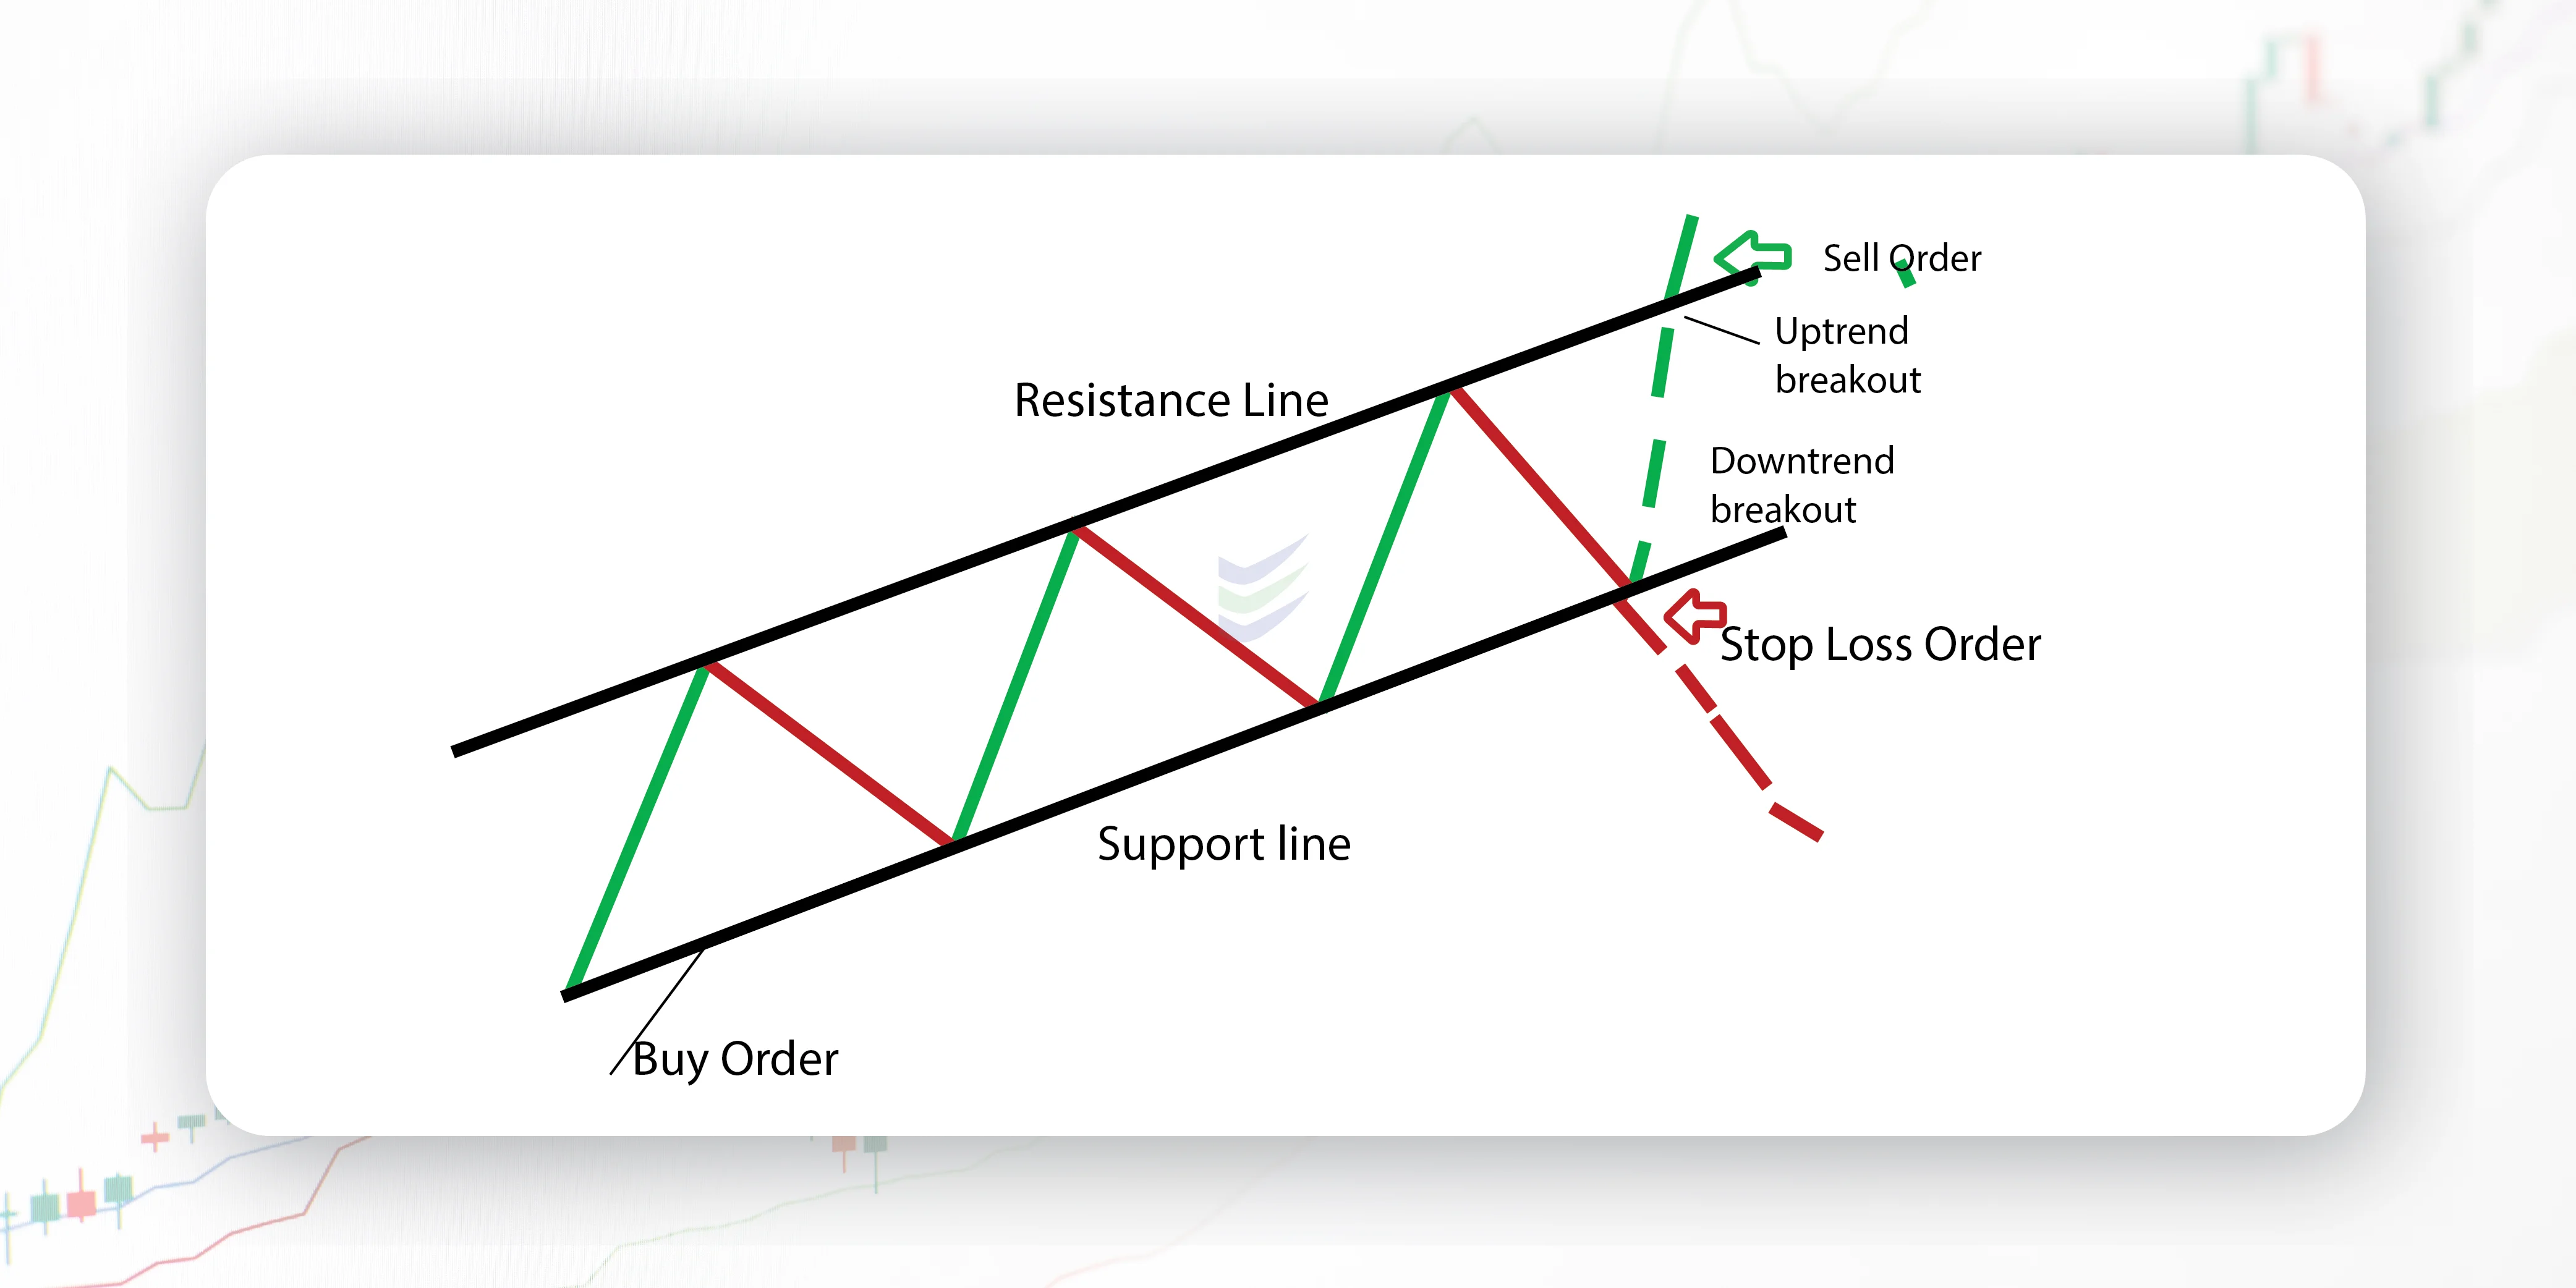
Support and Resistance Levels: The lower trendline of the rising channel serves as a dynamic support level, as it typically coincides with the higher lows. Traders often see this as an opportunity to enter long positions or add to existing ones when prices approach this support.The lower trendline is called as support line or support level and upper trendline is called as resistance line or resistance level.
Potential Entry Points: Traders often consider buying near the lower trendline of the rising channel, anticipating that the price will bounce within the upward channel pattern. This provides potential entry points for bullish trades.
Caution at Upper Trendline: As the price approaches the upper trendline of the channel, traders exercise caution. This is because the upper trendline may act as a resistance level. It's a point where the uptrend could temporarily stall or reverse.
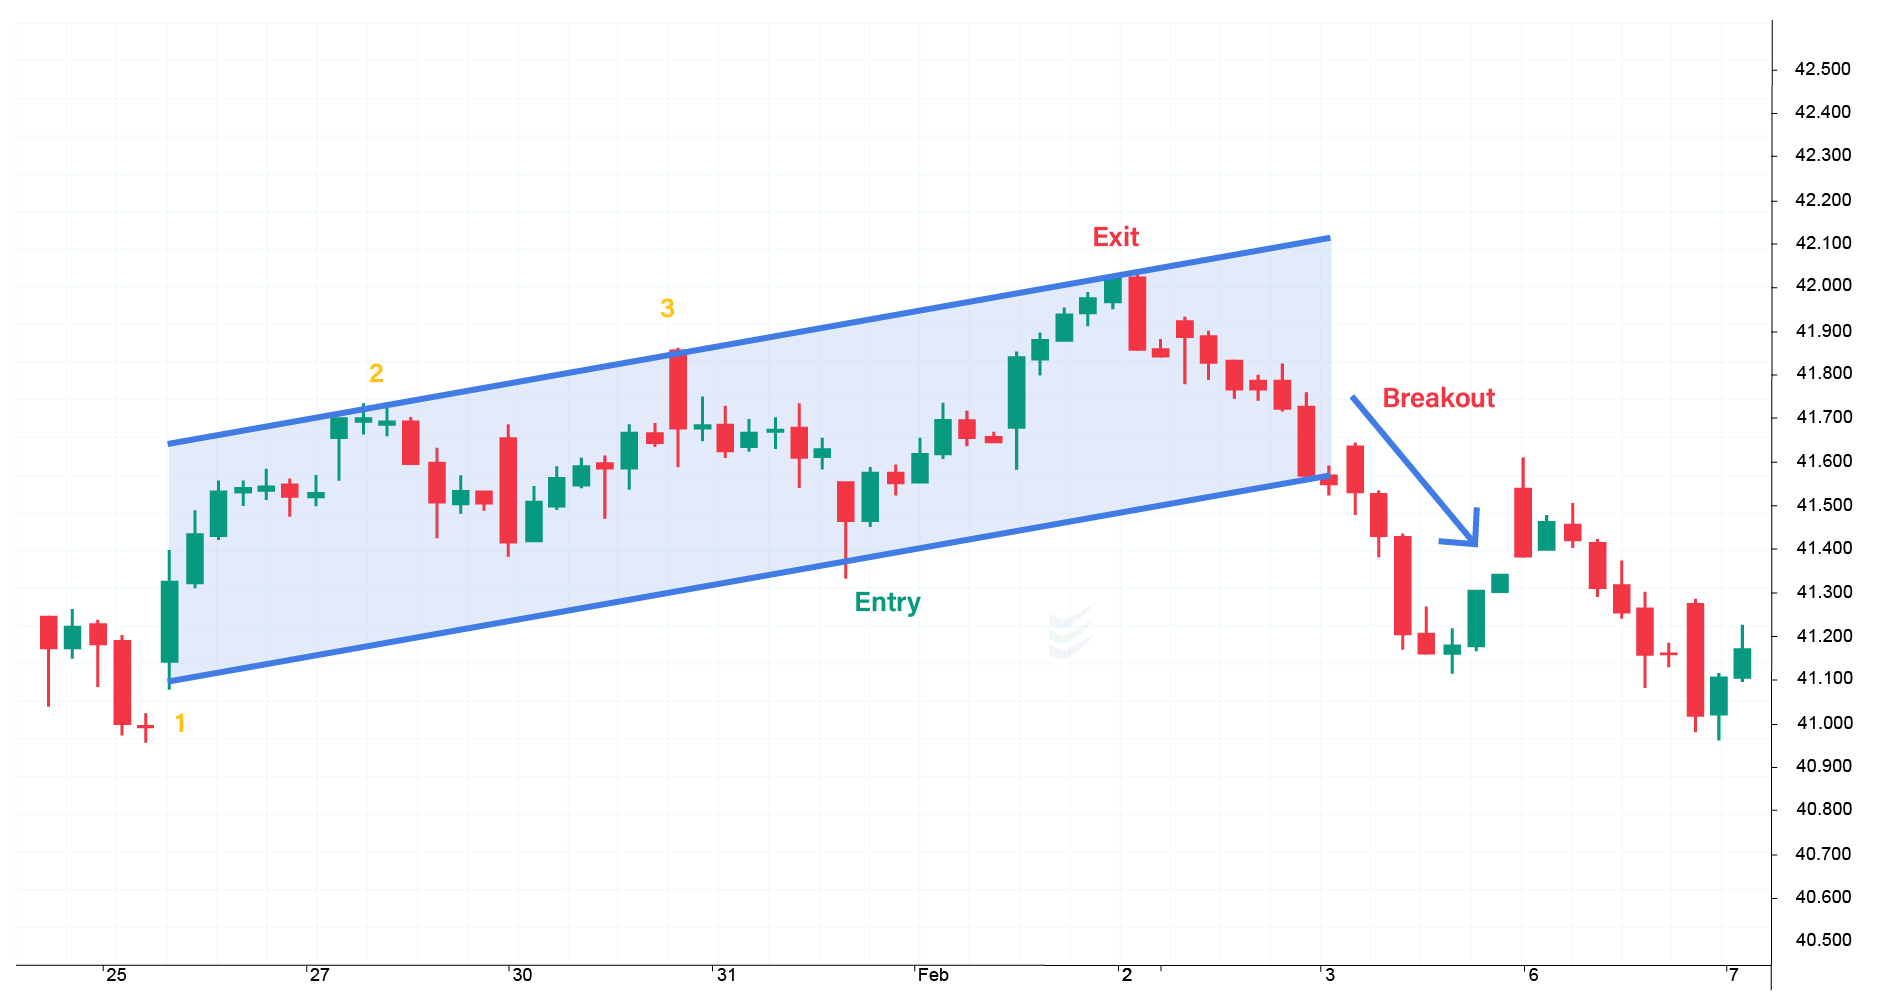
Breakout Possibility: While a rising channel suggests the continuation of an uptrend, traders also watch for potential ascending channel pattern breakouts. A rising channel pattern breakout can occur when the price either breaks above the upper trendline or below the lower trendline. An upside channel pattern breakout may signal a potential acceleration of the uptrend, while a downside breakout could indicate a reversal or trend change.
Weakening Trend (if applicable): Some traders use decreasing chart pattern trading volume within the rising channel as a sign of a weakening trend. A declining volume may suggest that buying interest is waning, which could be an early warning sign of a potential trend reversal. However, this should be used in conjunction with other analysis tools.
How to trade when you see a Rising Channel Chart pattern?
Trading when you identify a Rising Channel Chart pattern involves making informed decisions based on the pattern's characteristics and potential outcomes.

Here are steps to consider when ascending channel trading:
Confirm the Uptrend: Ensure that the rising channel is occurring within an established uptrend. This pattern is most reliable when it's in harmony with the prevailing market trend.
Identify Entry Points: Look for opportunities to enter long positions near the lower trendline of the rising channel. This is typically where prices bounce upward. Timing your entry near this support level can be a strategic move.
Set Stop-Loss Orders: Implement risk management by placing stop-loss orders below the lower trendline. This helps limit potential losses if the price breaks below the channel, indicating a possible trend reversal.
Determine Profit Targets: Consider taking profits or scaling out of your position as the price approaches the upper trendline of the channel. This is where the price may encounter resistance. Setting profit in rising channel pattern targets helps lock in gains.

Monitor for Breakouts: Be vigilant for potential rising channel breakouts, which can occur in two ways:
Upside Breakout: If the price breaks above the upper trendline, it may indicate a stronger bullish channel pattern move. Some traders enter additional long positions when this happens.Buy position is indicated when the breakout is in upside direction.
Downside Breakout: If the price breaks below the lower trendline, it suggests the potential for a trend reversal. In this case, you may want to exit long positions or even consider short positions if the reversal is confirmed.Sell signal is indicated when the breakout is in downside direction.
Use Volume Analysis (Optional): Some traders use volume analysis to gain further insights. A decrease in trading volume within the channel may signal a weakening trend, while an increase in volume during a breakout can provide confirmation.
Apply Additional Technical Indicators: Combine the rising channel analysis with other technical indicators like moving averages, oscillators, or momentum indicators to confirm your trading decisions.
Stay Informed: Continuously monitor market news and events that could impact your trade. Unexpected news can lead to rapid price movements.
Back testing and Learning: Before trading live, consider back testing the strategy on historical data to evaluate its performance. Additionally, continue to learn and adapt your approach based on real-world trading experiences.
Frequently asked questions
Is the ascending channel pattern bullish or bearish?
An ascending channel pattern is generally considered a bullish continuation pattern. This means that when an ascending channel forms in a financial chart, it often occurs within an existing uptrend and suggests that the bullish trend is likely to continue after a period of consolidation.
How is a rising channel different from a falling channel pattern?
A rising channel slopes upward and is typically found within an uptrend, while a descending channel slopes downward and is usually associated with a channel down pattern.
What does a rising channel pattern indicate about market sentiment?
A rising channel suggests that the prevailing bullish sentiment remains intact. It signifies a series of higher highs and higher lows, indicating sustained buying pressure.
Are there signs of a potential trend reversal within a rising channel?
Yes, a breakdown below the lower trendline can indicate a potential trend reversal. Traders should monitor the pattern for signs of a breakout in either direction.
How should I manage risk when trading a rising channel pattern?
Implement risk management strategies, such as placing stop-loss orders below the lower trendline to limit potential losses in case of a rising channel breakdown.
Can rising channel patterns be used in different financial markets?
Yes, rising channel patterns can be applied to various financial markets, including stocks, forex, commodities, and cryptocurrencies. However, traders should consider market-specific factors.
