Knowledge Center Technical Analysis
Wedge Patterns
Falling Wedge Chart Pattern
What is a Falling Wedge Pattern?
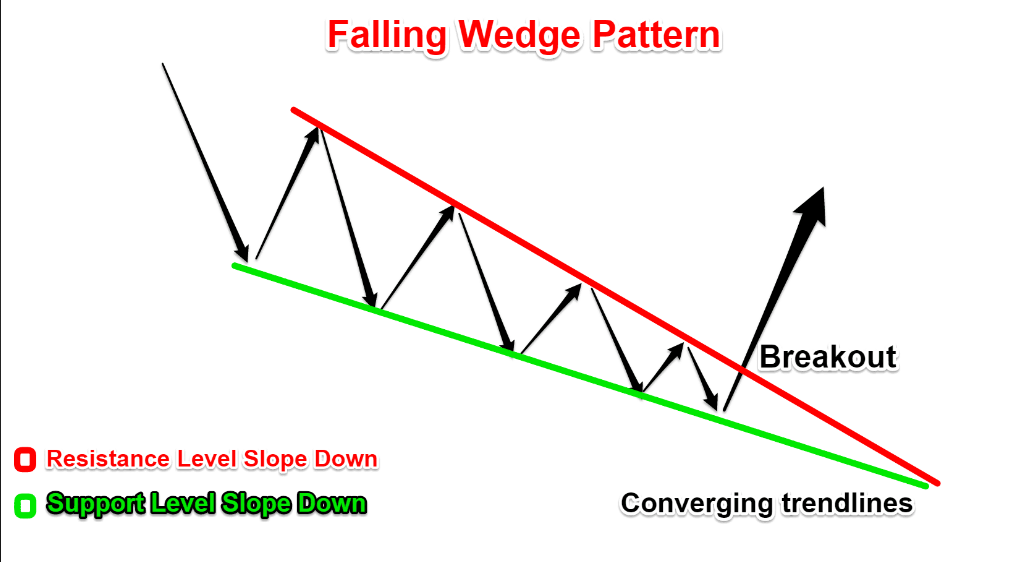
A falling wedge pattern is a technical chart pattern that appears during a downtrend and is considered a bullish reversal pattern. It is characterized by two converging trendlines, where the upper trendline slopes downward at a steeper angle than the lower trendline, creating a falling wedge shape.
When the price makes lower highs and lower lows, it forms two contracting lines, which gives rise to this pattern.
Buying opportunities: We can look for potential buying opportunities as the falling wedge usually precedes a reversal to the upside.
Identifying the falling wedge pattern in an uptrend .In an uptrend, a falling wedge is a continuation pattern that gives rise when the market contracts temporarily.It notifies the restoration of the uptrend, which gives rise to possible buying opportunities.
Characteristics of Falling Wedge Chart Pattern
Convergence: The pattern indicates a gradual narrowing of price movements, showing a decrease in selling pressure.
Duration: Falling wedges can form over various time frames, from weeks to months, and they represent a period of consolidation.
Breakout direction: Traders anticipate a potential falling wedge pattern breakout to the upside. A break above the upper trendline is considered a bullish falling wedge signal.
Volume: Ideally, declining volume within the wedge pattern and an increase in volume during the descending wedge breakout can provide confirmation of the pattern.
Targets: The falling wedge target price is often measured by taking the widest part of the wedge at the start and projecting it upward from the breakout point.
Reversal indication: Falling wedges can suggest a change in sentiment from bearish to bullish and may lead to a trend reversal.
Confirmation: Traders typically wait for a convincing breakout above the upper trendline and an increase in volume to confirm the pattern.
Stop-loss: To manage risk, traders may place a stop-loss order just below the lower trendline in case the pattern fails to materialize.
Versatility: Falling wedges can be found in various financial markets, including stocks, currencies, and commodities.
When Does a Falling Wedge Pattern is Formed?
A descending wedge pattern in downtrend is typically formed:
1. Pre-existing Downtrend: A falling wedge pattern in downtrend indicates that sellers are in control, and the price is moving lower.
2. Converging Trendlines: Within this downtrend, traders and analysts observe the formation of the falling wedge pattern. It consists of two converging trend lines – the upper trendline (resistance) and the lower trendline (support).
3. Trendline Slope: The distinguishing characteristic of a falling wedge is that the upper trendline slopes downward at a steeper angle compared to the lower trendline. This creates a wedge shape as the price range narrows.
4. Lower Highs and Lower Lows: As the pattern develops, the price often forms lower highs and lower lows, showing that the downward momentum is still present but weakening.
5. Decreasing Volume: Ideally, as the price range within the falling wedge narrows, the trading volume tends to decrease. This decrease in volume is a sign of diminishing selling pressure.
6. Gradual Price Contraction: The pattern continues to contract until a breakout occurs.
A falling wedge pattern is significant because it signals a potential trend reversal from bearish to bullish. The narrowing price range within the pattern suggests that selling pressure is decreasing, and a shift in sentiment may be on the horizon. Traders typically watch for a breakout from the upper trendline to the upside as a confirmation of the pattern and a signal to enter bullish positions.
How To Identify a Falling Wedge Chart Pattern?
A falling wedge chart pattern is known as a continuation and reversal pattern. The easiest way to spot a falling or descending wedge pattern is by looking for two converging trend lines that have been forming over time. Each time these trend lines converge, they form what is known as a wedge that gives rise to its name. One could use a falling wedge pattern as an indicator or confirmation tool when entering trades in bearish markets where you may find yourself using indicators such as support levels or momentum oscillators in conjunction with this trading method. When executed correctly, a descending wedge pattern can provide you with decent returns if done so during trending periods.
What Does a Falling Wedge Mean In Trading?
Trading using a falling wedge chart pattern involves taking advantage of the potential bullish wedge pattern reversal indicated by the pattern. Here's a step-by-step guide on how to trade falling wedge pattern:
Identify the Falling Wedge Pattern: First, correctly identify and confirm the falling wedge pattern as described in previous responses.
Wait for Confirmation: Do not trade until you have a clear confirmation of the pattern. This confirmation typically comes with a breakout above the upper trendline, and it should ideally be accompanied by an increase in trading volume.
Entry Point: After the confirmation, you can consider entering a long (buy) position. This means you anticipate a bullish wedge reversal.
Stop-Loss Placement: To manage risk, place a stop-loss order just below the lower trendline or at a level where you are comfortable with the potential loss if the pattern fails to materialize. This protects you in case of a false breakout.
Take Profit and Targets: Determine your falling wedge pattern target price by measuring the widest part of the wedge at the beginning of the pattern and projecting it upward from the breakout point. This provides you with a potential target price.
Risk-Reward Ratio: Assess the risk-reward ratio to ensure that your potential reward justifies the risk you are taking. Typically, traders aim for a risk-reward ratio of 1:2 or better.
Position Sizing: Determine the size of your position based on your risk tolerance and overall portfolio management strategy.
Monitoring and Adjustments: Keep a close eye on the trade. If the price moves in your favor, consider adjusting your stop-loss to a break-even or trailing stop to protect your profits.
Exit Strategy: Be ready to exit the trade if it doesn't progress as expected or if the price reaches your predetermined target. Don't get overly greedy.
Continuous Learning: Always continue to educate yourself about trading strategies, risk management, and market analysis. Falling wedge patterns are just one tool in your trading toolkit.
Remember that no trading strategy is foolproof, and false breakouts can occur. Additionally, market conditions can change rapidly, so it's crucial to adapt your trading plan as needed. Trading based on technical patterns like the falling wedge trading should be part of a broader trading strategy that incorporates various technical and fundamental analysis tools to make well-informed decisions.
Trading Strategy
Technique 1
Identify the falling wedge pattern chart in a downtrend.
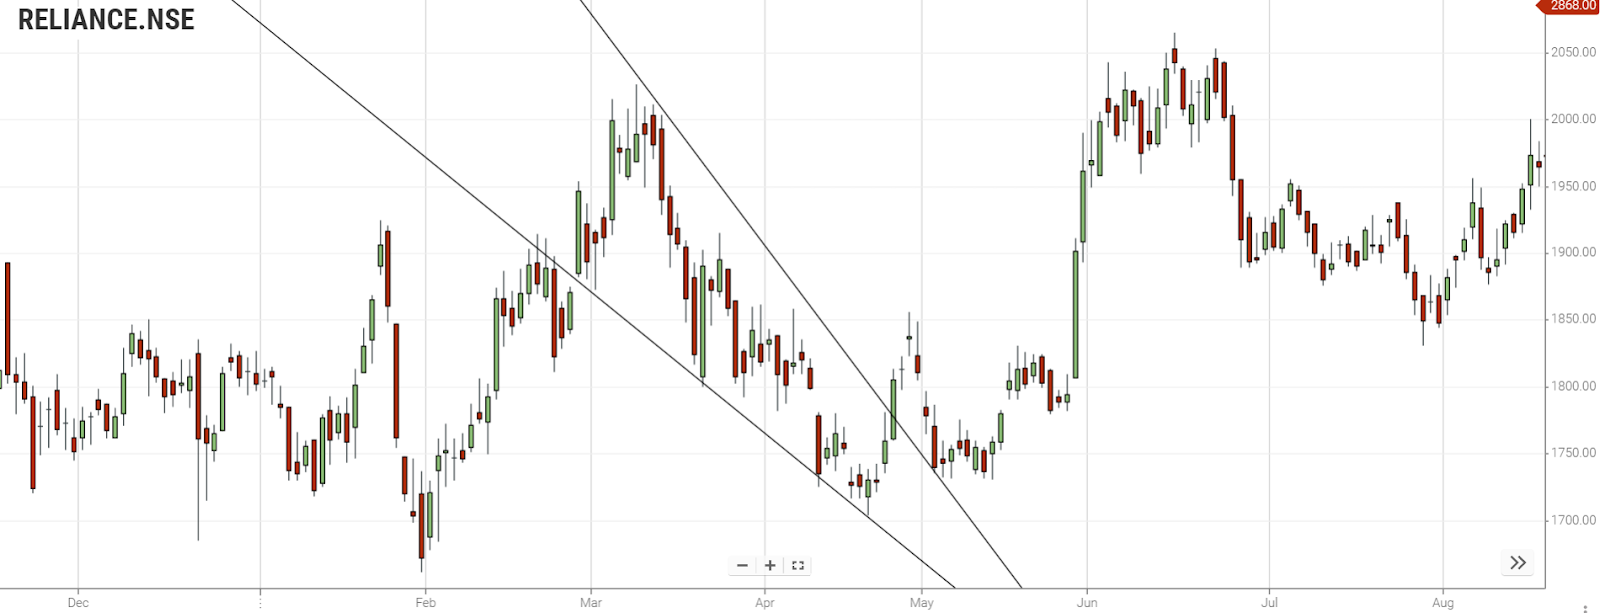
The chart above depicts an illustration of falling wedges in a downtrend.
Now, initiate your market entry by executing a long buy order as the top side of the wedge is breached.
To prevent false breakouts, exercise patience and confirm the breakout by ensuring the candle closes above the upper trendline before entering the trade.
The chart below depicts the buy order and the area where the price has broken the upper trend line of the wedge:
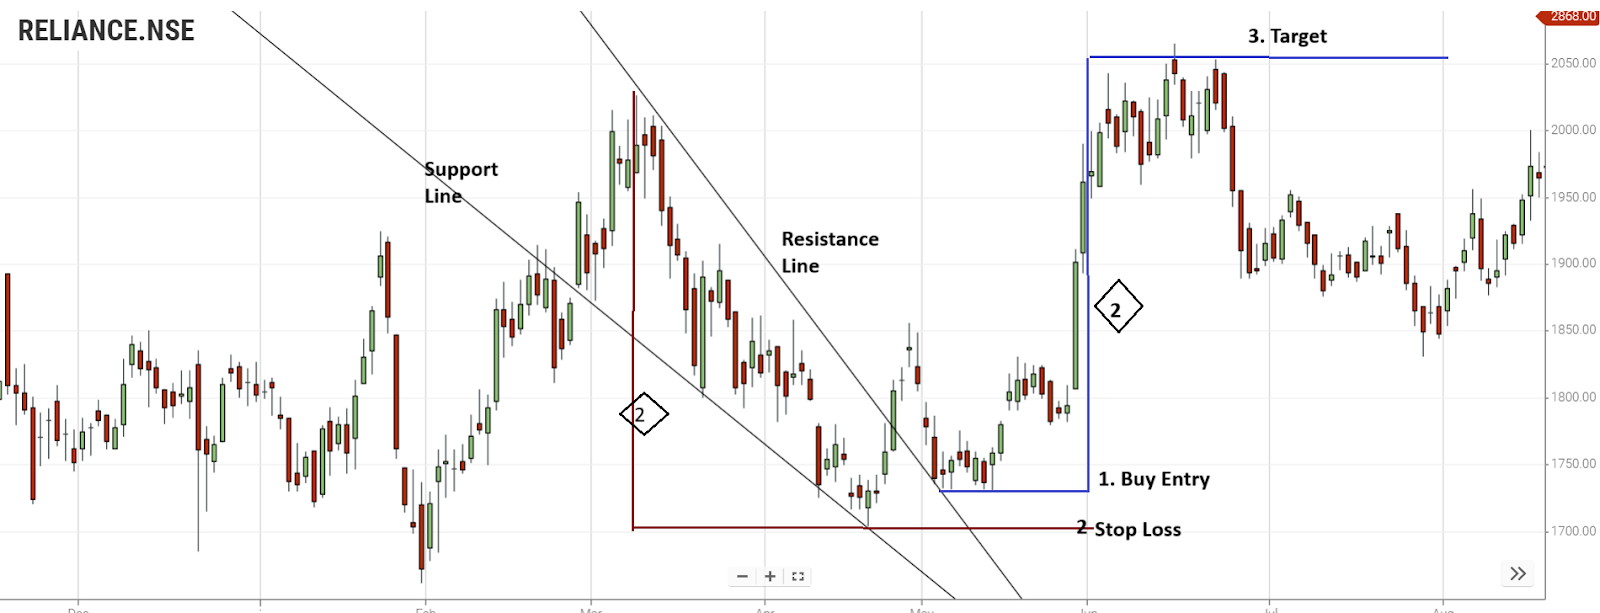
Long Buy Entry: The first step involves entering a long position when the price breaks above the upper trendline of the wedge.
Stop Loss: Place the stop-loss order below the lower trendline of the wedge, as shown in the chart, ensuring risk management.
Profit Target: Determine the profit target by measuring the height of the rear portion of the wedge and extending that distance upwards from the breakout point.
Rear of the Wedge: Point number 2 represents the back of the wedge, which is pivotal for estimating the price movement.
Distance from Entry to Target: Calculate the distance from the entry point (the buy order) to Target Point-3, which corresponds to the same measurement as the height of the rear part of the wedge (number 2).
Target Point-3 for Taking Profit: Identify Target Point-3 as your take profit level, based on the calculations and analysis of the falling wedge pattern.
Technique 2
Identify the falling wedge chart pattern in a downtrend.
Wait for the price to trade above the trend line (broken resistance).
Execute a buy order when the trend line is retested, with the previously broken resistance now serving as support.
Long Entry: Step 1 involves entering a long position as the price discovers support at the upper boundary of the falling wedge.
Upper Side of the Falling Wedge: Point number 1 indicates where the price finds support along the upper side of the falling wedge.
Rear of the Wedge: Point number 2 designates the back of the wedge, which plays a crucial role in the analysis.
Distance from Entry to Take Profit (TP3): Calculate the distance from the entry point (buy order) to the take profit level (TP3), which aligns with the same measurement as the rear of the wedge (number 2).
How to Place the Profit Target
Initiate a buy order when the trend line is retested, and the previously breached resistance level transforms into a support.
Just like in the first method, calculate the target by measuring the height of the wedge's rear part and extending that distance upward from the entry point.
Summary
The falling wedge pattern signals a possible buying opportunity after a downtrend or an existing uptrend. The entry (buy order) is placed when the price breaks above the top side of the wedge or when the price finds support at the upper trend line. The stop loss is placed below the back of the wedge. The take profit target is measured by taking the height of the back of the wedge and by extending that distance up from the trend line breakout.
Frequently Asked Questions
Difference between falling wedge and descending triangle.
1. Falling Wedge: A falling wedge is a bullish reversal pattern characterized by converging trendlines that slope downward, indicating a potential trend reversal to the upside.
2. Descending Triangle: A descending triangle is a bearish continuation pattern formed by a horizontal support line and a descending trendline as resistance, often suggesting a potential price decline.
3. Key Difference: Falling wedges typically appear within a downtrend and signal a reversal, while descending triangles often occur during a downtrend and imply a continuation of the existing bearish trend.
What happens after a falling wedge pattern?
After a falling wedge pattern:
1. Traders anticipate a bullish breakout.
2. Price tends to rise, potentially reversing the previous downtrend.
3. It's crucial to monitor for confirmation and manage trades with proper risk management.
What is a falling wedge breakout?
A falling wedge breakout:
1. Occurs when the price moves above the upper trendline.
2. Indicates a potential bullish reversal in a prior downtrend.
3. Traders often view it as a signal to enter long (buy) positions.
Are there variations of the falling wedge pattern?
Yes, there are variations, such as the descending wedge and rising wedge, which have different implications for trends and breakouts.
Can false breakouts occur with falling wedges?
Yes, like with any chart pattern, false breakouts are possible. Traders should exercise caution and use additional analysis tools for confirmation.