Knowledge Center Technical Analysis
Wedge Patterns
Broadening Top Chart Pattern
A broadening top pattern is a technical analysis formation characterized by diverging trendlines, creating a widening wedge pattern as prices oscillate between higher highs and lower lows. This pattern often signals increased market volatility and potential trend reversal, with traders monitoring volume for confirmation.
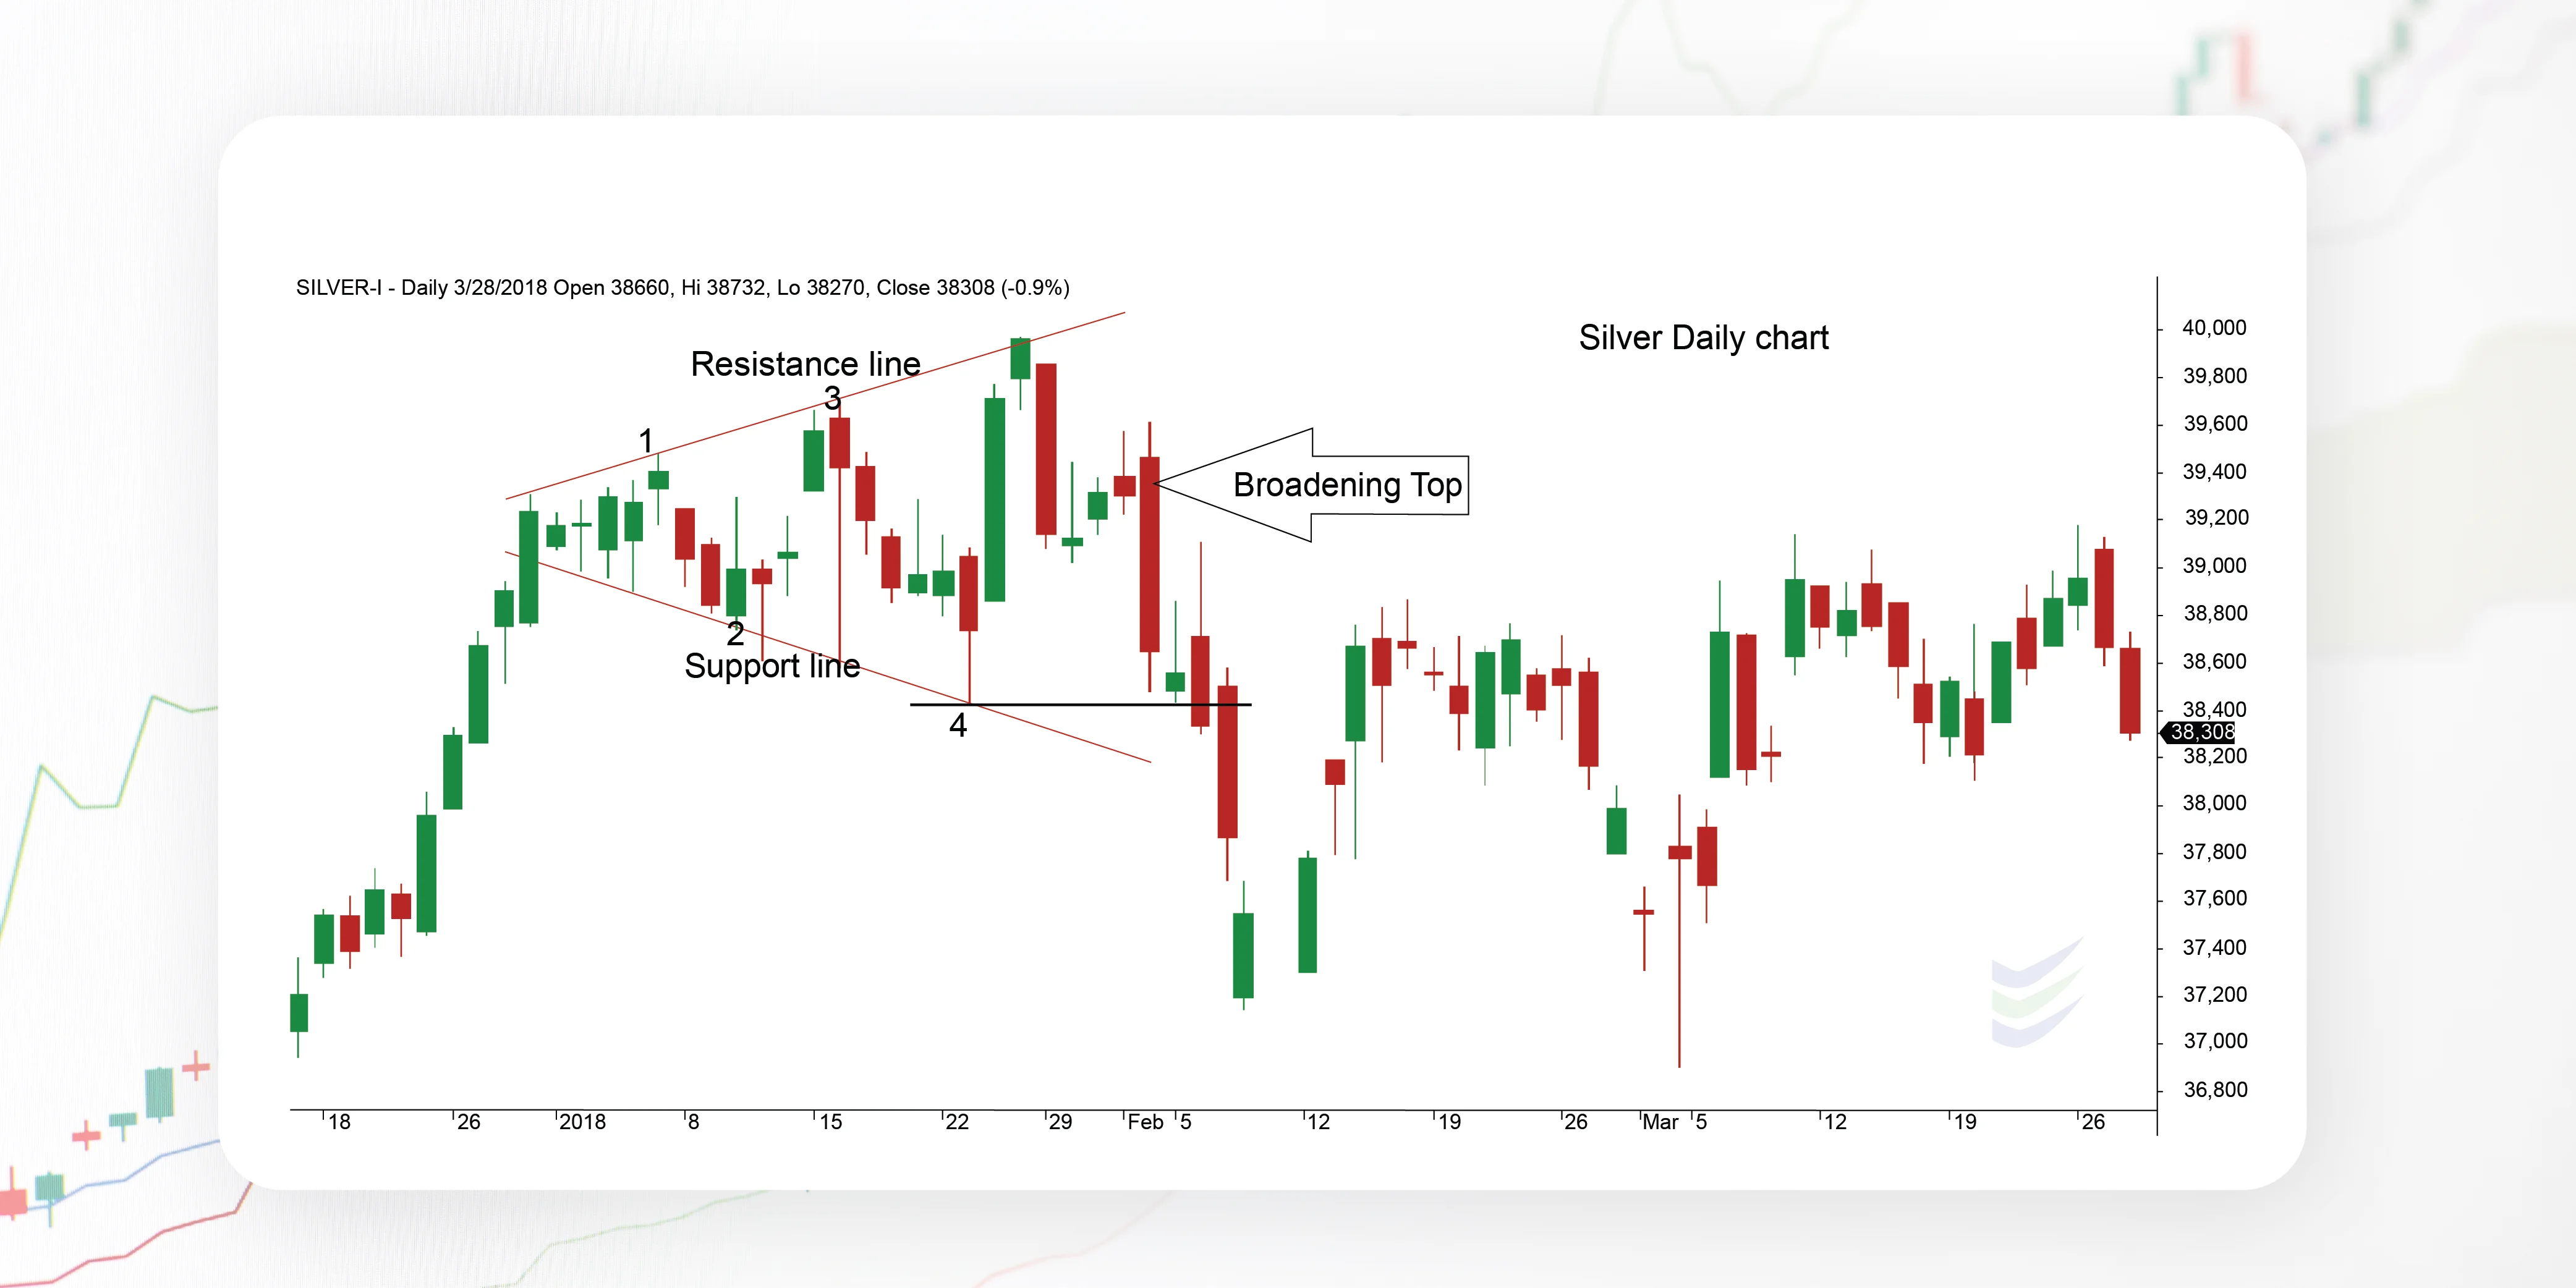
When the price of security increasingly makes higher highs (1, 3) and lower lows (2, 4) after two widening trend lines, the Broadening Top pattern is formed. The price is expected to move up or down past the pattern based on which the line is broken first. The discrimination between a Broadening Top and a Broadening Bottom is that the security price rises earlier to enter the pattern formation. This formation occurs when unpredictability is high or increasing and when a security's price moves with high unpredictability but little or no direction. It signals investor anxiety and indecision.
How does a Broadening Top Chart pattern look like?
A Broadening triangle pattern is characterized by two diverging trendlines on a price chart, forming a widening or broadening shape. Here's a more detailed description:
Formation of Trendlines:
Upper Trendline: Connects successive higher highs in the price action.
Lower Trendline: Connects consecutive lower lows in the price action.
Widening Shape: As the pattern develops, the distance between the upper and lower trendlines increases, creating a broadening or megaphone shape.

When does a Broadening Top Chart pattern is formed?
A Broadening Pattern is formed when the price action on a chart exhibits a specific set of characteristics. Here are the key conditions that contribute to the formation of a Broadening formation:
Diverging Trendlines:
The pattern is characterized by two trendlines moving in opposite directions. The upper trendline connects consecutive higher highs. The lower trendline connects consecutive lower lows.
Widening Shape:
As the pattern develops, the distance between the upper and lower trendlines increases, forming a broadening or megaphone shape.
Volatility Expansion:
The pattern reflects an expansion of volatility in the market. The price alternates between higher highs and lower lows, indicating increased uncertainty.
Trend Reversal Implication:
The Broadening Top is often considered a reversal pattern, signalling a potential shift in the prevailing trend.
Confirmation Breakout:
The pattern is deemed complete when the price breaks below the lower trendline. This breakout below the lower trendline confirms the potential reversal and is often used as a trigger for trades.
Volume Analysis:
Traders often consider trading volume during the pattern's formation.
Increased volume can lend more credibility to the pattern.
What does a Broadening Top Chart pattern indicate?
An expanding triangle (known as Broadening wedge pattern) indicates several important aspects of market behaviour and sentiment:
Increased Volatility: The widening shape of the pattern suggests that market volatility is on the rise. Price swings between higher highs and lower lows become more pronounced, reflecting a period of uncertainty and indecision among market participants.
Diverging Opinions: The pattern signifies conflicting opinions among traders and investors. Some are pushing the price higher (higher highs), while others are driving it lower (lower lows), creating a sense of confusion in the market.
Potential Reversal: Broadening Tops are generally seen as reversal patterns. They often signal that the prevailing trend is losing momentum and could be nearing a turning point. Traders often interpret the pattern as a warning of a possible trend reversal from bullish to bearish or vice versa. Hence, this pattern is also called as Bullish expanding triangle pattern or Bearish expanding triangle pattern depending on the direction of the preceding trend.
Market Indecision: The widening range between the trendlines suggests that participants are uncertain about the future direction of the asset's price. This uncertainty can lead to choppy price action and erratic market behaviour.
Breakout Signal: The completion of the pattern is marked by a breakout below the lower trendline. This breakout serves as a confirmation of the reversal signal, and traders may use it as a trigger for entering short (selling) positions or taking other appropriate trading actions.
Volume Confirmation: Traders often analyze trading volume during the pattern's formation. An increase in volume can provide further confirmation of the potential trend reversal, as it indicates that market participants are actively participating in the move.
How to trade when you see a Broadening Top Chart pattern?
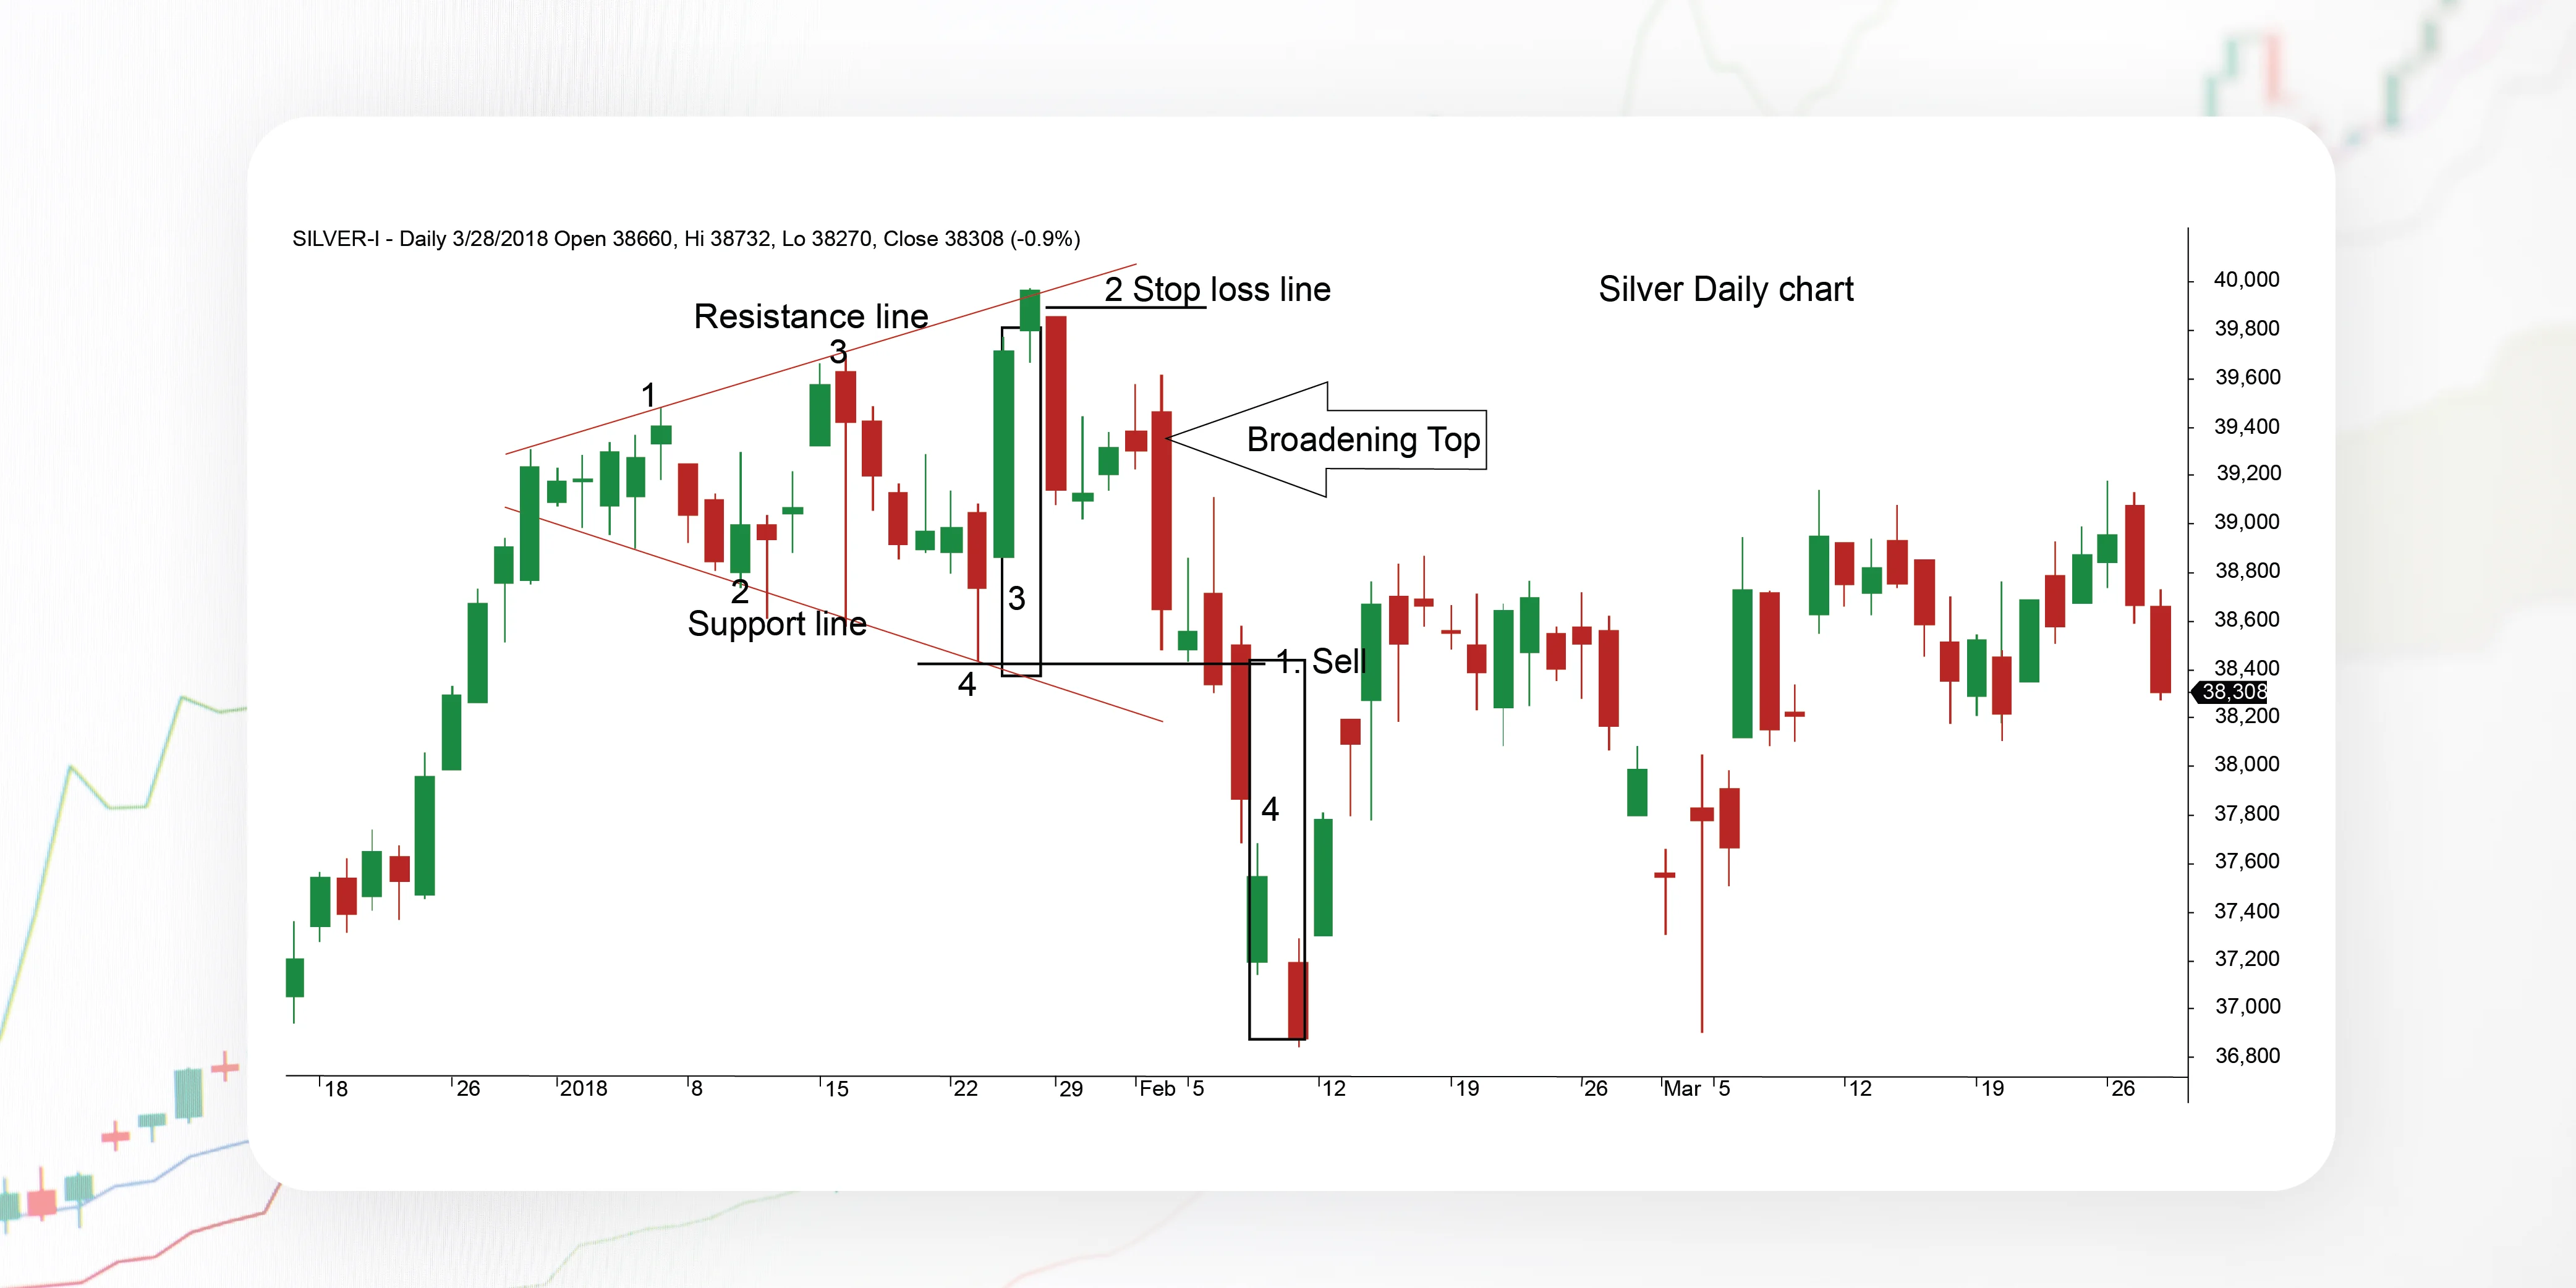
Trading based on an expanding channel Pattern involves careful analysis and the consideration of several factors. Let’s analyze the broadening formation pattern with the help of a chart.
Strategy 1:

No 1: Pole of the pattern
1. Short sell entry
2. Stop loss
3. Profit target distance (same height as pole no 1)
4. Target aim (Take profit)
A Broadening Top chart pattern has emerged at the Silver in Daily charts.
The Broadening Tops is a significant reversal pattern that comprises three extending resistance trend lines.
Generally, the pattern is broken after 5 hits of the Resistance trend lines.
Generally, the price tries to continue in a bullish direction preceding the breakout.
Before breaking downwards, the price finishes only a partial uptrend.
We have observed that once the price has started retracement and is now expected to break the downward portion of the overall size of the megaphone.
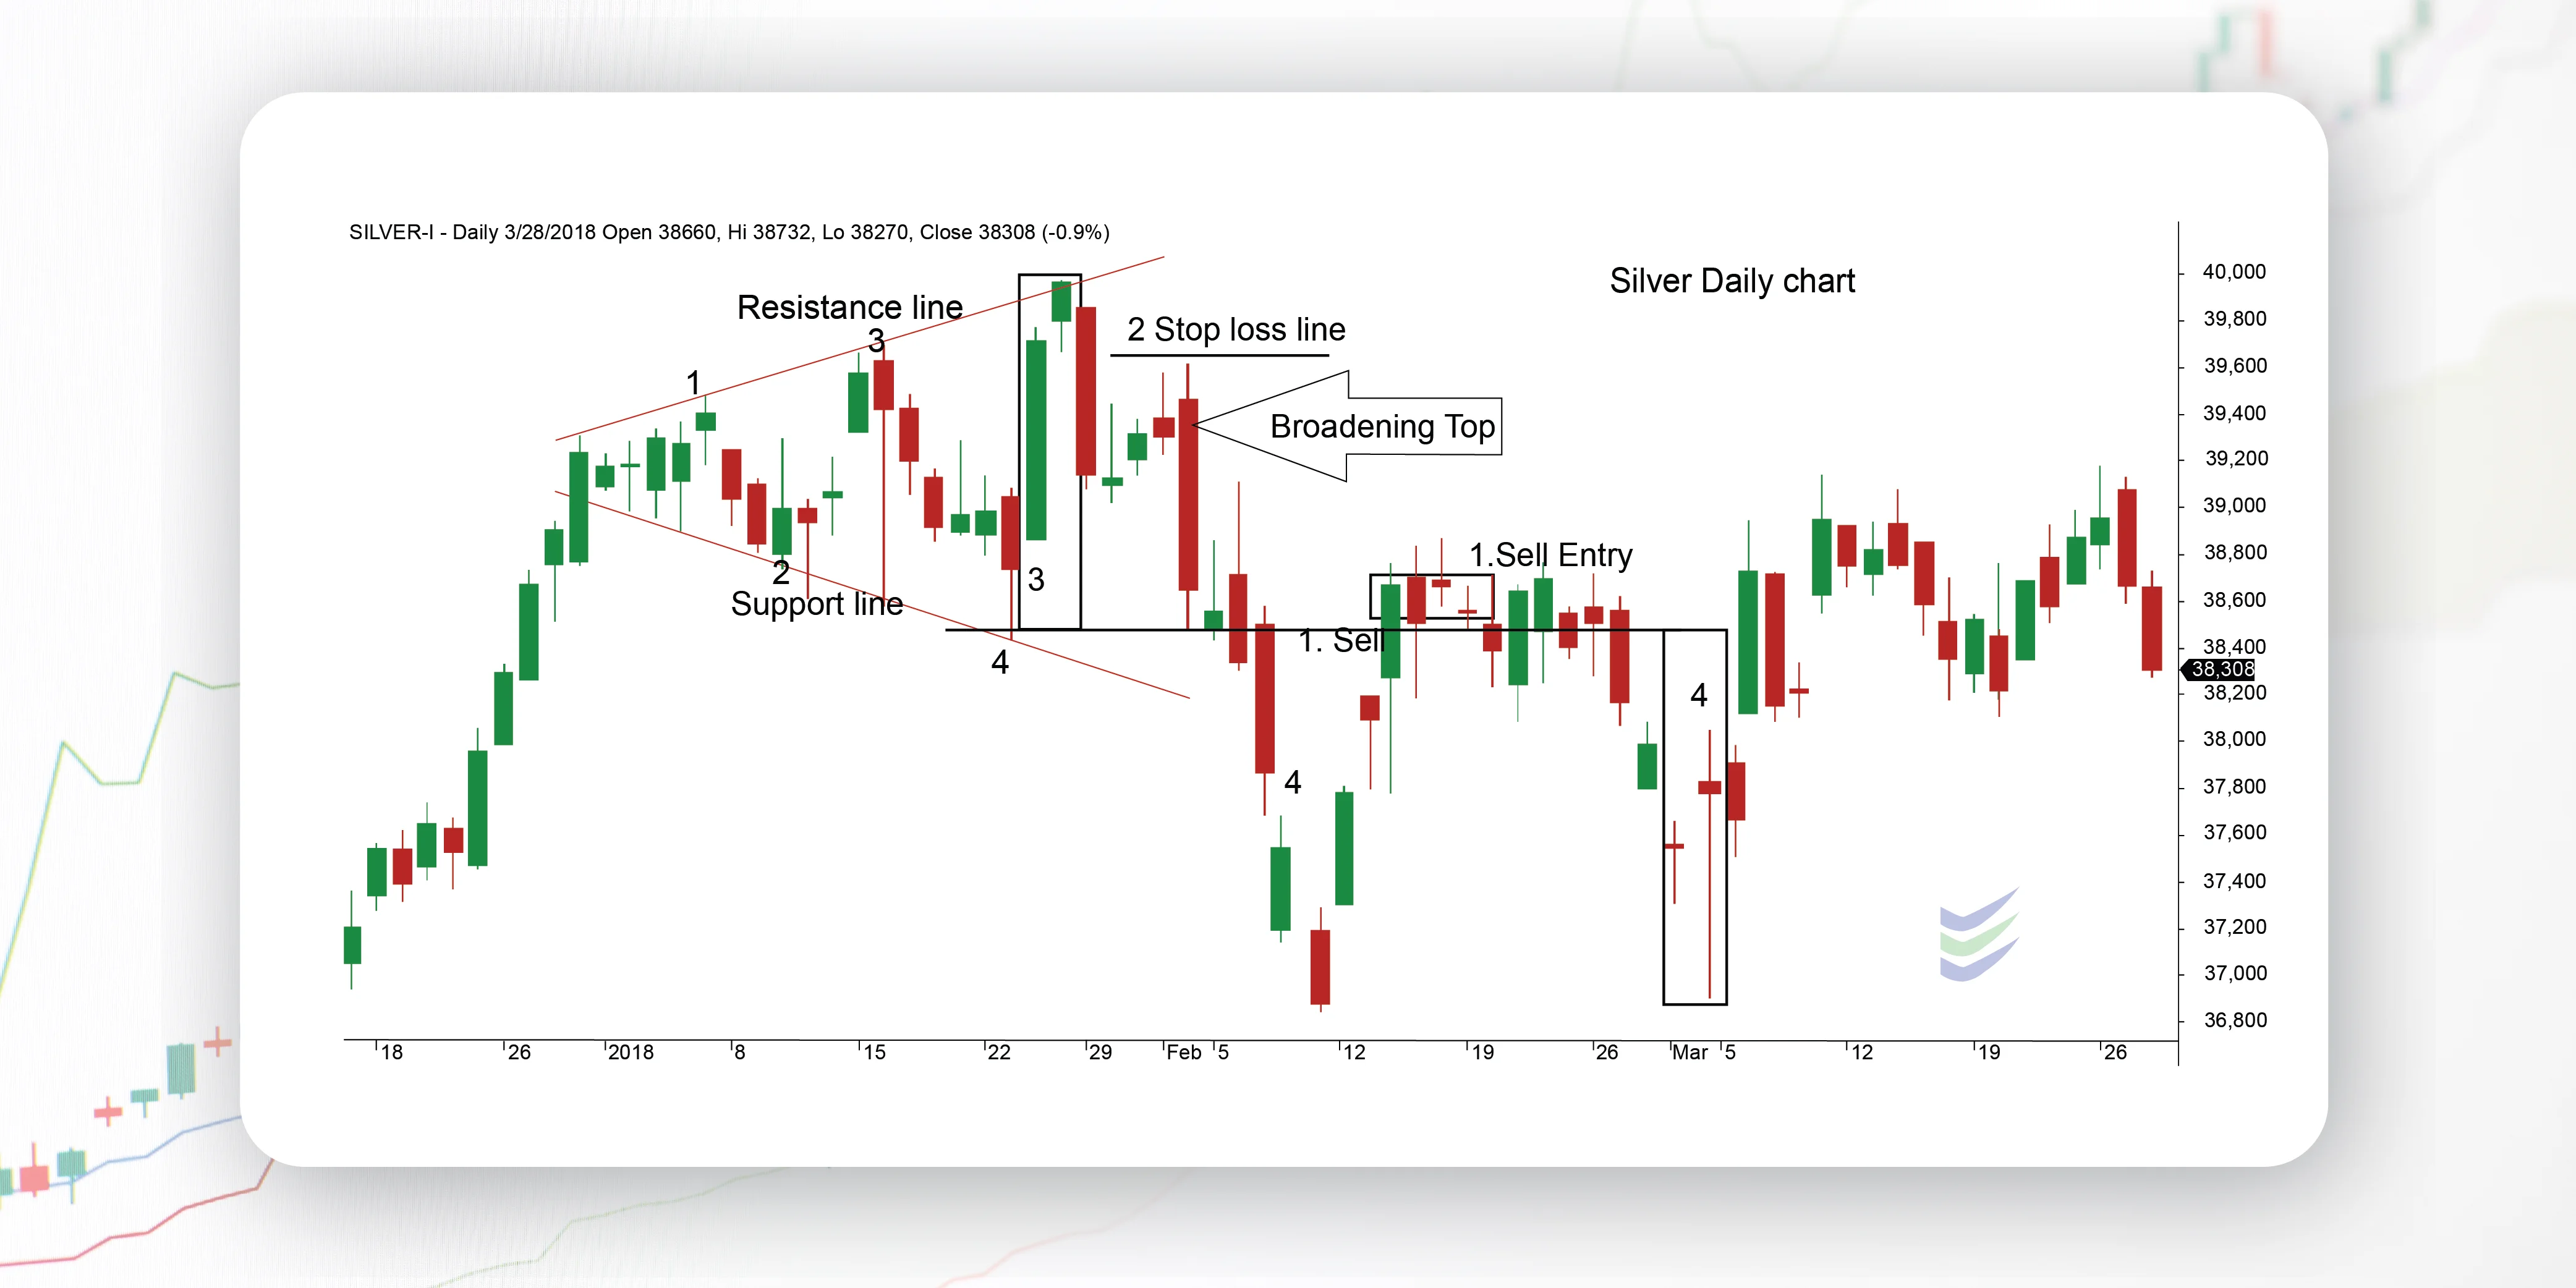
Strategy 2:
Wait for the price to rise below the broadening's lower trend line.
Enter your trade when the price rises below the broadening, slower trend line.
Once the support breaks, place a buy-order only after the price retests that trend line.
Now the broken support line will become the resistance line.
Place your stop loss above the new Resistance area.
Place your profit target.
Measure the size of the broadening pole. Place your profit target an equal distance above the broadening s breakout. (Entry of our trade)

Number 1: Pole of the pattern
Number 2: Area where the resistance line has turned into support
1. Sell entry, after the price, has bounced off the trend line
2. Stop loss underneath the new support area
3. Take profit distance (same height as pole number 1)
4. Take profit level
In a nutshell, the steps to consider when trading a Broadening Top
Identify the Pattern:
Confirm that a widening triangle pattern is forming by observing the diverging upper and lower trendlines and the widening shape on the price chart.
Understand the Prevailing Trend:
Determine the direction of the trend before the broadening triangle pattern emerges. If it's after an uptrend, it could indicate a potential bearish expanding triangle reversal; if it's after a downtrend, it might suggest a bullish expanding triangle reversal.
Wait for Confirmation:
Don't enter a trade solely based on the visual appearance of the expanding chart pattern. Wait for confirmation, typically in the form of a breakout.
For a bearish reversal, wait for the price to break below the lower trendline. For a bullish reversal, wait for a breakout above the upper trendline.
Volume Analysis:
Analyze trading volume during the broadening wedge pattern's formation. An increase in volume during the breakout can strengthen the validity of the pattern.
Set Stop-Loss and Take-Profit Levels:
Determine your risk tolerance and set a stop-loss order to limit potential losses. Identify potential target levels based on the widening channel pattern's projected move or other technical analysis tools.
Consider Market Context:
Evaluate the broader market context. Are there other technical indicators, support/resistance levels, or fundamental factors supporting the reversal signal?
Risk Management:
Implement proper risk management strategies, such as setting a risk-reward ratio and not risking more than a certain percentage of your trading capital on a single trade.
Monitor the Trade:
Keep a close eye on the trade as it develops. Pay attention to any signs of confirmation or invalidation.
Adapt to Market Conditions:
Be flexible and adapt your strategy based on how the market evolves. If conditions change, consider adjusting your trade or taking profits.
Review and Learn:
After the trade is complete, review the outcomes. Understand what worked well and what could be improved for future trades.
Frequently asked questions
How is a Broadening Top different from other chart patterns?
A Broadening Top is distinguished by its widening range, where the price alternates between higher highs and lower lows. It is different from consolidation patterns like triangles or rectangles.
Is the Broadening Top a reliable pattern?
While the Broadening Top is recognized as a reversal pattern, no pattern is infallible. Traders often use it in conjunction with other technical indicators and analysis tools to enhance reliability.
When is a Broadening Top pattern considered complete?
The pattern is considered complete when the price breaks below the lower trendline (for a bearish reversal) or above the upper trendline (for a bullish reversal). This breakout serves as confirmation of the potential reversal.
Can the Broadening Top pattern be a continuation pattern?
While the Broadening Top is typically a reversal pattern, it can be interpreted as a continuation pattern in certain situations. Traders consider the broader market context and other indicators for a more comprehensive analysis.
Can the Broadening Top pattern be applied to different timeframes?
Yes, the Broadening Top pattern can be observed on various timeframes, from intraday charts to daily and weekly charts. Traders may adjust their strategies based on the timeframe they are analyzing.
