Knowledge Center Technical Analysis
Reversal Patterns
Bearish Megaphone Pattern
Megaphone Pattern
The megaphone pattern is a pattern with a minimum of two higher highs and two lower lows forming a widening or expanding structure. Hence, this pattern is also called the expanding megaphone pattern. This pattern typically emerges during periods of high market volatility, reflecting traders' uncertainty regarding market direction. It is often observed at market tops or bottoms. The effectiveness of the pattern tends to improve with longer time frames, with traders showing a particular affinity for this pattern when it forms on a daily or weekly basis.
Bearish Megaphone Pattern
The bearish megaphone pattern forms a broadening or widening structure which occurs after an uptrend, also known as a broadening top, is a technical chart pattern that may indicate a potential reversal of an uptrend.This pattern is also called as ascending megaphone pattern or rising megaphone pattern.
How Does a Bearish Megaphone Pattern Look Like?
A bearish megaphone chart pattern is a technical chart pattern that typically indicates a potential reversal of an existing uptrend. It is characterized by a series of higher highs and lower lows, creating a widening or megaphone-like shape on the price chart. Here's how a bearish megaphone pattern looks:
Higher Highs: The pattern begins with a series of successively higher swing highs. Each new high is higher than the previous one, reflecting the ongoing strength of the uptrend.
Lower Lows: Simultaneously, the pattern forms a series of lower swing lows. Each new low is lower than the previous one, indicating increasing weakness in the market.
Widening Range: As the pattern unfolds, the range between the highs and lows gradually widens, creating the distinctive megaphone shape.
Volatility Increase: The widening range suggests growing market volatility and indecision among traders and investors. This could be due to conflicting opinions or uncertainties about the future direction of the asset's price.
Potential Reversal: The bearish megaphone pattern is often interpreted as a potential reversal signal, as the widening pattern implies that the uptrend may be losing momentum and that a reversal to the downside is becoming more likely.
Confirmation: Traders usually look for confirmation signals, such as a break below a support level or the formation of bearish candlestick patterns, to validate the bearish bias and make informed trading decisions.

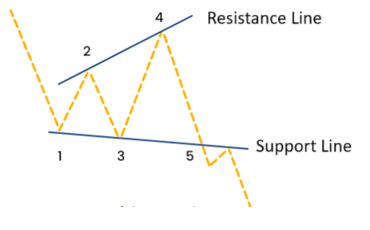
Where 2,4 represents – Higher highs
1,3,5 represents – Lower lows
How to identify the Bearish Megaphone Pattern?

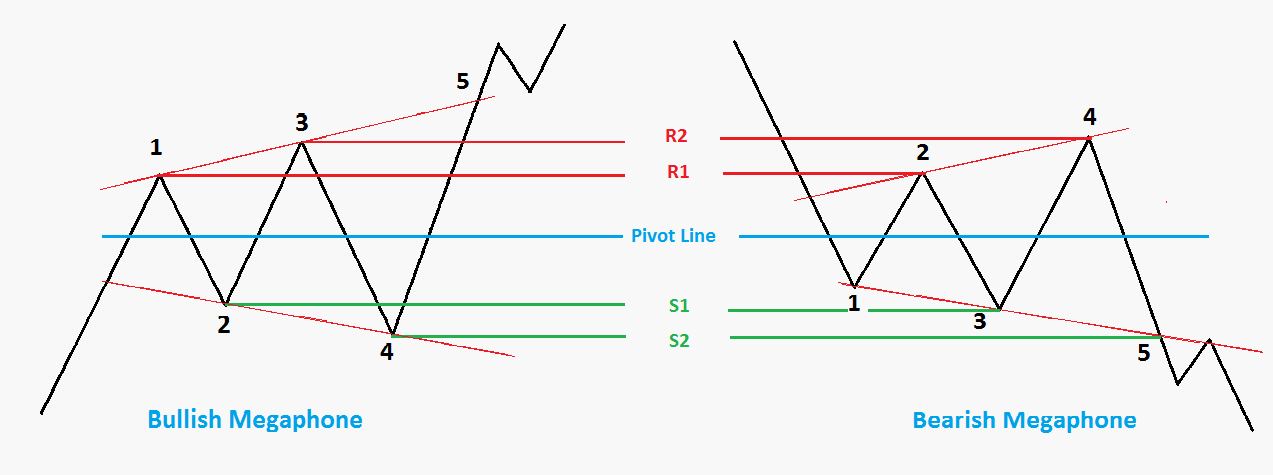
Generally, the Megaphone pattern will have minimum two higher highs and two lower lows. This pattern will form 5 swings.
-
Upper trendline is formed by joining two higher highs 2 and 4
-
Lower trendline is formed by joining two lower lows 1 and 3
-
These two lines create a shape that looks like a megaphone.
-
A pivot line is drawn from which pivot highs (R1, R2) and pivot lows (S1, S2) are marked.
-
R1, R2 – Resistance levels
-
S1, S2 – Support levels
-
A breakout occurs when the line does not respect its support or resistance line and closes outside the shape after making the 5th swing.
When Does a Bearish Megaphone Pattern Be Formed?
A bearish megaphone pattern typically forms in the following circumstances:
After an Uptrend:
The bearish megaphone pattern often appears after a prolonged uptrend in the market. The series of higher highs and lower lows indicates that the upward momentum may be losing strength.
Increased Volatility:
The pattern tends to emerge during periods of heightened market volatility. The widening range between the higher highs and lower lows reflects uncertainty and indecision among market participants.
Indecision and Changing Sentiment:
Traders and investors may become less certain about the direction of the market. The pattern is a visual representation of the tug-of-war between buyers and sellers, suggesting a potential shift in sentiment.
At Market Tops:
Bearish megaphone patterns are often associated with market tops, signalling a possible reversal from an uptrend to a downtrend.
Larger Time Frames:
While the pattern can occur on various time frames, it is generally considered more significant and reliable on larger time frames such as daily or weekly charts.
Volume Analysis:
Traders often pay attention to trading volume during the formation of the pattern. An increase in volume during the widening swings of the megaphone may provide confirmation of the pattern.
Confirmation Signals:
Confirmation is crucial when identifying a bearish megaphone pattern. Traders often wait for additional signals such as a break below a support level or the formation of bearish candlestick patterns to confirm the potential reversal.
What Does a Bearish Megaphone Pattern Indicate?
A bearish megaphone pattern indicates a potential reversal of an existing uptrend in the market. This pattern is characterized by a series of higher highs and lower lows, forming a widening or megaphone-like shape on the price chart. Here's what a bearish megaphone pattern suggests:
Loss of Uptrend Momentum:
The bearish megaphone pattern signals that the uptrend in the market may be losing strength. The series of higher highs suggests ongoing bullish momentum, but the lower lows indicate increasing weakness and potential exhaustion.
Market Indecision:
The widening range between higher highs and lower lows reflects a period of increased indecision among traders and investors. The market participants are uncertain about the future direction, leading to a broadening megaphone pattern.
Potential Reversal:
The primary implication of the bearish megaphone pattern is a potential reversal from an uptrend to a downtrend. The widening shape suggests that the bullish trend is becoming unstable, and there is an increasing likelihood of a shift in sentiment.
Heightened Volatility:
The pattern is often associated with increased volatility in the market. The widening swings indicate larger price fluctuations and a less predictable environment.
Caution for Long Positions:
Traders who are holding long positions may take the bearish megaphone pattern as a warning sign to exercise caution. It suggests that the market conditions are becoming less favourable for continued upward movement.
Confirmation Signals:
Confirmation is crucial when interpreting the bearish megaphone pattern. Traders often wait for additional signals, such as a break below a support level or the formation of bearish candlestick patterns, to validate the potential reversal.
Potential Price Targets:
Some traders use the height of the megaphone pattern to estimate potential price targets for the reversal. This involves measuring the distance from the highest high to the lowest low within the pattern and projecting that downward from the breakout point.
How To Trade When You See a Bearish Megaphone Pattern?
A bearish megaphone pattern trading involves careful analysis and the use of additional technical indicators to confirm the potential reversal. Here's a step-by-step guide on how to approach trading when you identify a bearish megaphone pattern:
Identify the Bearish Megaphone Pattern:
Confirm that the price chart exhibits a series of higher highs and lower lows, forming a widening or megaphone-like pattern.
Time Frame Analysis:
Check the time frame on which the pattern is forming. While the pattern can occur on various time frames, it is generally considered more significant on larger time frames like daily or weekly charts.
Volume Confirmation:
Pay attention to trading volume during the formation of the pattern. An increase in volume, especially during the widening swings, can provide confirmation of the pattern.
Wait for Confirmation Signals:
Avoid making impulsive decisions based solely on the pattern. Wait for confirmation signals such as a clear break below a support level or the formation of bearish candlestick patterns.
Support and Resistance Levels:
Identify key support levels within the pattern. A break below these levels could act as confirmation of the potential reversal.
Risk Management:
Determine your risk tolerance and set stop-loss orders to manage potential losses. Consider the distance from the entry point to the stop-loss level based on the pattern's structure.
Consider Additional Indicators:
Use other technical indicators such as moving averages, RSI (Relative Strength Index), or MACD (Moving Average Convergence Divergence) to corroborate the bearish signals from the megaphone pattern.
Potential Price Targets:
If the pattern is confirmed, use the height of the megaphone pattern to estimate potential price targets for the reversal. This involves measuring the distance from the highest high to the lowest low within the pattern and projecting that downward from the breakout point.
Stay Informed:
Be aware of any upcoming economic events, news releases, or external factors that could influence the market. These factors may impact the success of the trade.
Adapt to Market Conditions:
Be flexible in your trading strategy and adapt to changing market conditions. If the pattern fails to play out as expected, be prepared to reassess and adjust your approach.
Trading Strategy
Example -1

-
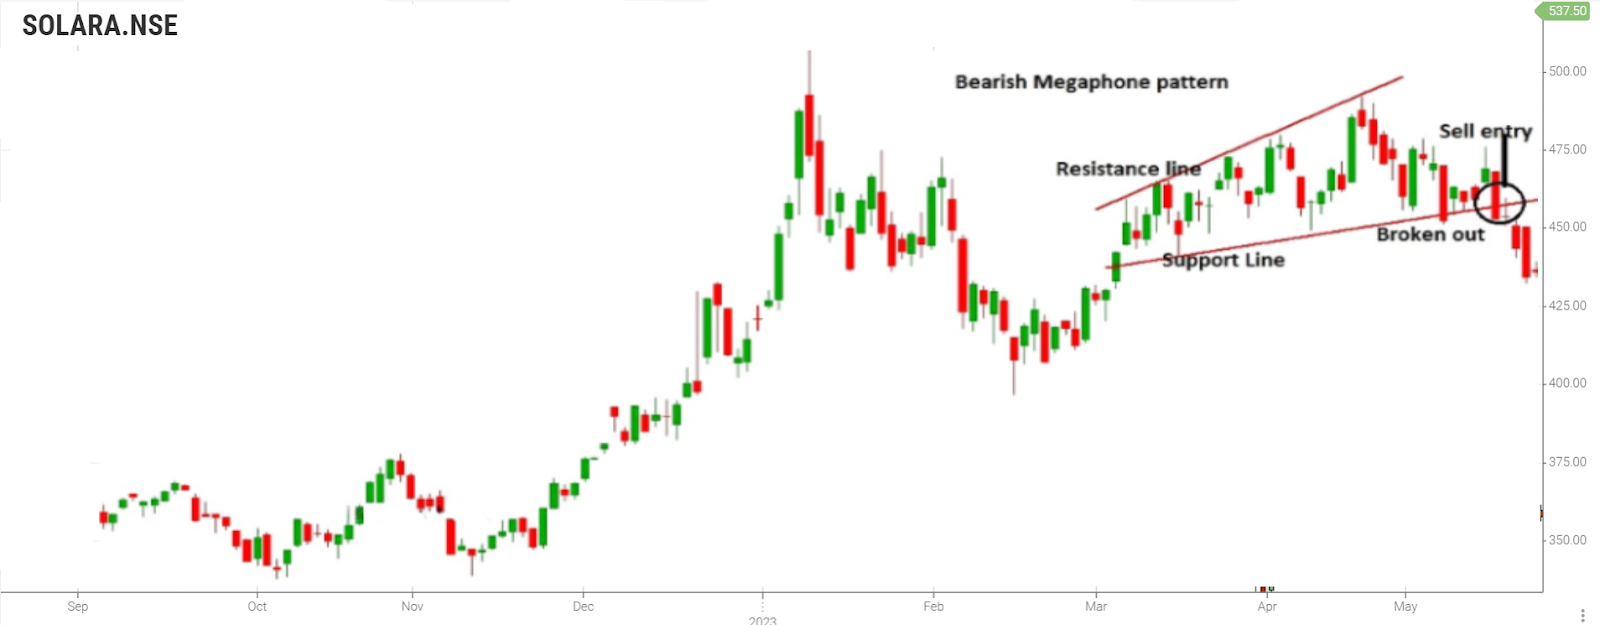
A bearish megaphone pattern has been identified in the above chart.
-
Higher highs and lower lows have been identified
-
Resistance and Support lines are marked.
-
The pattern continues to be bullish up to breakout, after which a bearish reversal pattern occurs.
-
The pattern is expected to break the megaphone pattern after the breakout point and the price has started to make limited retracement.
-
Sell order is placed after the breakout.
Example -2

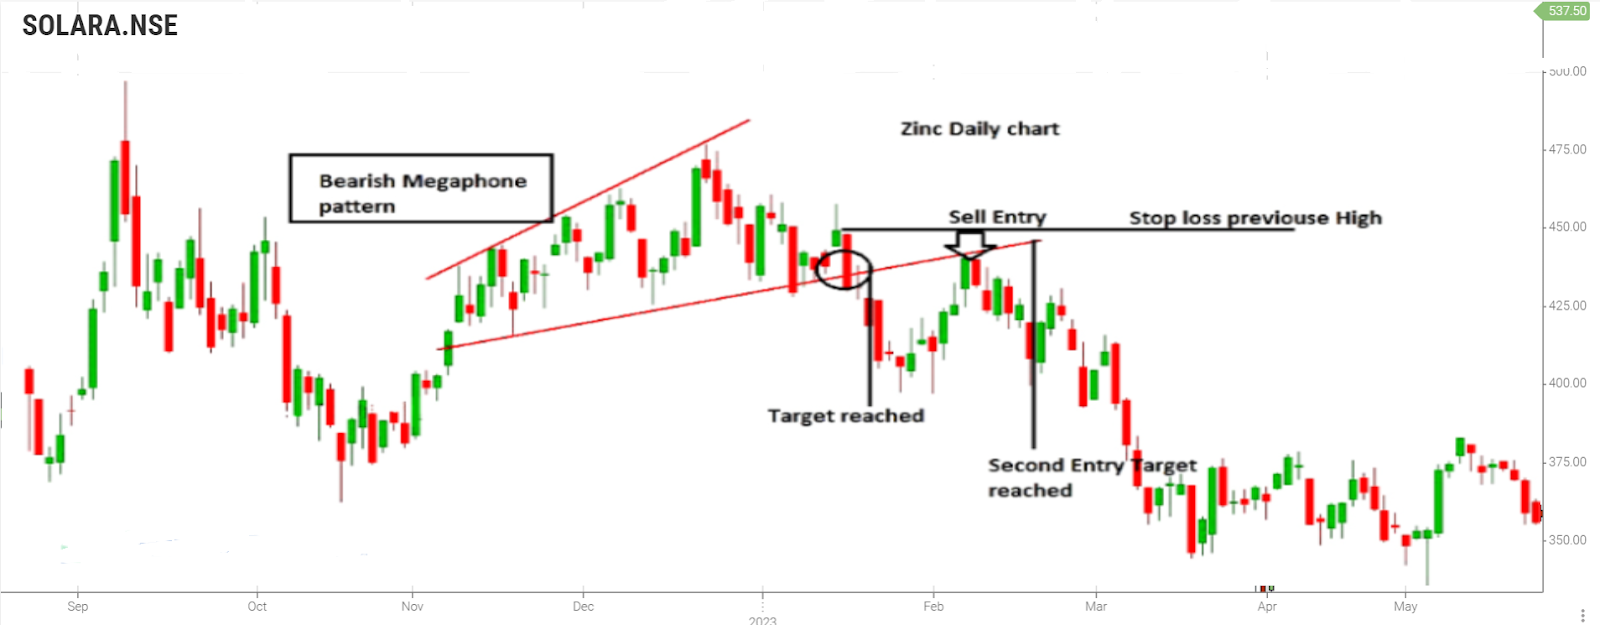
Bearish megaphone pattern is identified.
Sell order is placed after breakout in the support level.
The pattern continues to be bullish up to breakout, after which a bearish reversal pattern occurs.
The pattern is expected to break the megaphone pattern after the breakout point and the price has started to make limited retracement.
After breakout, the previous support level will be the new resistance level. Now, place a new stop loss order at a price above the new resistance level.
Second Sell order is placed after the breakout.
Frequently Asked Questions
Are There Variations of the Bearish Megaphone Pattern?
Yes, variations include rising wedges within the megaphone and different degrees of slope on trendlines. Each variation may provide additional insights into potential price movements.
Can the Bearish Megaphone Pattern Signal Continuation Patterns?
While the Bearish Megaphone is generally associated with potential reversals, it can also be part of a complex correction or continuation pattern. Traders should analyze broader market trends for confirmation.
What is a megaphone top pattern?
The Megaphone Top pattern, or Broadening Top, is characterized by diverging trendlines, indicating increased market volatility and potential trend reversal.
What is a bullish megaphone pattern?
The Bullish Megaphone Pattern is characterized by diverging trend lines with higher highs and lower lows, indicating increased market volatility and potential upward price reversal.
What is a megaphone pattern?
The Megaphone Pattern, also known as a Broadening Top or Megaphone Top, is a technical chart pattern characterized by diverging trendlines, with higher highs and lower lows, forming a widening price range.
