Knowledge Center Technical Analysis
Reversal Patterns
Rounding Bottom Chart Pattern
What is a rounding bottom pattern?
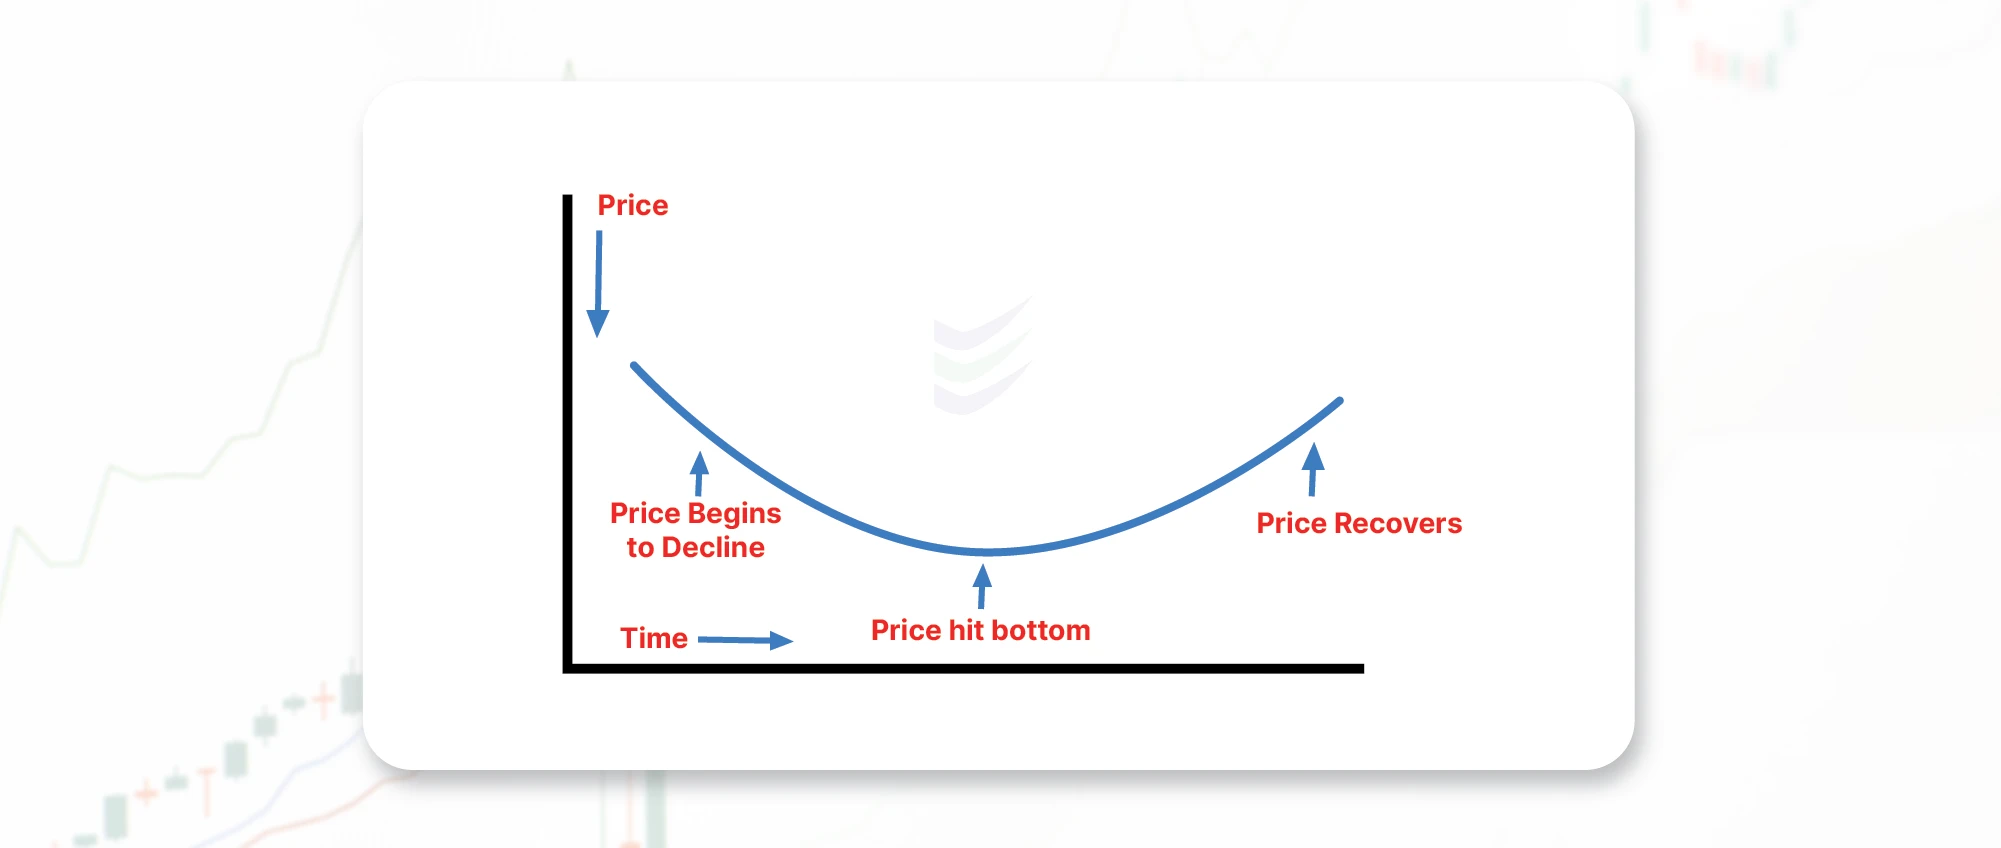
The rounded bottom pattern, also known as a saucer bottom or a U-bottom.
It is a technical analysis pattern used in financial markets especially in penny stocks because their prices are highly volatile, making it easy for traders to spot these patterns more easily and also to identify potential reversal points in a downtrend.
This pattern is typically observed on price charts and is characterized by a gradual and rounded curvature at the bottom of a price decline, resembling the shape of a bowl or saucer.
The pattern signals that the existing downtrend is about to finish and the possibility of an uptrend to commence.
This creates an opportunity to go long.
The price movement would be towards downside before stabilizing for a long time and formation of rounded bottom. Sooner or later, the price rises back above the neckline of the stabilized area. The pattern finishes at this point.
How does a Rounding Bottom Chart pattern look like?
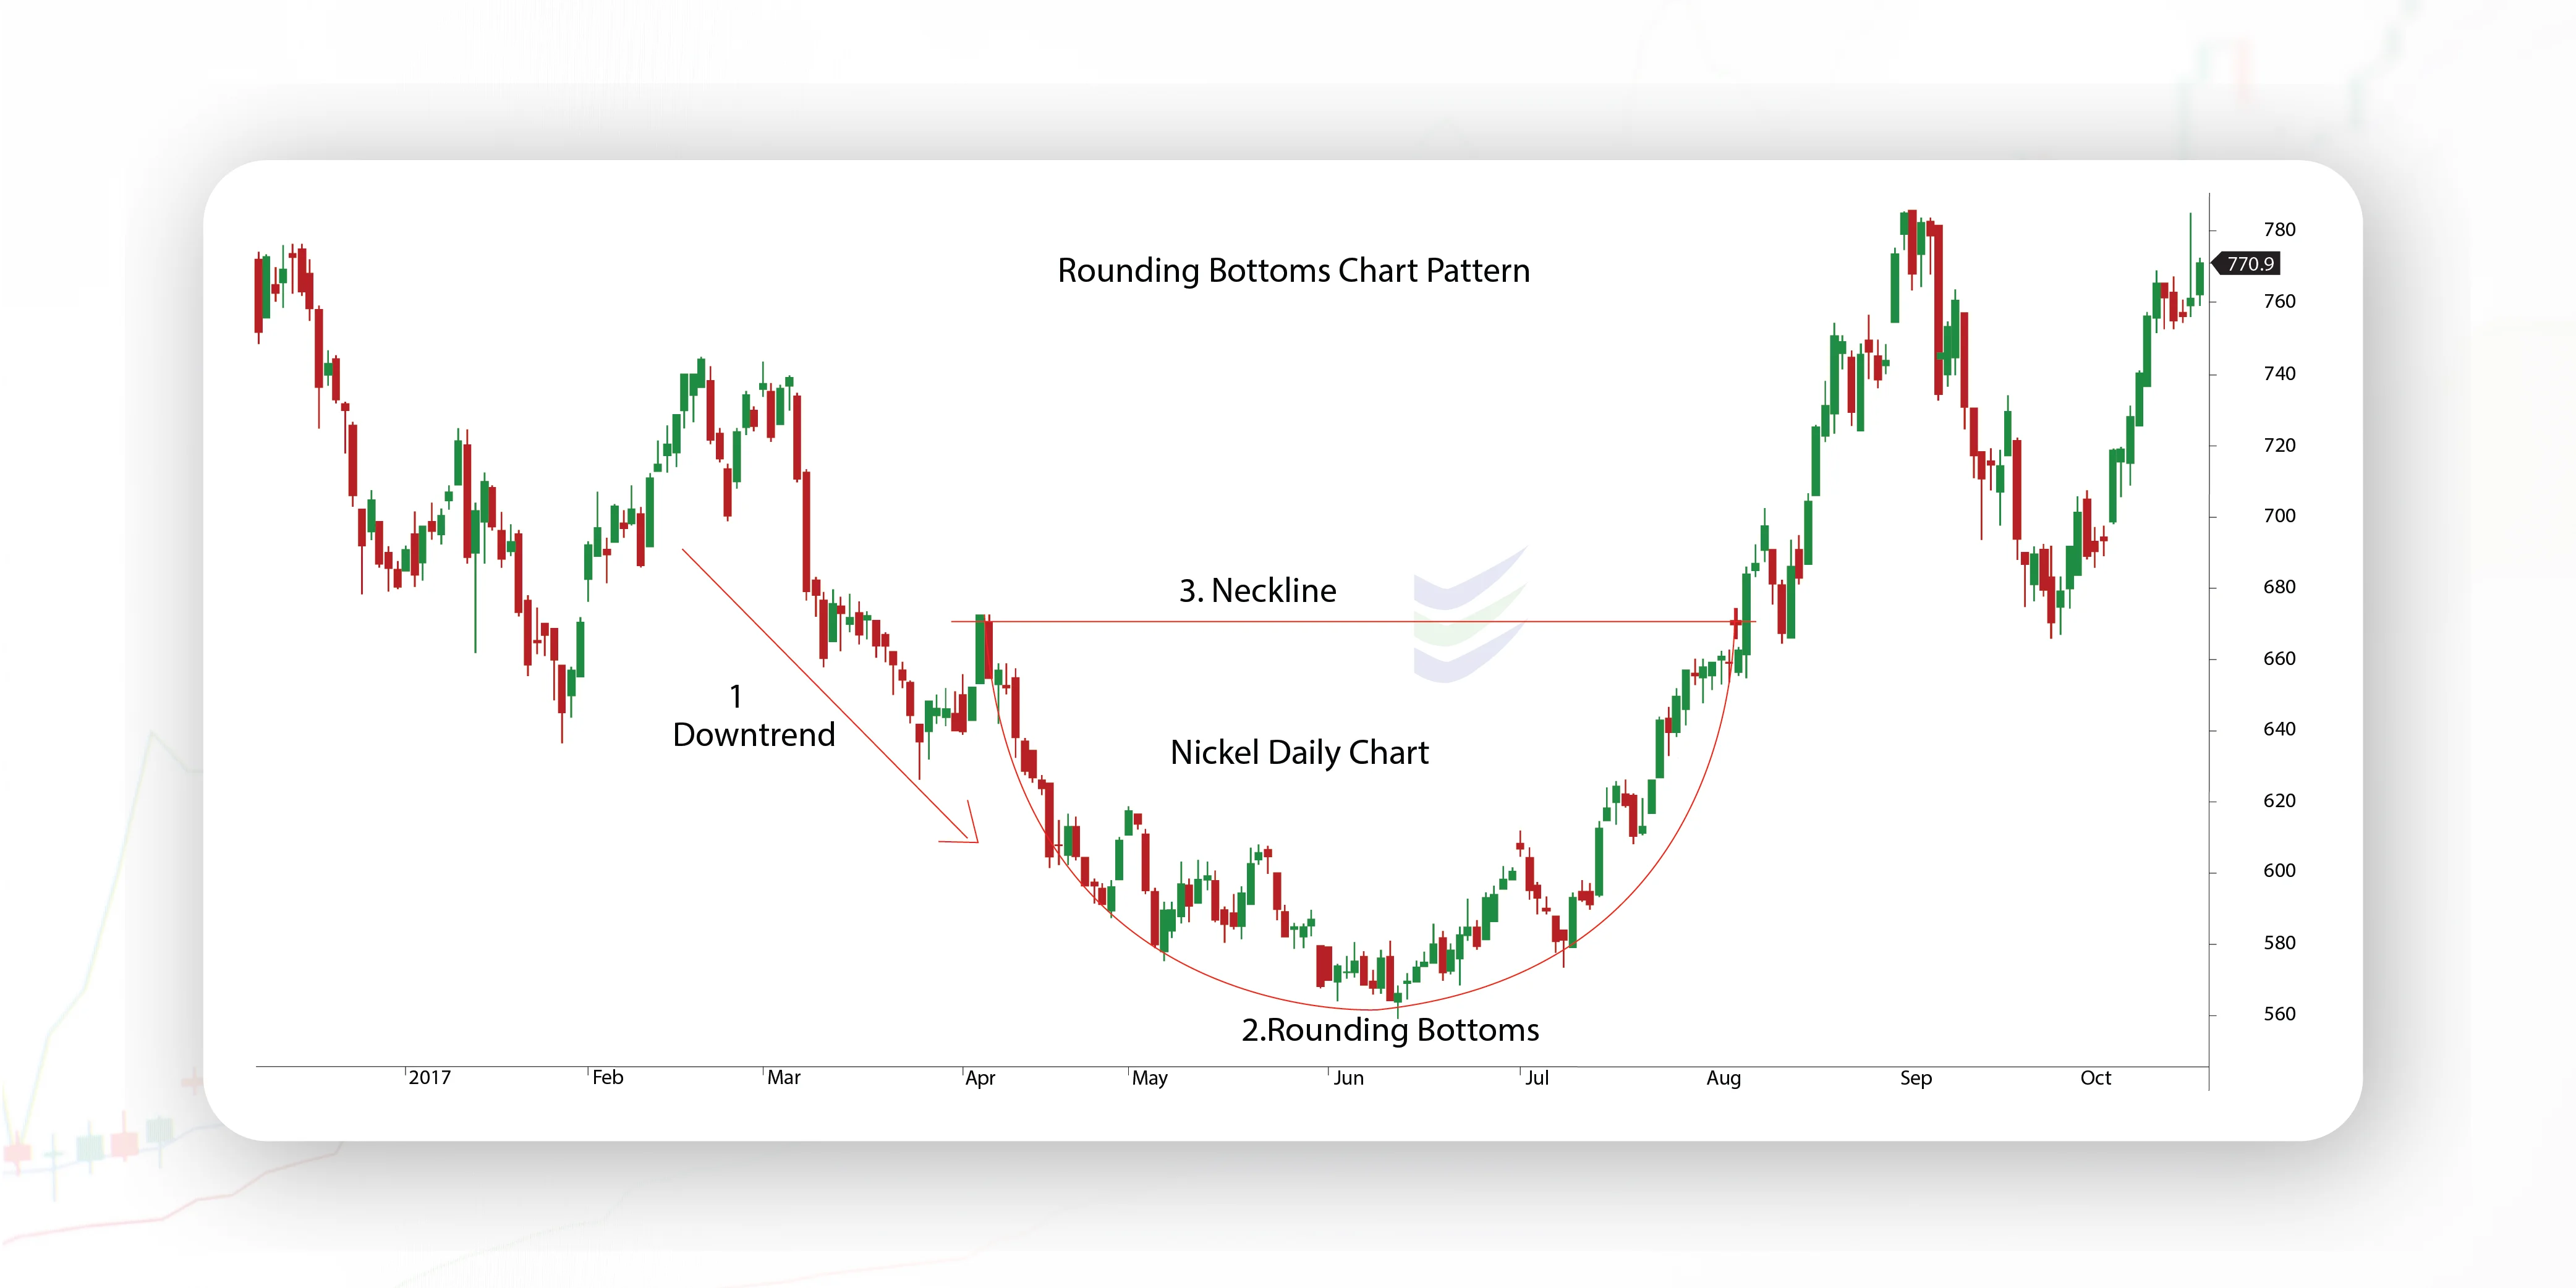
A rounding bottom chart pattern has a distinctive appearance, resembling the shape of a bowl or saucer. Here's a description of how it looks:
Downtrend: The pattern begins with a sustained downtrend in the price of an asset or security.
Rounded Curve: As the downtrend continues, the price levels off and starts forming a gentle, rounded curve. This curve should be relatively smooth and gradual, creating the saucer-like appearance.
Support Line: At the lowest point of the rounding bottom, there is a support line that marks the lowest price reached during the pattern formation. This support line is typically horizontal or slopes slightly upward.
Resistance Line: The resistance line is drawn at the highest point of the saucer's curve. It represents a level where the price had difficulty breaking above during the formation of the pattern. The resistance line is also typically horizontal or slopes slightly downward.
Volume: Volume tends to decrease as the rounding bottom pattern forms, indicating a decrease in selling pressure. This reduction in volume suggests that the bears (sellers) are losing their grip on the market.
Breakout: The pattern is considered complete when the price breaks above the resistance line. This rounding bottom pattern breakout signals a potential reversal of the previous downtrend and may lead to a new uptrend.
In this representation, the left side of the pattern represents the downtrend, the middle portion is the rounded curve, and the right side shows the breakout above the resistance line.
When does a Rounding Bottom Chart pattern is formed?
A rounding bottom chart pattern forms in several distinct stages, and understanding these stages in detail can help you recognize and confirm the pattern effectively. Here's a more detailed breakdown of when and how a rounding bottom pattern typically forms:
Downtrend Phase: The formation of a rounding bottom pattern begins with a significant and sustained downtrend in the price of an asset. This downtrend can last for an extended period, often characterized by lower lows and lower highs on the price chart. The market sentiment is generally bearish during this phase.
Accumulation Phase: As the downtrend continues, a transition takes place. During this phase, buyers slowly start to accumulate the asset at lower prices. This accumulation can be driven by a variety of factors, such as improving fundamentals, positive news, or a shift in market sentiment.
Flattening Out: The most recognizable feature of a rounding bottom is the gradual flattening out of the price movement. Instead of sharp declines, the price starts to level off and form a smooth, rounded curve. This curve is often described as resembling the shape of a saucer or a bowl. The flattening out indicates that the selling pressure is diminishing, and buyers are becoming more active.
Decreasing Volume: As the rounding bottom takes shape, trading volume tends to decrease. This decline in volume suggests that the intense selling pressure seen during the downtrend is waning, and the market is stabilizing. Lower volume reflects reduced investor interest in selling the asset at lower prices.
Support and Resistance Levels: During the formation of the pattern, traders often identify two critical levels. The first is the support level, which is the lowest point reached during the pattern's formation. The second is the resistance level, located at the highest point of the rounded curve. These levels help define the pattern's boundaries.
Confirmation through Breakout: The rounding bottom pattern is considered complete when the price breaks above the resistance level. This breakout is a crucial signal, indicating a potential reversal of the previous downtrend. The breakout should ideally be accompanied by an increase in trading volume, confirming the strength of the new uptrend.
Price Target Projection: Some traders use the height of the rounding bottom pattern (the distance between the support and resistance levels) to estimate a potential price of the rounding bottom pattern target for the asset's upward movement after the breakout. They project this height upward from the breakout point to anticipate where the price might go.
What does a Rounding Bottom Chart pattern indicate?
A rounding bottom chart pattern indicates a potential reversal of a prior downtrend and can provide traders and investors with valuable information about market sentiment and potential price movements. Here's a detailed explanation of what a rounding bottom chart pattern indicates:
Reversal of Downtrend: The primary indication of a rounding bottom pattern is that it signifies a potential reversal of a prolonged downtrend. It suggests that the bearish sentiment that drove the price down is diminishing, and bullish sentiment is gradually taking hold. This can be a sign that the worst of the selling pressure may be over.
Shift in Market Sentiment: As the price flattens and forms the characteristic saucer-like curve, it signals a shift in market sentiment from bearish to neutral and eventually bullish. Traders and investors start to see value in the asset at lower prices, leading to increased buying interest.
Accumulation Phase: The flattening of the price curve indicates an accumulation phase where informed investors and institutions are steadily buying the asset. This accumulation often occurs as market participants recognize improving fundamentals, positive news, or other factors that suggest the asset is undervalued.
Diminished Selling Pressure: Decreasing trading volume during the formation of the rounding bottom reflects a decline in selling pressure. Sellers become less aggressive, and the asset's price stabilizes. This can be seen as a sign that sellers are exhausted and that buyers may soon take control.
Confirmation of Reversal: The rounding bottom pattern is confirmed when the price breaks above the resistance level, which is typically the highest point of the saucer's curve. This breakout is a key signal that the sentiment has shifted decisively from bearish to bullish, and it often occurs with increased trading volume. Traders look for confirmation through price action and volume to validate the pattern.
Potential Price Target: Traders may use the height of the rounding bottom pattern (the distance between the support and resistance levels) to estimate a potential price target for the upward move following the breakout. This target can help set expectations for the potential price increase, but it's not a guarantee.
Timing and Patience: It's important to note that the formation of a rounding bottom pattern can take time, often weeks or months, depending on the timeframe of the chart being analysed. Traders need to exercise patience and wait for the pattern to complete and confirm before taking trading positions.
Risk Management: While a rounding bottom can indicate a potential reversal, it's not a foolproof signal, and false breakouts can occur. Risk management strategies, such as setting stop-loss orders and diversifying portfolios, are essential to protect against adverse price movements.
How to trade when you see a Rounding Bottom Chart pattern?
Trading when you see a rounding bottom chart pattern involves a structured approach that combines pattern recognition with risk management. Let’s analyze the round bottom chart pattern with the help of a chart.
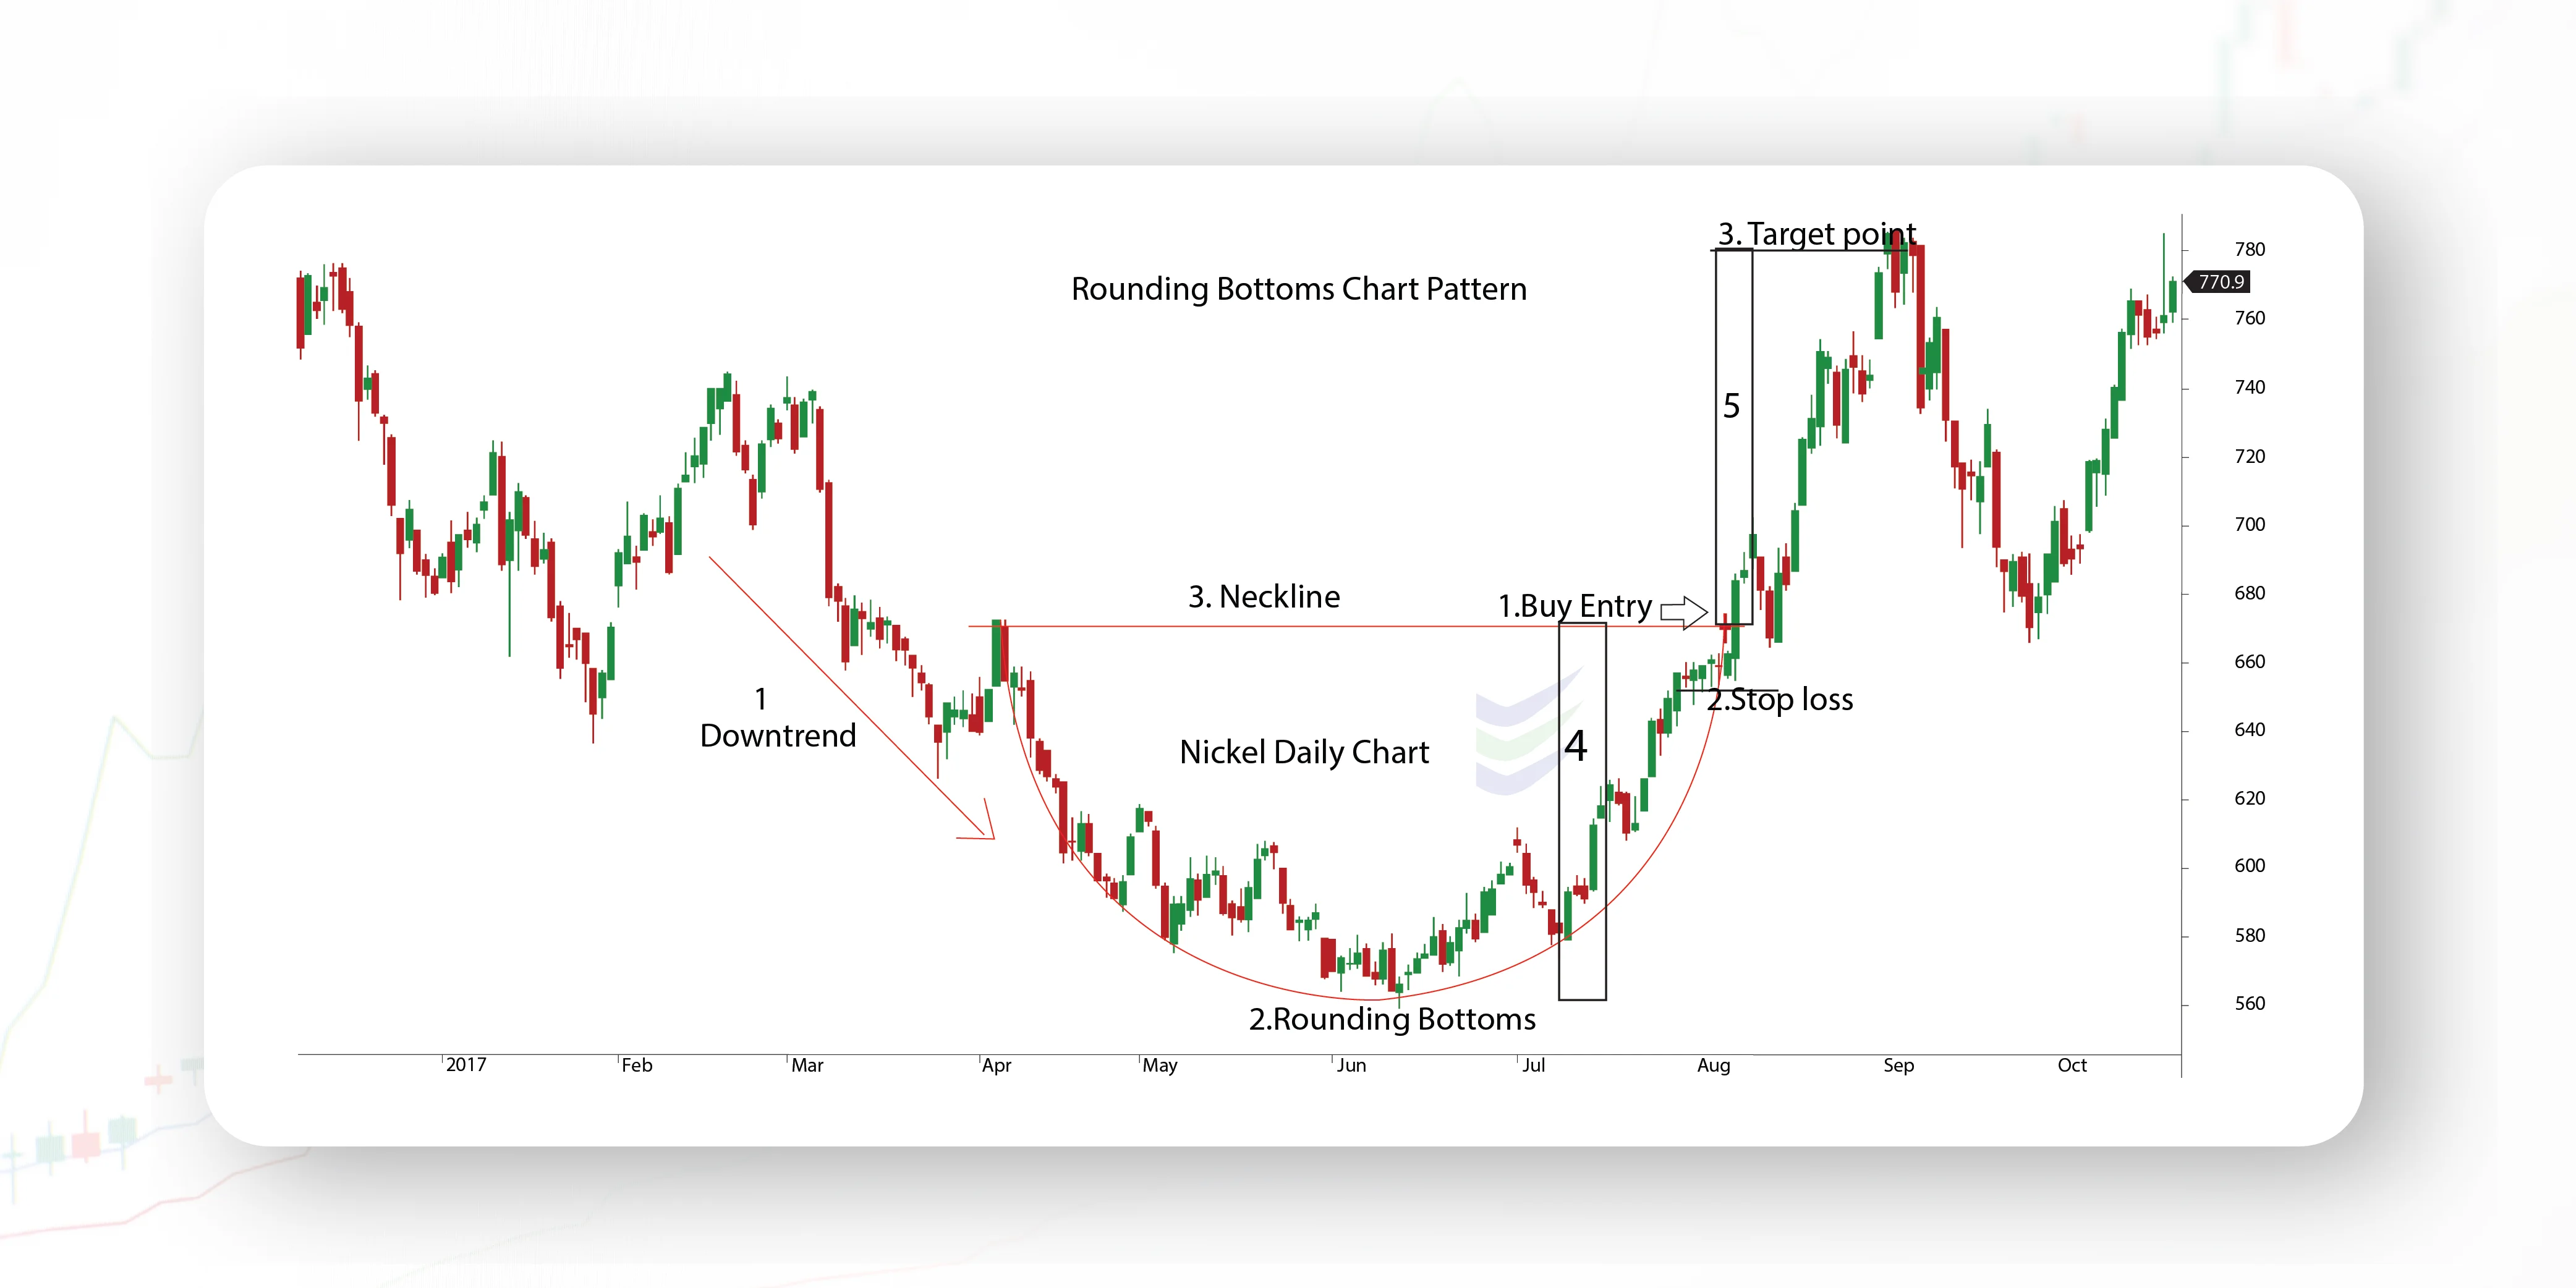
Description of the Rounding Bottom Channel pattern
1 – Long Buy Entry
2 – Stop loss order will be executed
3 – Take Profit
4 - Height of the actual pattern
5 - Profit Target Distance (same distance as 4)
Here's a step-by-step guide on how to trade when you identify a rounding bottom pattern:
Confirm the Pattern: Ensure that the rounding bottom pattern meets the necessary criteria: a sustained downtrend, a smooth and rounded curve, decreasing volume, and a breakout above the resistance level.
Determine the Trade Direction: A rounding bottom indicates a potential reversal from a downtrend to an uptrend. Therefore, you should consider taking a long (buy) position.
Entry Point: Wait for confirmation of the breakout above the resistance level. This confirmation typically includes a candlestick closing above the resistance, preferably with strong volume.
Set a Stop-Loss: Always use a stop-loss order to limit potential losses. Determine a level where you would exit the trade if the price moves against you. This level is usually set just below the breakout point or a nearby support level.
Establish a Price Target: Calculate a price target based on the height of the rounding bottom pattern (the distance between the support and resistance levels). Project this distance upward from the breakout point. This provides an estimate of where the price may reach, but it's not a guarantee.
Risk-Reward Ratio: Evaluate the risk-reward ratio of the trade. Ensure that the potential reward (distance to the price target) justifies the risk (distance to the stop-loss). A favourable risk-reward ratio is typically 2:1 or better.
Position Size: Determine the size of your position based on your risk tolerance and the size of your trading account. Avoid overleveraging, as it can lead to significant losses.
Monitor the Trade: Keep a close eye on the trade as it progresses. Watch for signs of continued upward momentum and potential resistance levels where the price may stall.
Partial Profit-Taking: Consider taking partial profits as the price approaches your price target. This locks in some gains and reduces risk.
Trailing Stop: Once the price has moved in your favour, you can use a trailing stop-loss to protect profits. This means adjusting your stop-loss upward as the price rises to lock in gains while giving the trade room to breathe.
Exit Strategy: Have a clear exit strategy in place. If the price reaches your price target and shows signs of stalling or reversing, consider closing the trade to secure your profits.
Adapt to Market Conditions: Be flexible and adapt to changing market conditions. Not all rounding bottom patterns lead to successful reversals, so be prepared to exit the trade if the market sentiment turns bearish again.
Keep Learning: Continuously improve your trading skills and knowledge. Learn from both successful and unsuccessful trades to refine your trading strategy.
Frequently asked questions
Can rounding bottom patterns fail to reverse the trend?
Yes, like all technical patterns, rounding bottom patterns can fail, resulting in false signals. It's essential to use other technical indicators and analysis tools for confirmation and risk management.
Are there variations of the rounding bottom pattern?
Yes, variations include asymmetrical rounding bottoms (with unequal sides), inverted rounding bottoms pattern (inverted saucer shape, indicating a potential bearish reversal), and extended rounding bottoms (prolonged pattern formation).
How long does it take for a rounding bottom pattern to form?
The duration of a rounding bottom pattern can vary widely, from weeks to several months, depending on the timeframe of the chart being analysed.
Can rounding bottom patterns be applied to different timeframes?
Yes, rounding bottom patterns can be observed on various timeframes, such as daily, weekly, or intraday charts, making them applicable to different trading styles.
what is rounding bottom pattern stocks?
These are stocks that follow downtrend with a prolonged decline.When the stock price stabilizes , it forms a rounded bottom.These stocks have Bullish trend potential as price breaks above resistance.
What is the double rounding bottom pattern in short?
A "double rounding bottom" pattern typically refers to a chart pattern where a security or asset forms two rounded or saucer-like bottoms within a longer-term downtrend, suggesting the possibility of two potential trend reversals within the broader downtrend. It's not a standard pattern in traditional technical analysis but may be used informally to describe such formations.