Knowledge Center Technical Analysis
Reversal Patterns
The Bullish Megaphone Chart Pattern
The bullish megaphone chart pattern, also known as the rising megaphone pattern or reverse symmetrical triangle, is a key technical analysis pattern frequently observed in financial asset charts. This pattern stands in contrast to its bearish counterpart and is known for signaling a potential reversal of a downtrend.
Pattern Characteristics:
-
Diverging Trend Lines: The bullish megaphone pattern is recognized by two sloping trend lines. One trend line ascends while the other descends, creating a divergence between them.
-
Widening Price Range: The hallmark of this pattern is the widening range of price movement over time. It is formed as the asset's price action records higher highs and lower lows within the pattern.
Pattern Formation:
As the bullish megaphone pattern takes shape, the asset experiences a sequence of higher highs and lower lows, resulting in an expansion of price volatility. This volatility is a key indicator of a potential trend reversal. Importantly, the pattern often involves the formation of higher lows, reflecting growing buying pressure in the market.
Price swings within the pattern become notably more volatile, leading to larger price fluctuations in both upward and downward directions. This dynamic reflects the uncertainty and tug-of-war between buyers and sellers.
Pattern Completion:
The bullish megaphone pattern typically reaches its culmination when the asset's price breaks above the upper trend line. This breakout serves as a confirmation of the anticipated bullish reversal.
Trading Significance:
The bullish megaphone pattern is esteemed as a robust bullish signal. It implies that the underlying asset may be poised for a substantial uptrend. Traders and investors often leverage this pattern to identify potential buying opportunities in the market.
Important points to be considered
While the bullish megaphone pattern holds promise, it's vital to exercise caution and consider other factors before making investment decisions. Market fundamentals and economic indicators should be taken into account to supplement the technical analysis provided by this pattern.
Trading Strategies:
The bullish megaphone trading pattern entails employing a comprehensive strategy. While it signifies a potential reversal of a downtrend, it can be challenging to navigate due to the existence of false signals. Traders often utilize basic price levels for setting stop-loss orders, entering positions, and defining targets. Additionally, other technical triggers like divergence, trend lines, and the megaphone pattern itself can serve as valuable entry points for trades.
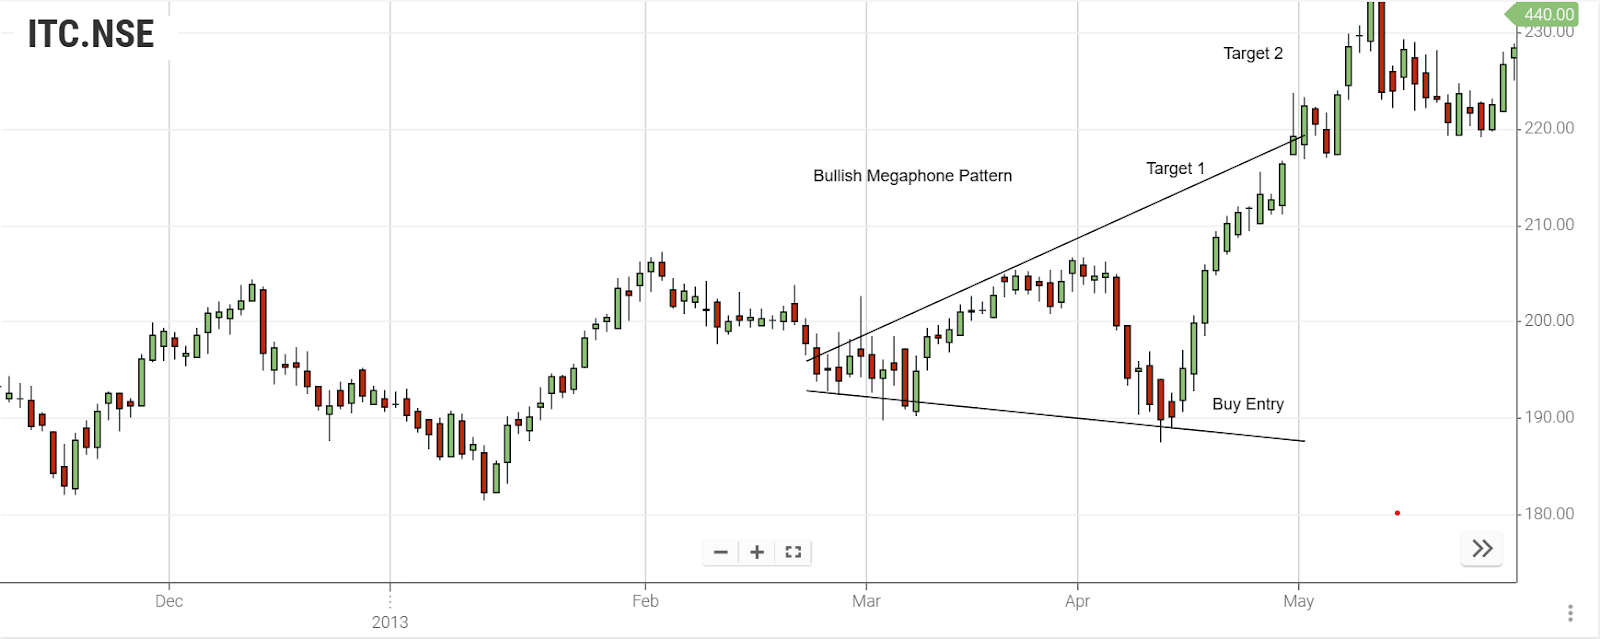
Trading Strategy Method 1
-
ITC daily chart reveals a bullish megaphone pattern, hinting at a possible upward breakout.
-
The anticipated breakout level is at 220, a crucial point for traders to monitor.
-
Consider initiating trades at the lower trend line of the Megaphone for strong support.
-
Validation of the pattern comes from the Fibonacci retracement, boosting confidence in the upward breakout opportunity.
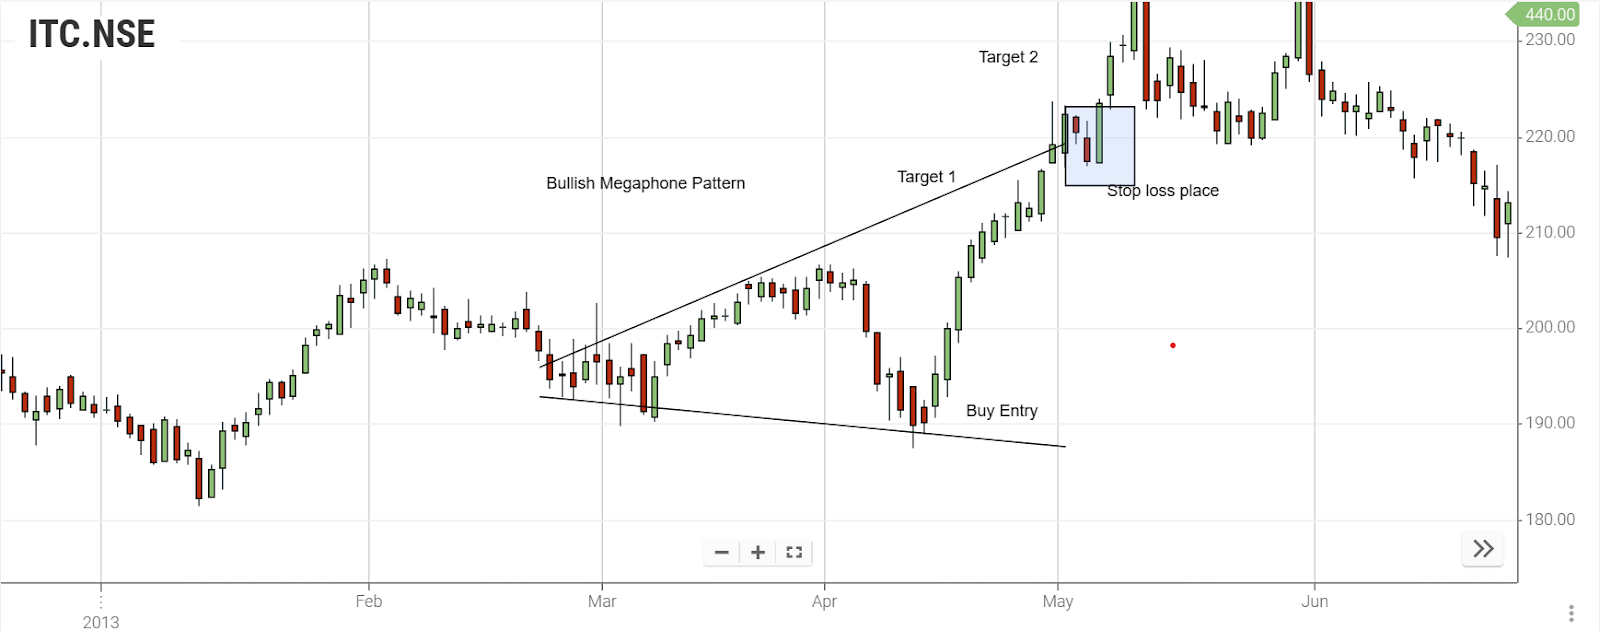
Trading Strategy Method 2
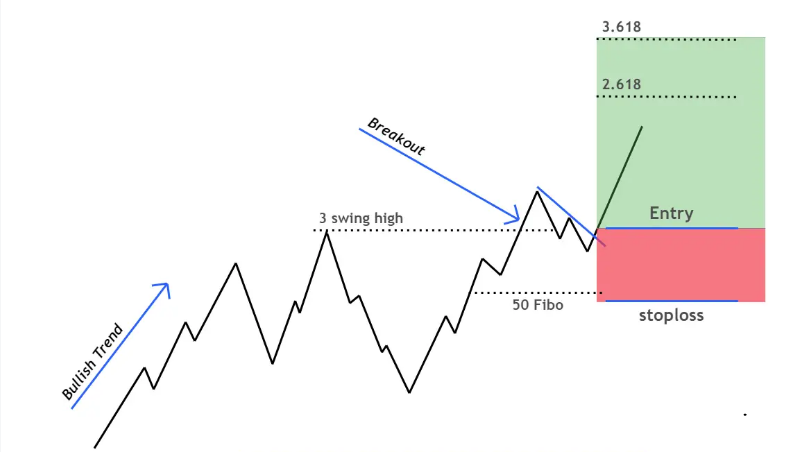
Wait for the price to rise above the broken resistance and then place a buy order when the price retests the resistance line, now acting as support. Set the stop loss below this new support area while keeping the profit target the same as in the first chart pattern
In the chart below, the second method of trading the Megaphone pattern is illustrated
-
EL1 Long Entry: Enter the trade after the price retests the resistance, now functioning as support (in the red-shaded area).
-
SL2 Stop Loss: Position the stop loss below the new support level to manage risks.
-
TP3 Profit Target: Set the profit target at a distance equal to the height of the pattern, measured upwards from the neckline."
Conclusion
In conclusion, the bullish megaphone chart pattern is a potent tool in technical analysis, capable of identifying opportunities for market participants. However, it should be incorporated into a well-rounded trading strategy that takes into account various factors and indicators to make informed investment decisions.
Frequently Asked Questions
-
What is the ascending megaphone pattern in technical analysis?
The ascending megaphone pattern, a key element in technical analysis, is a chart pattern that resembles a widening megaphone. It can be found in various stocks.
-
How Does the Megaphone Pattern Manifest in Stock Markets?
The megaphone pattern stocks are recognized by their distinct widening shape. Traders refer to it when assessing whether a stock's price movement is bullish or bearish.
-
What Does the Megaphone Bottom Indicate in Technical Analysis?
A megaphone bottom is a component of the megaphone pattern. When observed in technical analysis, it typically suggests a potential bullish reversal in an asset's price trend.
-
Is the megaphone pattern generally considered bullish or bearish?
The classification of the megaphone pattern as bullish or bearish depends on its context and the direction in which the asset's price breaks out of the pattern. It can be an indicator of either bullish or bearish sentiment.
-
How is the technical analysis used with the microphone Pattern?
Technical analysis is essential when working with the megaphone pattern. Traders employ this analysis to interpret the pattern's implications and make informed decisions regarding their investments.