Knowledge Center Technical Analysis
Reversal Patterns
Head and Shoulder Chart pattern
It consists of three peaks, with the middle peak (the "head") higher than the two outer peaks (the "shoulders"). A neckline is drawn through the lows of the pattern, and when the price breaks below it, it's considered a bearish reversal signal.
Conversely, a break above the neckline in an inverse Head and Shoulders pattern indicates a bullish reversal. This pattern is widely used by traders to make informed decisions in financial markets.
This pattern is considered a reliable trend reversal chart formation pattern. It is also known as the head and shoulders top. It is generally found after an uptrend or downtrend.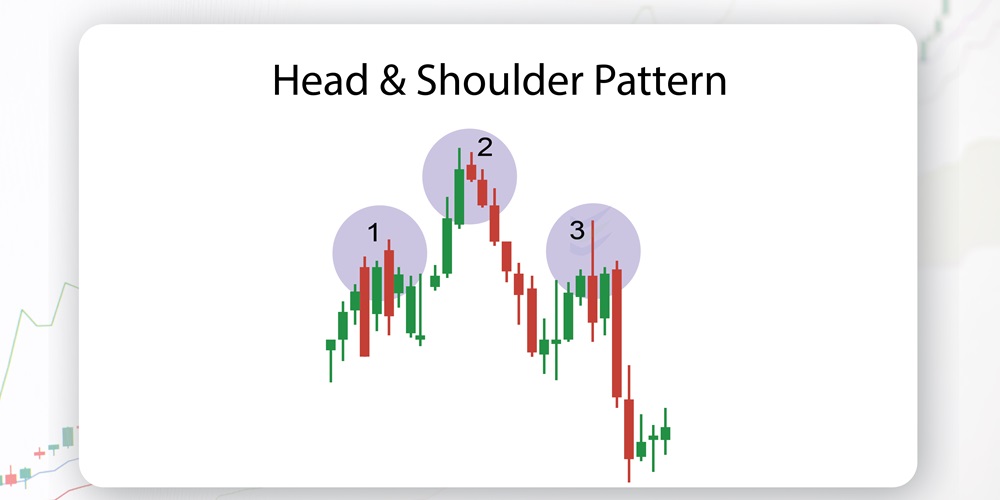
How does a Head and Shoulder pattern look like?
A Head and Shoulders trading pattern has a distinct visual appearance on a price chart, resembling the shape of a human head and shoulders. Here's how it looks:
Head: The central peak is the highest point in the pattern and represents the "head" of the formation. This peak is typically higher than the surrounding peaks.
Shoulders: On either side of the head, you'll find two smaller peaks called the "shoulders." These shoulders are lower in height compared to the head but are roughly at the same level as each other.
Neckline: A horizontal line is drawn beneath the lows of the left shoulder, head, and right shoulder. This line is known as the "neckline" and acts as a crucial reference point.
Volume: While not visible in the pattern's visual appearance, volume is an essential factor in confirming the pattern's validity. Usually, you observe declining volume in Bullish Head and Shoulders pattern and increasing volume when the price eventually breaks below the neckline in a Bearish Head Shoulders pattern.
The confirmation of the Head and Shoulders pattern occurs when the price breaks below the neckline in a Head and Shoulders top pattern (Head and Shoulders Pattern Bearish) or when it breaks above the neckline in Head and Shoulders Inverse pattern (Head and Shoulders Pattern Bullish). Traders use this pattern to make predictions about potential trend reversals and set their trading strategies accordingly.
Now Let’s consider a standard head and shoulder pattern
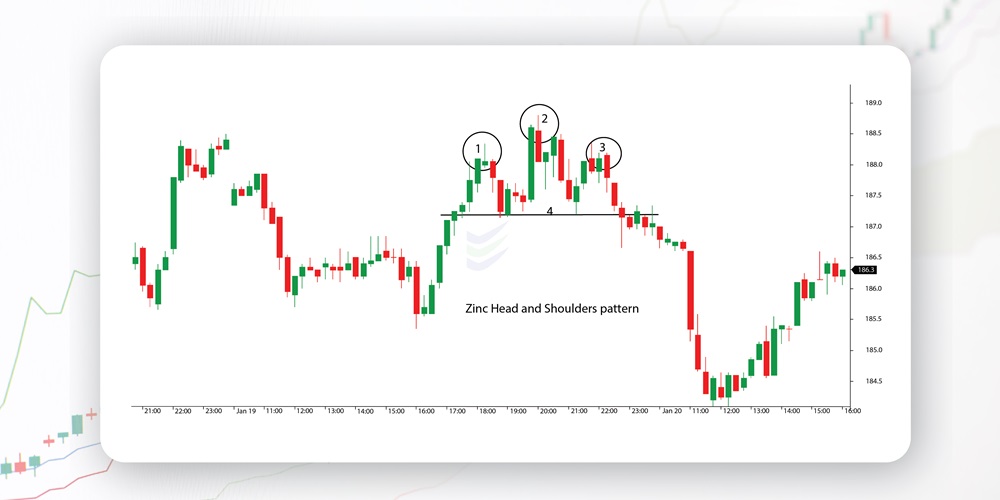
This pattern arrives after an uptrend and signals a possible reversal to the downside.
1. Left shoulder
2. Head
3 Right shoulder
4. Neckline
When does a Head and Shoulders pattern is formed?
A Head and Shoulders pattern is formed after a specific price pattern develops on a price chart. Here's when a Head Shoulder pattern is typically considered to be formed:
Uptrend for Head and Shoulders Top (Bearish): A Head and Shoulders top pattern is typically formed after a prolonged uptrend in the price of an asset. During this uptrend, the price reaches a peak, forming the left shoulder, and then retracts a bit before making a higher peak, forming the head. After that, it retraces again to create a third peak, which is usually similar in height to the left shoulder, forming the right shoulder.
Downtrend for Inverse Head and Shoulders (Bullish): An Inverse Head and Shoulders pattern, which is its bullish counterpart, is typically formed after a sustained downtrend. In this case, the price reaches a low point, forming the left shoulder, then rallies but doesn't reach as high as the subsequent rally, forming the head. It falls again, forming the right shoulder, which is often at a similar level to the left shoulder.
Neckline Formation: The neckline is a horizontal line drawn connecting the lows of the left shoulder, head, and right shoulder. It's a critical element of the pattern. The formation of the neckline is essential to identify the pattern.
Pattern Completion: The Head and Shoulder chart pattern is considered fully formed when the price breaks below the neckline in a Head and Shoulders top (bearish) pattern or when it breaks above the neckline in an Inverse Head and Shoulders (bullish) pattern. This breakout confirms the pattern and signals a potential trend reversal.
Volume Confirmation: To increase the reliability of the pattern, traders often look for volume confirmation. Typically, you observe declining volume as the pattern develops and an increase in volume when the price breaks the neckline. This increase in volume can add confidence to the pattern's validity.
Remember that not every price pattern with three peaks and a neckline qualifies as a head and shoulders (chart pattern). It's essential to consider the context of the prevailing trend, the shape of the peaks, and the behaviour of volume before confirming the pattern and making trading decisions.
What does a head & shoulders pattern indicate?
A Head and Shoulders patterns is a significant technical chart pattern that serves as a potential indicator of a trend reversal. The interpretation of this pattern depends on whether it's a Head and Shoulders Top (bearish) or an Inverse Head and Shoulders (bullish):
Head and Shoulders Top (Bearish):
When a Head and Shoulders top pattern is identified and confirmed, it typically indicates the following in trading:
-
Trend Reversal: The pattern suggests that an existing uptrend is losing strength and may reverse into a downtrend.
-
Bearish Sentiment: Heads and Shoulders pattern in trading often seen by Traders as a sign of increasing bearish sentiment in the market, potentially leading to selling pressure.
-
Potential Short Opportunity: Some traders use the confirmation of a Head and Shoulders top as a signal to enter short positions (selling) in anticipation of a price decline.
-
Downside Target: Traders may estimate a downside price target by measuring the distance from the head to the neckline and subtracting it from the neckline's breakout point. This provides a rough target for the potential price decline.
Inverse Head and Shoulders (Bullish):
When an Inverse Head and Shoulders pattern is identified and confirmed, it typically indicates the following in trading:
-
Trend Reversal: The pattern suggests that an existing downtrend is losing strength and may reverse into an uptrend.
-
Bullish Sentiment: Traders often see this pattern as a sign of increasing bullish sentiment in the market, potentially leading to buying interest.
-
Potential Long Opportunity: Some traders use the confirmation of an Inverse Shoulder Head Shoulder pattern as a signal to enter long positions (buying) in anticipation of a price rise.
-
Upside Target: Traders may estimate an upside price target by measuring the distance from the head to the neckline and adding it to the neckline's breakout point. This provides a rough target for the potential price increase.
It's important to remember that while the head and shoulders chart is a valuable tool for technical analysis, it is not foolproof, and false signals can occur. Traders often use additional technical indicators and analysis to confirm the pattern's validity and to manage risk effectively. Additionally, risk management is crucial when implementing trading strategies based on any technical pattern.
How to trade when you see a Head and Shoulder Chart pattern?
Head and Shoulders Trading based on the Head and Shoulders stock pattern involves a technical analysis approach to identify potential trend reversals. This pattern is considered a reversal pattern, signalling a shift from an uptrend to a downtrend. let's analyze the head and shoulder pattern with the help of a chart.
Technique 1
When we identify a head and shoulders pattern in an uptrend and the right shoulder has been completed, we can consider to “Enter a sell order when the price breaks through the neckline.” To prevent “false breakout,” wait for a candle to close below the neckline before entering the market.

Number 1: First shoulder
Number 2: Head
Number 3: Second shoulder
Number 4: Neckline
Entry -1 : Short sell entry
Stoploss-2: Stop loss is placed above the higher high of the right shoulder.
How to take Profit level
Measurement of the distance between the head and the neckline of the pattern, and then placing the target the same distance from the neckline in the breakout direction.

Description of the chart
1 - Sell Entry (where the price breaks through the neckline)
2 - Stop Loss Entry (above the higher highs of the right shoulder)
4 - Neckline
5 - Height of the head to neckline
6 - same distance as 5
Take profit level- is placed at 6,distance between the neckline and take profit below is the same as the neckline to the top of the head.
Suggestions:
Wait for a candle to break through and close below the neckline.
The Stop Loss would go above the right shoulder.
The profit target would go the same distance as the head to the neckline, down from the neckline.
Technique 2
“Wait for the price to break below the neckline” (broken support) as in the first illustration. Look to place a sell order on the retest of the neckline (broken support is now treated as resistance)."
Number 1: First shoulder
Number 2: Head
Number 3: Second shoulder
Number 4: Neckline
Number 5: Height of the head to the neckline in (Red).
Number 6: Same height as the distance from the head to the neckline (Red).
Short sell entry : 1 - placed above the neckline
Stop loss entry : 2 - (above the higher highs of the right shoulder)
Take Profit : 3 - below short sell entry up to the height of number 6
Suggestions:
Wait for the price to break through the neckline and then wait until it retests the neckline as resistance.
The stop loss would go above the resistance level.
The profit target would be placed the same distance from the neckline as the height of the head to the neckline.
In a nutshell, the procedure to trade when you spot a pattern head and shoulders is
Identify the Pattern:
Look for an existing uptrend in the price chart. The Head and Shoulders pattern typically appears after an extended bullish move.
Identify the three key parts of the pattern: the left shoulder (a smaller peak), the head (the highest peak), and the right shoulder (another smaller peak). These peaks should form a relatively consistent horizontal neckline.
Confirm the Pattern:
Ensure that the price action conforms to the classic Head and Shoulders pattern. The head should be higher than the shoulders, and the neckline should be roughly horizontal.
Neckline Breakout:
The critical trading signal occurs when the price breaks below the neckline, which is the horizontal line connecting the lows of the shoulders.
This is typically considered a bearish signal, indicating that the previous uptrend may be reversing.
Entry and Stop-Loss:
After the neckline breakout, consider entering a short trade (selling) when the price retraces back to the neckline. This retracement offers a potentially better entry point.
In Head and Shoulders pattern stop-loss order is placed above the right shoulder or the head to limit potential losses if the pattern fails.
Target and Risk Management:
In Head and Shoulders pattern target price by measuring the vertical distance from the head to the neckline and subtracting it from the breakout point. This gives you a rough estimate of how far the price might drop.
Use proper risk management techniques, such as setting a risk-reward ratio and trailing stops, to protect your capital.
Volume Confirmation:
Volume can provide additional confirmation. Ideally, you'd like to see higher trading volume during the breakdown below the neckline, which suggests increased selling pressure.
Time Frame:
Consider the time frame you are trading on. Patterns can vary in significance depending on the time frame. Longer time frames often carry more weight.
Monitor for False Signals:
Be aware that not all Head and Shoulders patterns lead to significant trend reversals. Sometimes, they may fail, resulting in a false signal.
Practice and Education:
Before trading with real money, practice identifying and trading the Head and Shoulders pattern on a demo account.
Continuously educate yourself on technical analysis, as well as risk management and trading psychology.
Remember that no trading strategy is foolproof, and risk is inherent in all trading activities. It's essential to have a clear trading plan, manage your risk effectively, and consider using additional technical and fundamental analysis to make well-informed trading decisions.
Frequently asked questions
how to use head and shoulder pattern in stock?
To use the Head and Shoulders pattern in stock trading:
-
Identify the pattern in an uptrend.
-
Enter a short position after the neckline breakout.
-
Set a stop-loss and target based on pattern measurements for risk management.
What is head and shoulders pattern stop loss?
In a Head and Shoulders pattern:
-
A stop-loss is a predetermined price level set to limit potential losses.
-
For short trades (bearish), place the stop-loss just above the right shoulder or head.
-
For long trades (rare, in reverse Head and Shoulders), place the stop-loss just below the right shoulder or head.
How do I confirm the Head and Shoulders pattern?
Confirmation of the pattern occurs when the price breaks below the neckline on increased volume. Volume can help validate the pattern's strength.
Is the Head and Shoulders pattern used in other markets besides stocks?
Yes, the pattern is used in various financial markets, including forex, commodities, and cryptocurrencies, to identify potential trend reversals.
Can the Head and Shoulders pattern fail?
Yes, like any technical pattern, the Head and Shoulders pattern can fail. Sometimes, a breakout below the neckline may not result in a sustained downtrend, leading to a false signal. Traders should be cautious and use proper risk management.