Knowledge Center Technical Analysis
Reversal Patterns
Double Bottom Chart Pattern
The double bottom chart pattern is the opposite of the double top and signals a reversal after a downtrend. Recognizing this pattern indicates potential buying opportunities. This lesson guides you in identifying the pattern and explores two methods for trading the double bottom.
What is the process for recognizing the double bottom pattern?
Two lows are observed, as the price attempts twice to breach a support level before reversing upwards. Additionally, there is a neckline, recognized as the upper section of the pattern.
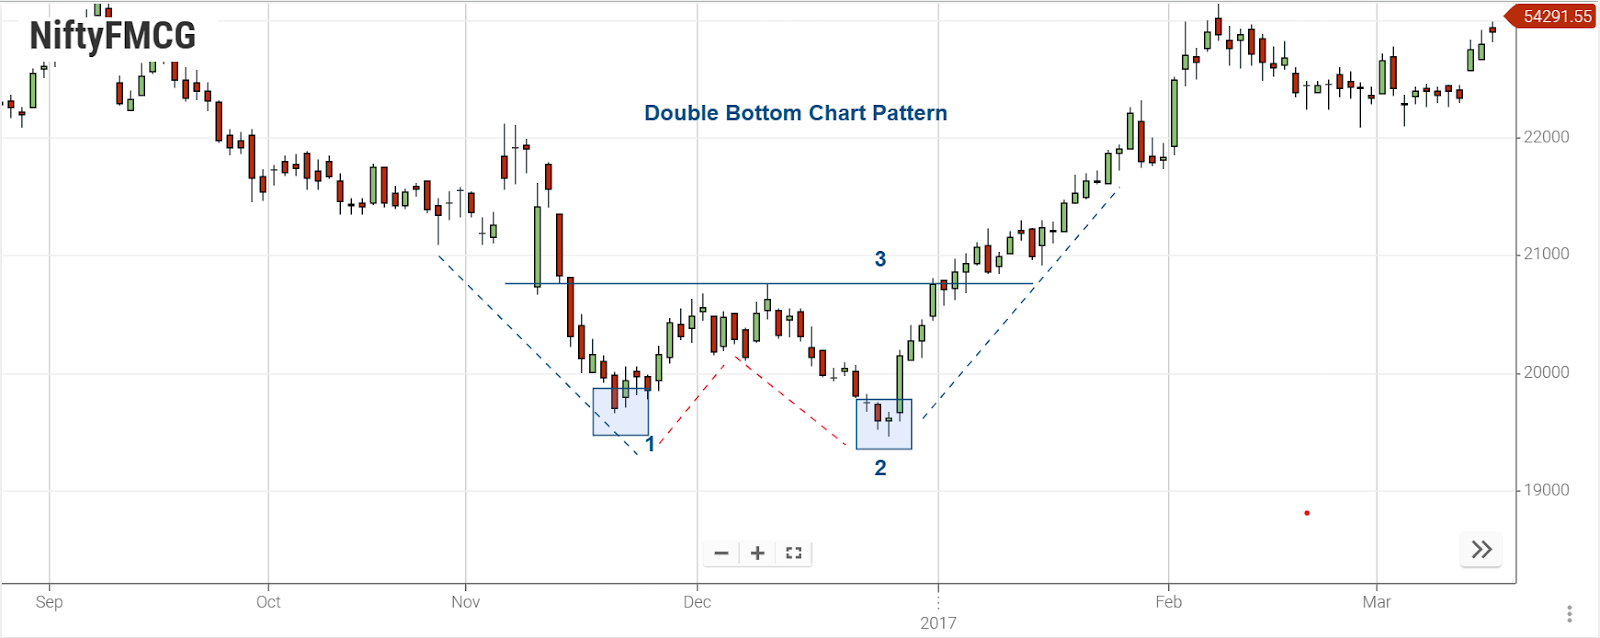
The following chart illustrates the appearance of a double-bottom pattern:
-
First low
-
Second low
-
Neckline
A double bottom takes shape when sellers make two attempts to breach a support level. Initially, buyers step in at the support level (1), halting further downward pressure. After an unsuccessful attempt at new lows, sellers retreat, empowering buyers to drive the price upward (2).
Trading with the double bottom chart pattern -Method 1:
Let's explore two methods to trade the double bottom.
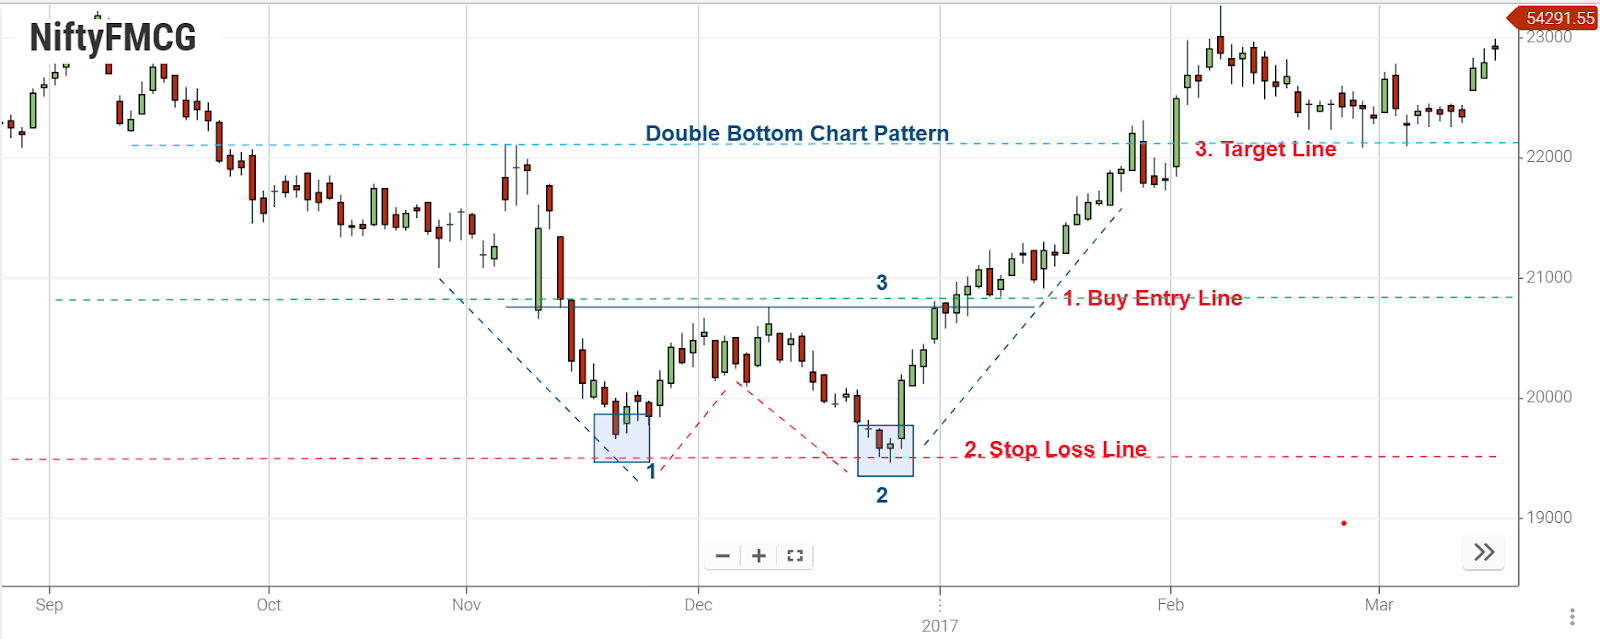
One approach involves entering a long position when the price breaks the pattern's neckline. The visual representation emphasizes the breaking of the blue neckline as the price ascends.
Key Points on Chart:
-
First low- Enter the trade when the price breaks through the neckline
-
Second low- Set the stop loss below the pattern
-
Neckline- Establish the profit target at the same distance as the pattern's height, upwards from the neckline
As depicted in the above chart, the entry point coincides with the price breaking the neckline. Place the stop loss just below the lows of the double bottom pattern, while the profit target is determined by extending the pattern's height from the neckline.
Trading with the double bottom chart pattern -Method 2:
Another method to trade the double bottom pattern involves waiting for the price to surpass the neckline (broken resistance). Subsequently, place a buy order during the retest of the neckline as it transforms into support. Position the stop loss below the new support area, while maintaining the profit target identical to the first example.
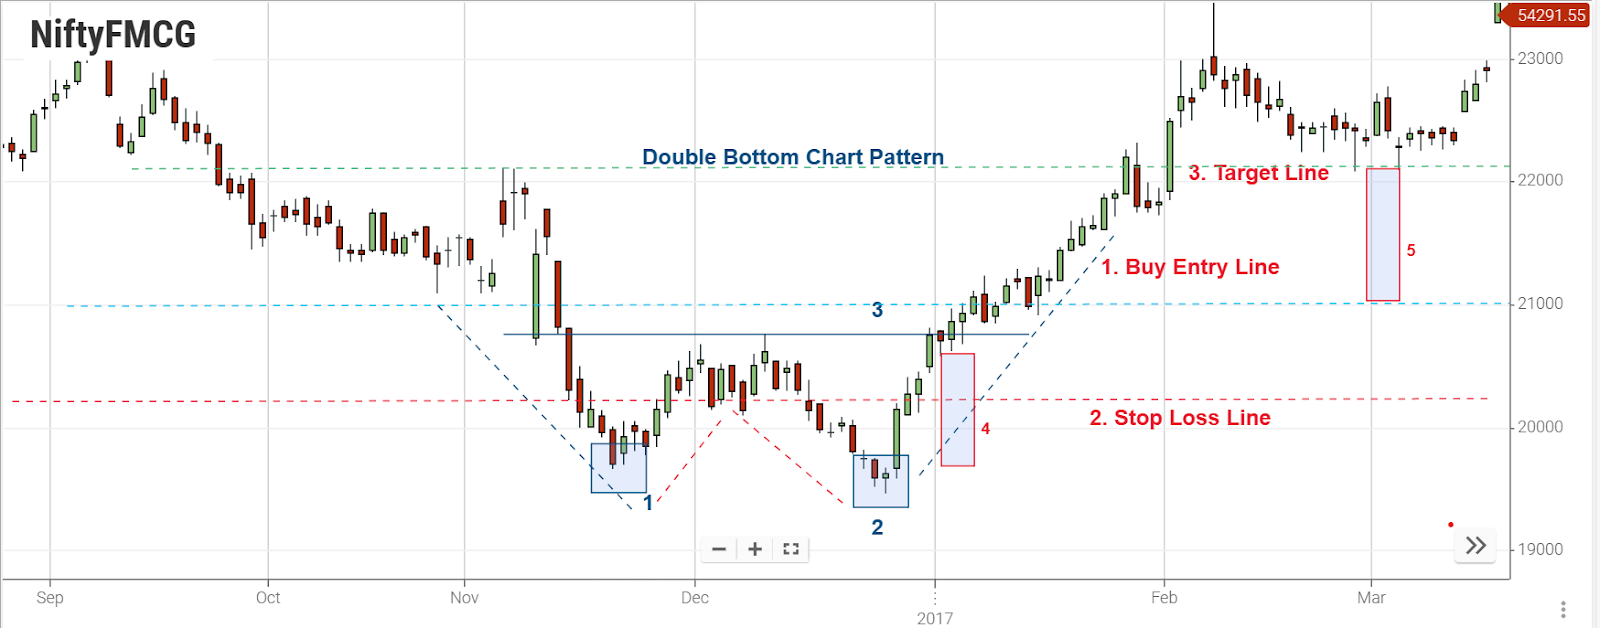
The accompanying chart illustrates this approach, indicating entry (blue), stop loss (red), and take profit levels (green).
Key Points on Chart:
No.1: First low
No. 2: Second low
No. 3: Neckline
No. 4: Height of the pattern-red shaded area
No. 5: Same distance as height of the pattern -red shaded area
Trade Execution:
EL1: Enter a long position following the price's retest of the neckline, situated within the red-shaded area.
SL2: Stop loss positioned below the new support level
TP3: Profit target set at the same distance as the height of the pattern, upwards from the neckline
Key Takeaways
-
The double bottom chart pattern signals a potential upward price movement, presenting potential buying opportunities.
-
Trade the pattern by entering upon the neckline breakout, placing the stop loss below the pattern, and setting the profit target at the same height as the pattern, above the neckline.
-
Alternatively, engage in the double bottom trade post neckline breakout, with a retest confirming support. Position the stop loss below the support level, and set the profit target at a distance equal to the pattern's height, above the neckline.
Frequently Asked Questions
-
What is the double bottom chart pattern, and how does it differ from the double top?
The double bottom chart pattern signals a reversal after a downtrend, opposite to the double top. It suggests potential buying opportunities.
-
What are the indicators to identify the double bottom pattern in stock trading?
The double bottom involves two lows as the price attempts to breach a support level twice before reversing upwards. Look for the neckline as the upper part of the pattern.
-
How do I filter stocks using the double-bottom chart pattern?
Utilize stock screening tools or chart analysis platforms to identify stocks showing the characteristic double bottom pattern, indicating potential reversal opportunities.
-
What's the approach for setting targets after identifying a double bottom pattern?
Measure the height of the pattern, from the neckline to the lowest point. Extend this measurement upwards from the neckline to set a potential target for your trade. Consider market conditions and key support/resistance levels for additional refinement.
-
What is the key process in trading the double bottom pattern using Method 2?
Wait for the price to surpass the neckline, then place a buy order during the retest as support. Set the stop loss below the new support and maintain the profit target distance from the neckline.