Knowledge Center Technical Analysis
Reversal Patterns
Double Top Reversal Chart Pattern
What is the Double Top Pattern?
The double top chart pattern is a bearish reversal pattern that occurs after an uptrend. It is a technical analysis pattern used by traders to identify a potential change in the direction of the price movement.
Characteristics of Double Top Reversal Chart Pattern
The Double Top Candlestick Pattern is characterized by several distinctive features that traders often look for when identifying potential trend reversals. Here are the key characteristics of the Double Top Reversal:
Two Peaks at Similar Levels:
The pattern consists of two peaks, or tops, that reach approximately the same price level.
The first peak represents the climax of the previous uptrend, and the second peak signifies a failed attempt to continue the upward movement.
Trough or Retracement Between Peaks:
Between the two peaks, there is a trough or retracement in the price.
This retracement reflects a temporary pullback in the market, indicating a decrease in buying pressure.
Neckline as Support:
The lows or troughs between the two peaks are connected by a horizontal line called the neckline.
The neckline acts as a support level, and a break below this line is a key confirmation of the reversal.
Volume Analysis:
Volume trends play a significant role in confirming the pattern.
During the formation of the second peak, there is often a decrease in trading volume, signalling weakening buying interest. A subsequent increase in volume during the breakout below the neckline adds confirmation.
Bearish Reversal Signal:
The Double Top Reversal is considered a bearish reversal pattern, suggesting a shift from an existing uptrend to a potential downtrend.
The failure of the second peak to surpass the first indicates that buyers are losing strength, and sellers may be taking control.
Projected Price Target:
Traders often project a price target for the potential downward movement after the breakout double top pattern.
The target is calculated by measuring the distance from the highest point of the double top to the neckline and projecting it downward from the breakout point.
Timeframe Consideration:
The pattern is more significant on longer timeframes, such as daily or weekly charts, as it reflects a more sustained shift in market sentiment.
Confirmation through Close Below Neckline:
Traders typically wait for a decisive close below the neckline to confirm the Double Top Reversal.
A single-day dip below the neckline may not be sufficient for confirmation; a sustained break is more convincing.
By recognizing these characteristics, traders can effectively identify and interpret the Double Top Reversal Chart Pattern, aiding them in making informed trading decisions. However, it's essential to use pattern recognition in conjunction with other analysis tools for comprehensive market evaluation.
How To Identify Double Top Pattern
The Double Top Pattern Chart looks like an uppercase "M" on a price chart. Here's a step-by-step description of how it appears:
Initial Uptrend:
The pattern typically forms after a prolonged uptrend in the price of an asset, indicating a strong bullish sentiment.
First Peak (Left Peak):
The bullish trend reaches a peak, forming the first top. This is a point where selling pressure starts to overcome buying pressure.
Visually, this forms the left peak of the "M" shape.
Retracement or Trough:
After the first peak, the price experiences a retracement or temporary pullback. This retracement creates a trough between the two peaks.
The trough visually represents the bottom of the "M."
Second Peak (Right Peak):
The price rallies again to a similar level as the first peak, forming the second top. However, the second peak fails to exceed the height of the first, indicating a struggle to sustain the uptrend.
This forms the right peak of the "M."
Neckline:
The lows or troughs between the two peaks are connected by a horizontal line known as the neckline. The neckline acts as a support level.
The line connecting the two troughs forms the horizontal base of the "M."
Breakout Below the Neckline:
The confirmation of the Double Top Reversal occurs when the price breaks decisively below the neckline.
This breakout indicates that the bears have gained control, marking the beginning of a potential downtrend.
The "M" shape is a visual representation of the failed attempt to sustain the uptrend, and the subsequent break below the neckline signals a shift in market sentiment from bullish to bearish. It's important for traders to confirm the pattern with additional analysis, such as volume confirmation, to increase the reliability of the reversal signal.
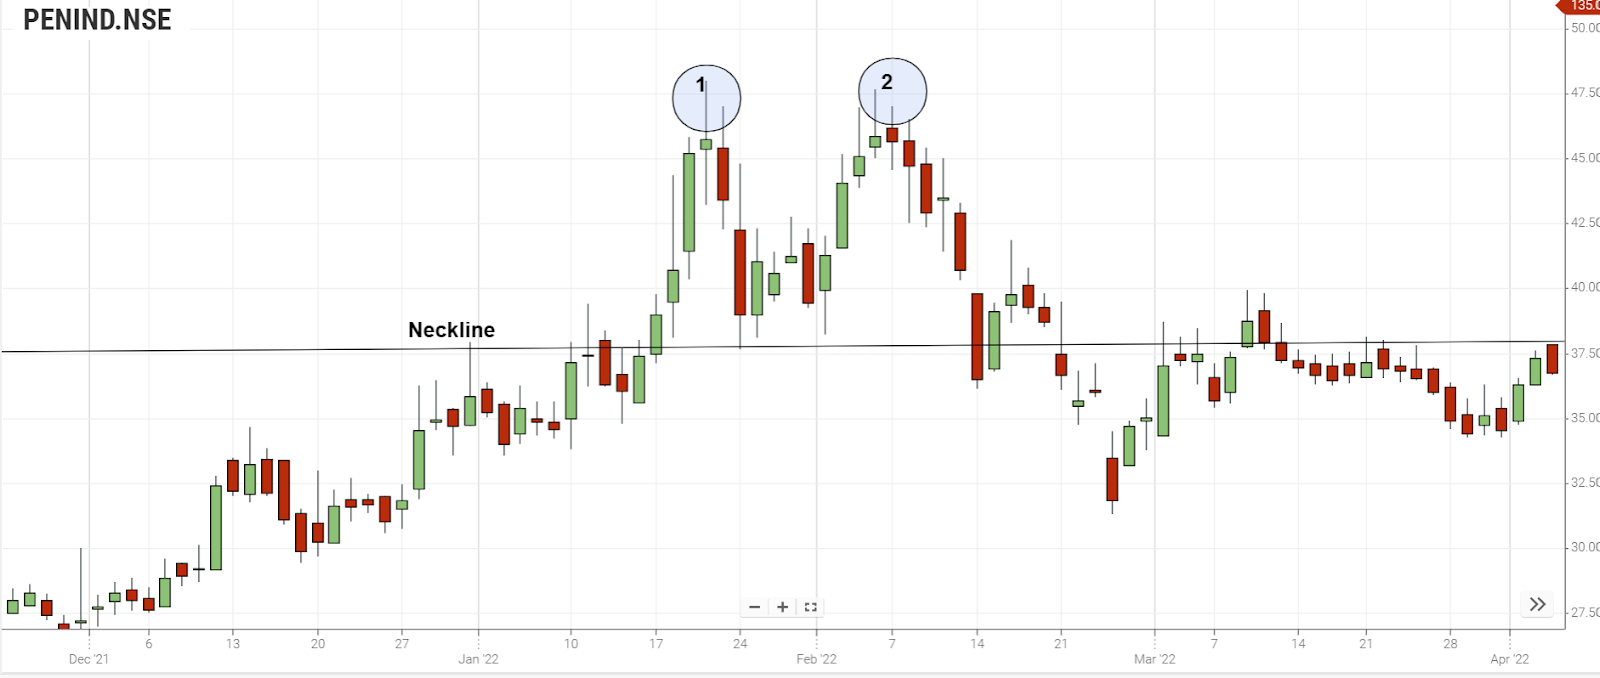
Note - The “highs” show that the price has aimed to break through a resistance level before reversal. The neckline is the bottom part of the pattern.
Consider the above chart Pattern,
Number 1: First high
Number 2: Second high
Neckline
First- high: Although the buyers tried to push the price through a resistance level, they were not successful. This is because of the sellers entering the market.
Second-high: The buyers made a second attempt, but again were not successful to break through to new highs. We need to understand that; this is due to the conquering of market made by the sellers over buyers once again.
Analyze the situation: Now we can read the situation. As it is evident that the buyers were not successful in pushing the price through resistance level and the price reversed downside. It is notable that; more sellers enter the market as a result.
To be a genuine & effective double top pattern, it is necessary that, the price must break the neckline of the pattern.
We can look for potential “selling opportunities” as soon as the pattern has been identified on the price charts.
Trading Strategies
Technique 1
This pattern can be traded on the break of the neckline. The “stop loss” is placed above the pattern. The “profit target” - the same distance as the height of the pattern, down from the neckline.
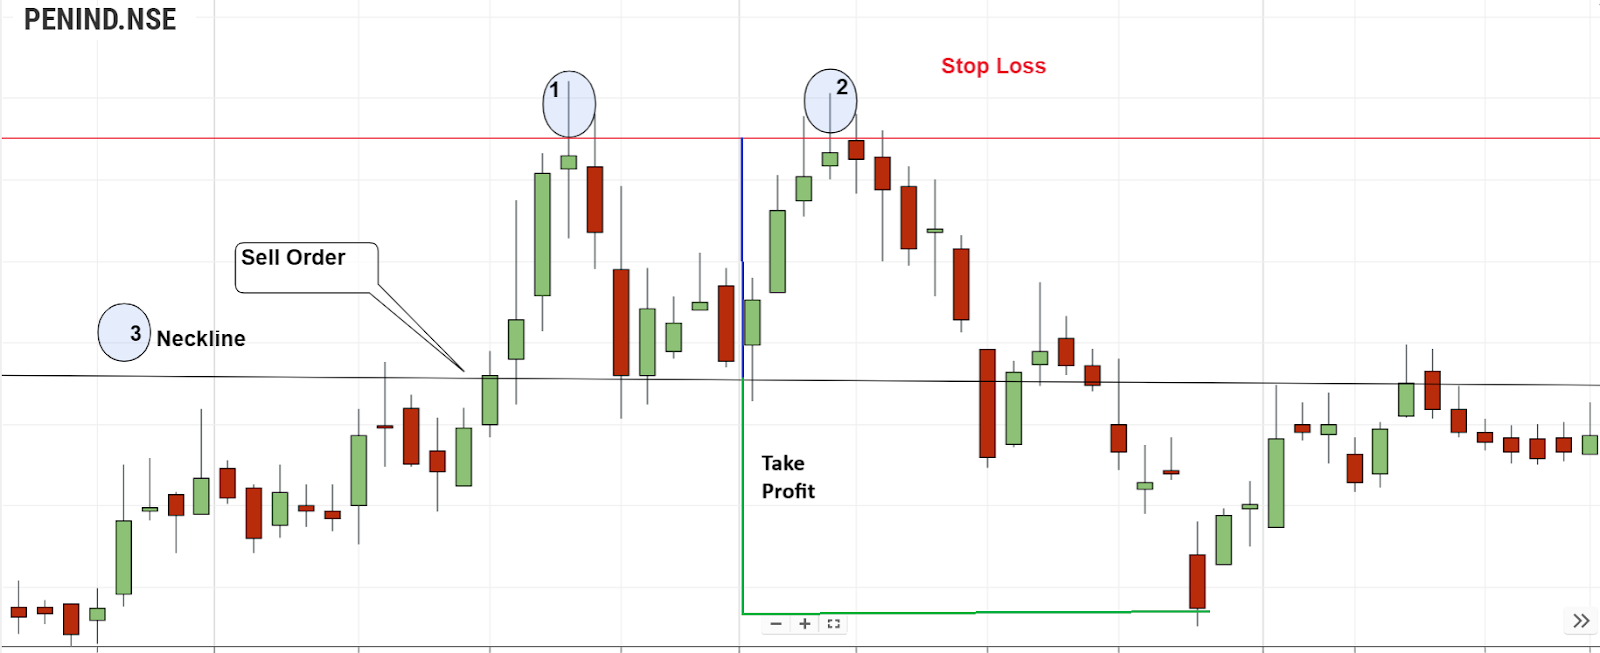
Observe the neckline that is marked.
Enter the market with a “sell order” as soon as the price breaks through.
Short traders can enter the market when the neckline is broken by the price.
The “Stop loss” is placed above the double top. If the price trades beyond this point, the pattern has failed & we need not be in the market any longer.
The height of the actual pattern and extending that distance down from the neckline gives “profit target” i.e. Take Profit.
Number 1: First high
Number 2: Second high
Number 3: Neckline
Minimum Target Height of the pattern (Blue vertical line)
Take Profit: “Profit target” placed the same distance away as the height of the pattern, down from the neckline
Sell Order: “Short entry” at break of the neckline
Stop Loss: “Stop loss” placed above the highs of the pattern
Technique 2
Enter after the price has already broken through the neckline and has retested it as resistance. Place the stop loss above the resistance level. Down the neckline, the profit target - the same distance as the height of the pattern
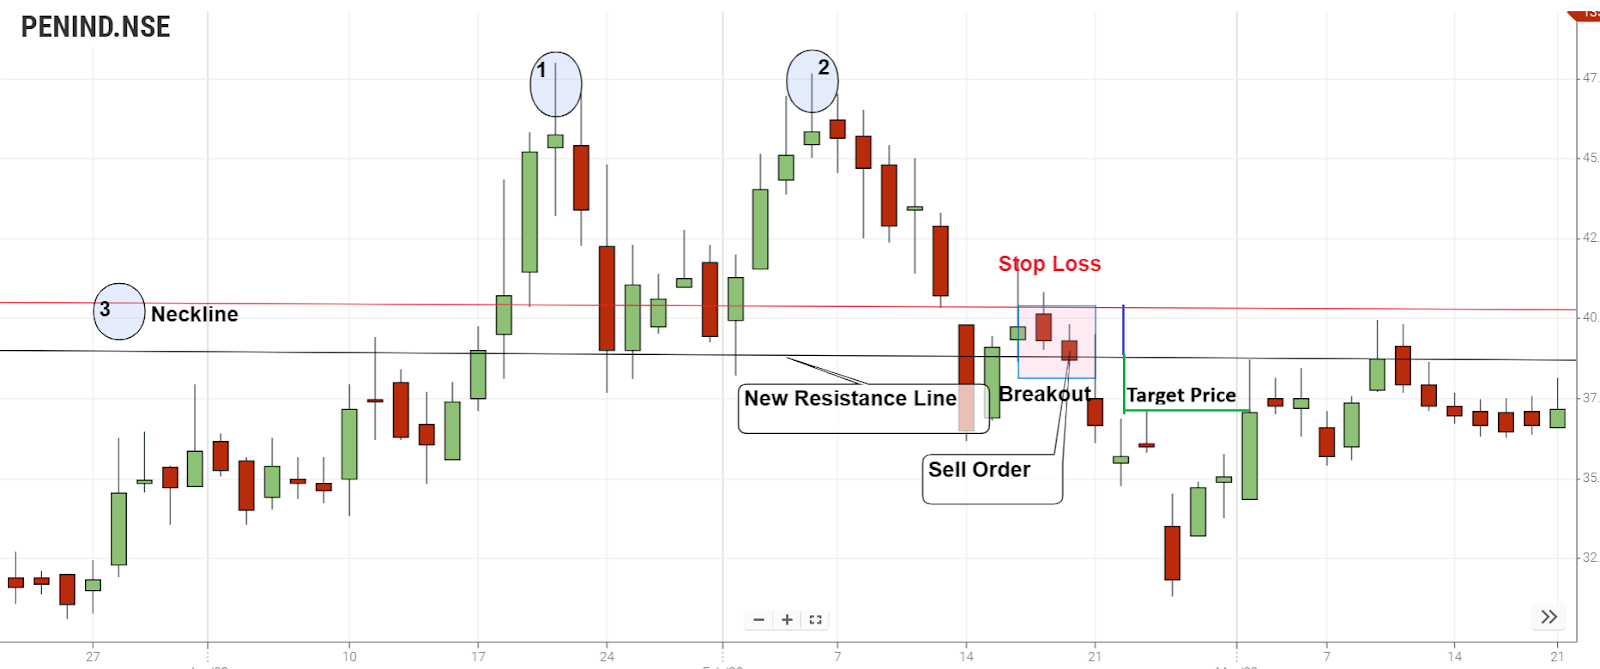
Wait for the price to trade below the neckline (broken support).
Find to place a sell order on the retest of the neckline as resistance (Note: Broken support now becomes resistance).
The “stop loss” would go above the new resistance area.
The profit target would remain the same as in the first technique.
Number 1: First high
Number 2: Second-high
Number 3: Neckline
Minimum Target: Height of the pattern.
Take Profit: Profit target places the same distance away as the height of the pattern, down from the neckline.
Sell Order: Short entry at the retest of the neckline as resistance.
Stop Loss: Stop loss placed just above resistance, after the price has retested the neckline.
Conclusion
The Double Top Reversal Chart Pattern signals a potential shift from a bullish to a bearish trend, confirmed by a decisive break below the neckline. This pattern reflects a struggle to sustain higher prices, indicating weakening bullish momentum. Volume analysis and risk management are crucial for reliable confirmation and effective trading decisions. Traders often project a downward target based on the pattern's height. While a powerful indicator, it should be used in conjunction with other analyses for a comprehensive approach.
Frequently Asked Questions
What happens after the double top pattern?
Following a Double Top Reversal pattern, a breakout below the neckline signals a potential shift from bullish to bearish sentiment. Traders may witness a downtrend initiation as selling pressure takes control. It's essential to monitor for price confirmation, volume trends, and potential retracements after the pattern for informed trading decisions.
What does a double top mean in forex?
In Forex, a Double Top pattern indicates a potential trend reversal from bullish to bearish. It forms after an uptrend, with two peaks at a similar level, and a decisive break below the pattern's neckline signals a shift in market sentiment, suggesting a possible downtrend. Traders often use this pattern for timely entries or exits based on its confirmation.
What does double top mean in trading?
In trading, a Double Top is a bearish reversal pattern formed after an uptrend, signalling potential weakness. It consists of two peaks at a similar level, and a break below the pattern's neckline confirms a shift in sentiment, indicating a possible trend reversal. Traders may use this pattern to make informed decisions on entries, exits, or adjustments to their positions.
What is the 3 Top Chart Patterns?
The concept of a "3 top chart pattern" is not a widely recognized term in technical analysis. However, if you're referring to a triple top pattern, it's a bearish reversal pattern characterized by three peaks at a similar price level, suggesting a potential trend reversal from bullish to bearish. Traders often look for a break below the pattern's support level for confirmation.
What Does Volume Confirming Mean in a Double Top Reversal?
Volume analysis is crucial for confirmation. A decrease in volume during the second peak and an increase during the breakout below the neckline add validity to the pattern.