Knowledge Center Technical Analysis
Reversal Patterns
Rounding Top Chart Pattern
Introduction
A rounded top chart pattern, also known as a rounding top or an inverted rounding bottom pattern , is a technical analysis pattern that appears on price charts.
It signals a potential reversal of an uptrend and is characterized by a gradual, rounded curvature at the top of the price chart, resembling an upside-down saucer or bowl. This rounding top pattern bullish or bearish suggests a shift in sentiment, with selling pressure gradually increasing as the price flattens and rounds off at the top. Traders often look for confirmation of the pattern through a breakdown below support levels, which may indicate the beginning of a downtrend.
How does a Rounding Top Chart pattern look like?
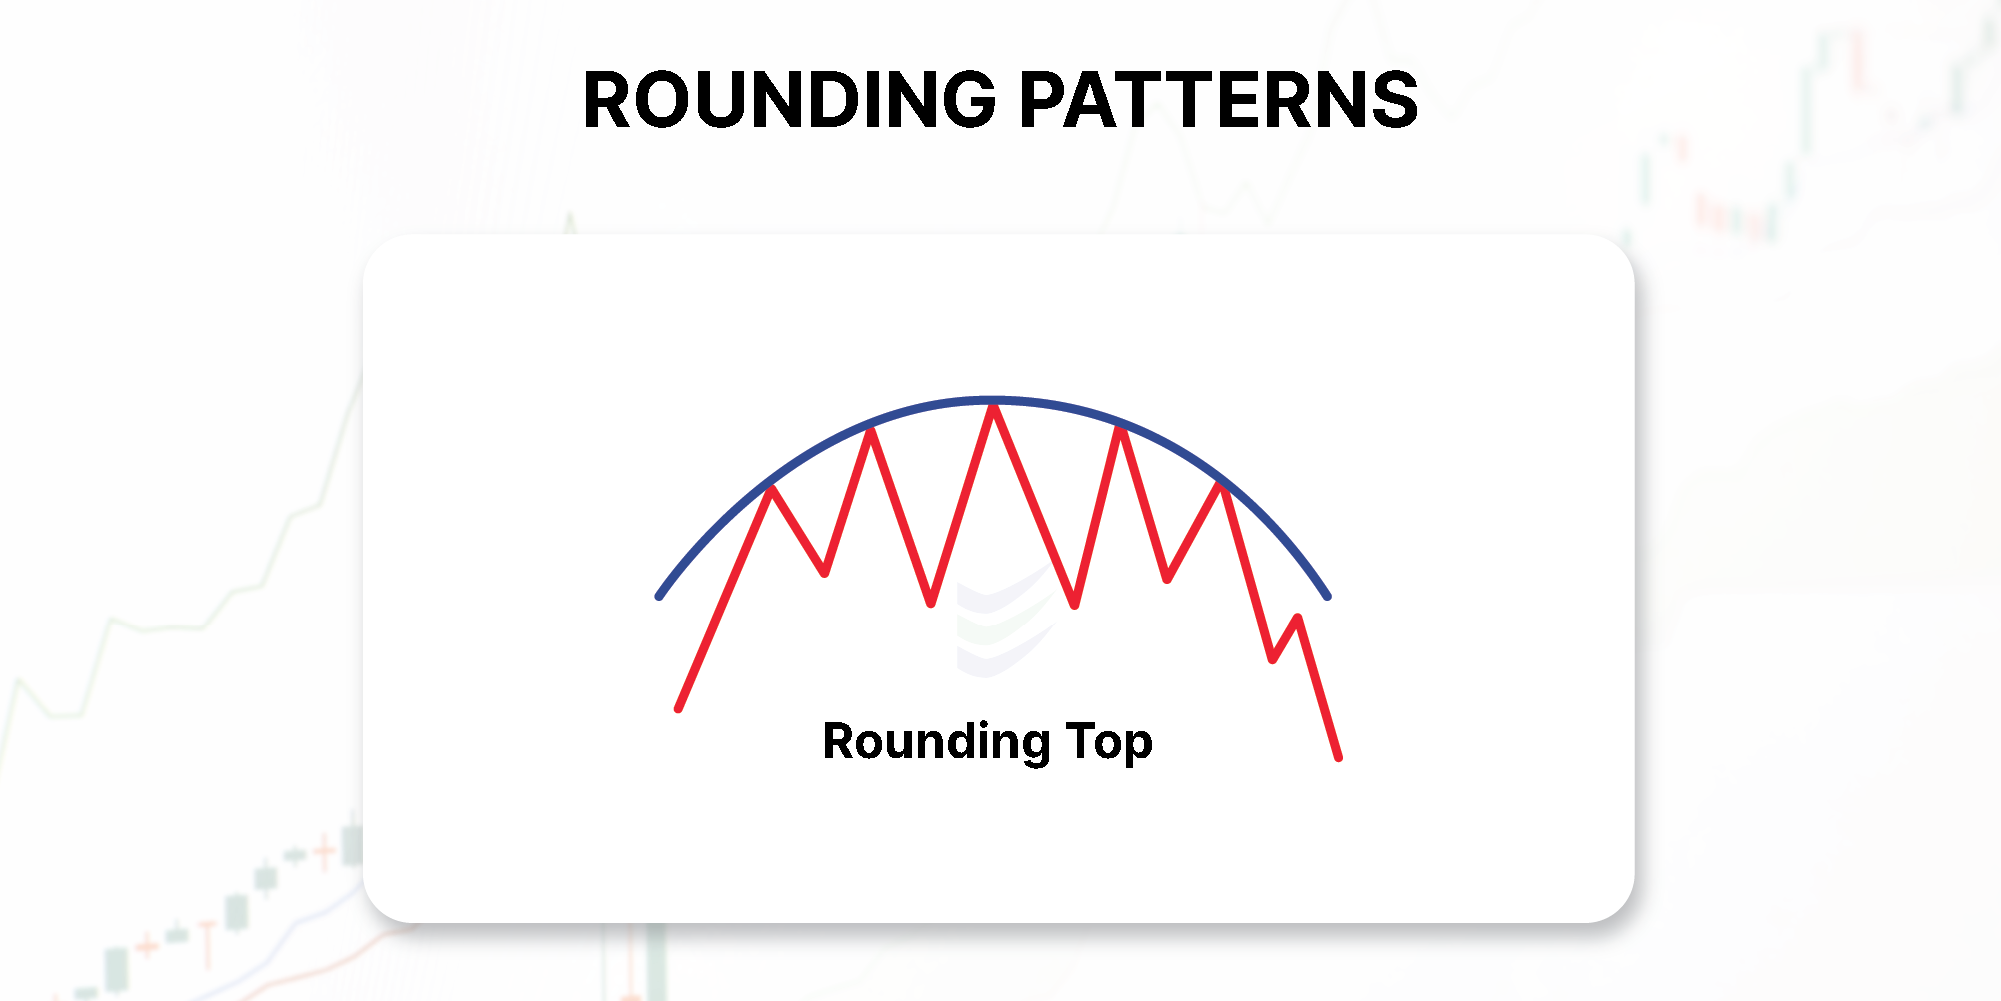
A rounded top pattern, also known as an inverted rounding bottom, has a specific appearance that traders look for to identify potential trend reversals. Here's a detailed description of how a rounding top pattern looks:
Uptrend: The rounding top pattern typically forms after a prolonged uptrend in the price of an asset, indicating that the bulls (buyers) have been in control for some time.
Gradual Curve: Instead of a sharp peak or a straight horizontal line at the top, the price levels off and forms a smooth, rounded curve. This curve resembles the shape of an upside-down saucer or bowl. The gradual curve suggests that buying interest is diminishing, and selling pressure may be increasing.
Volume: During the formation of the rounding top pattern, trading volume often decreases. This reduction in volume indicates a decline in the conviction of buyers and may signal the beginning of a shift in market sentiment.
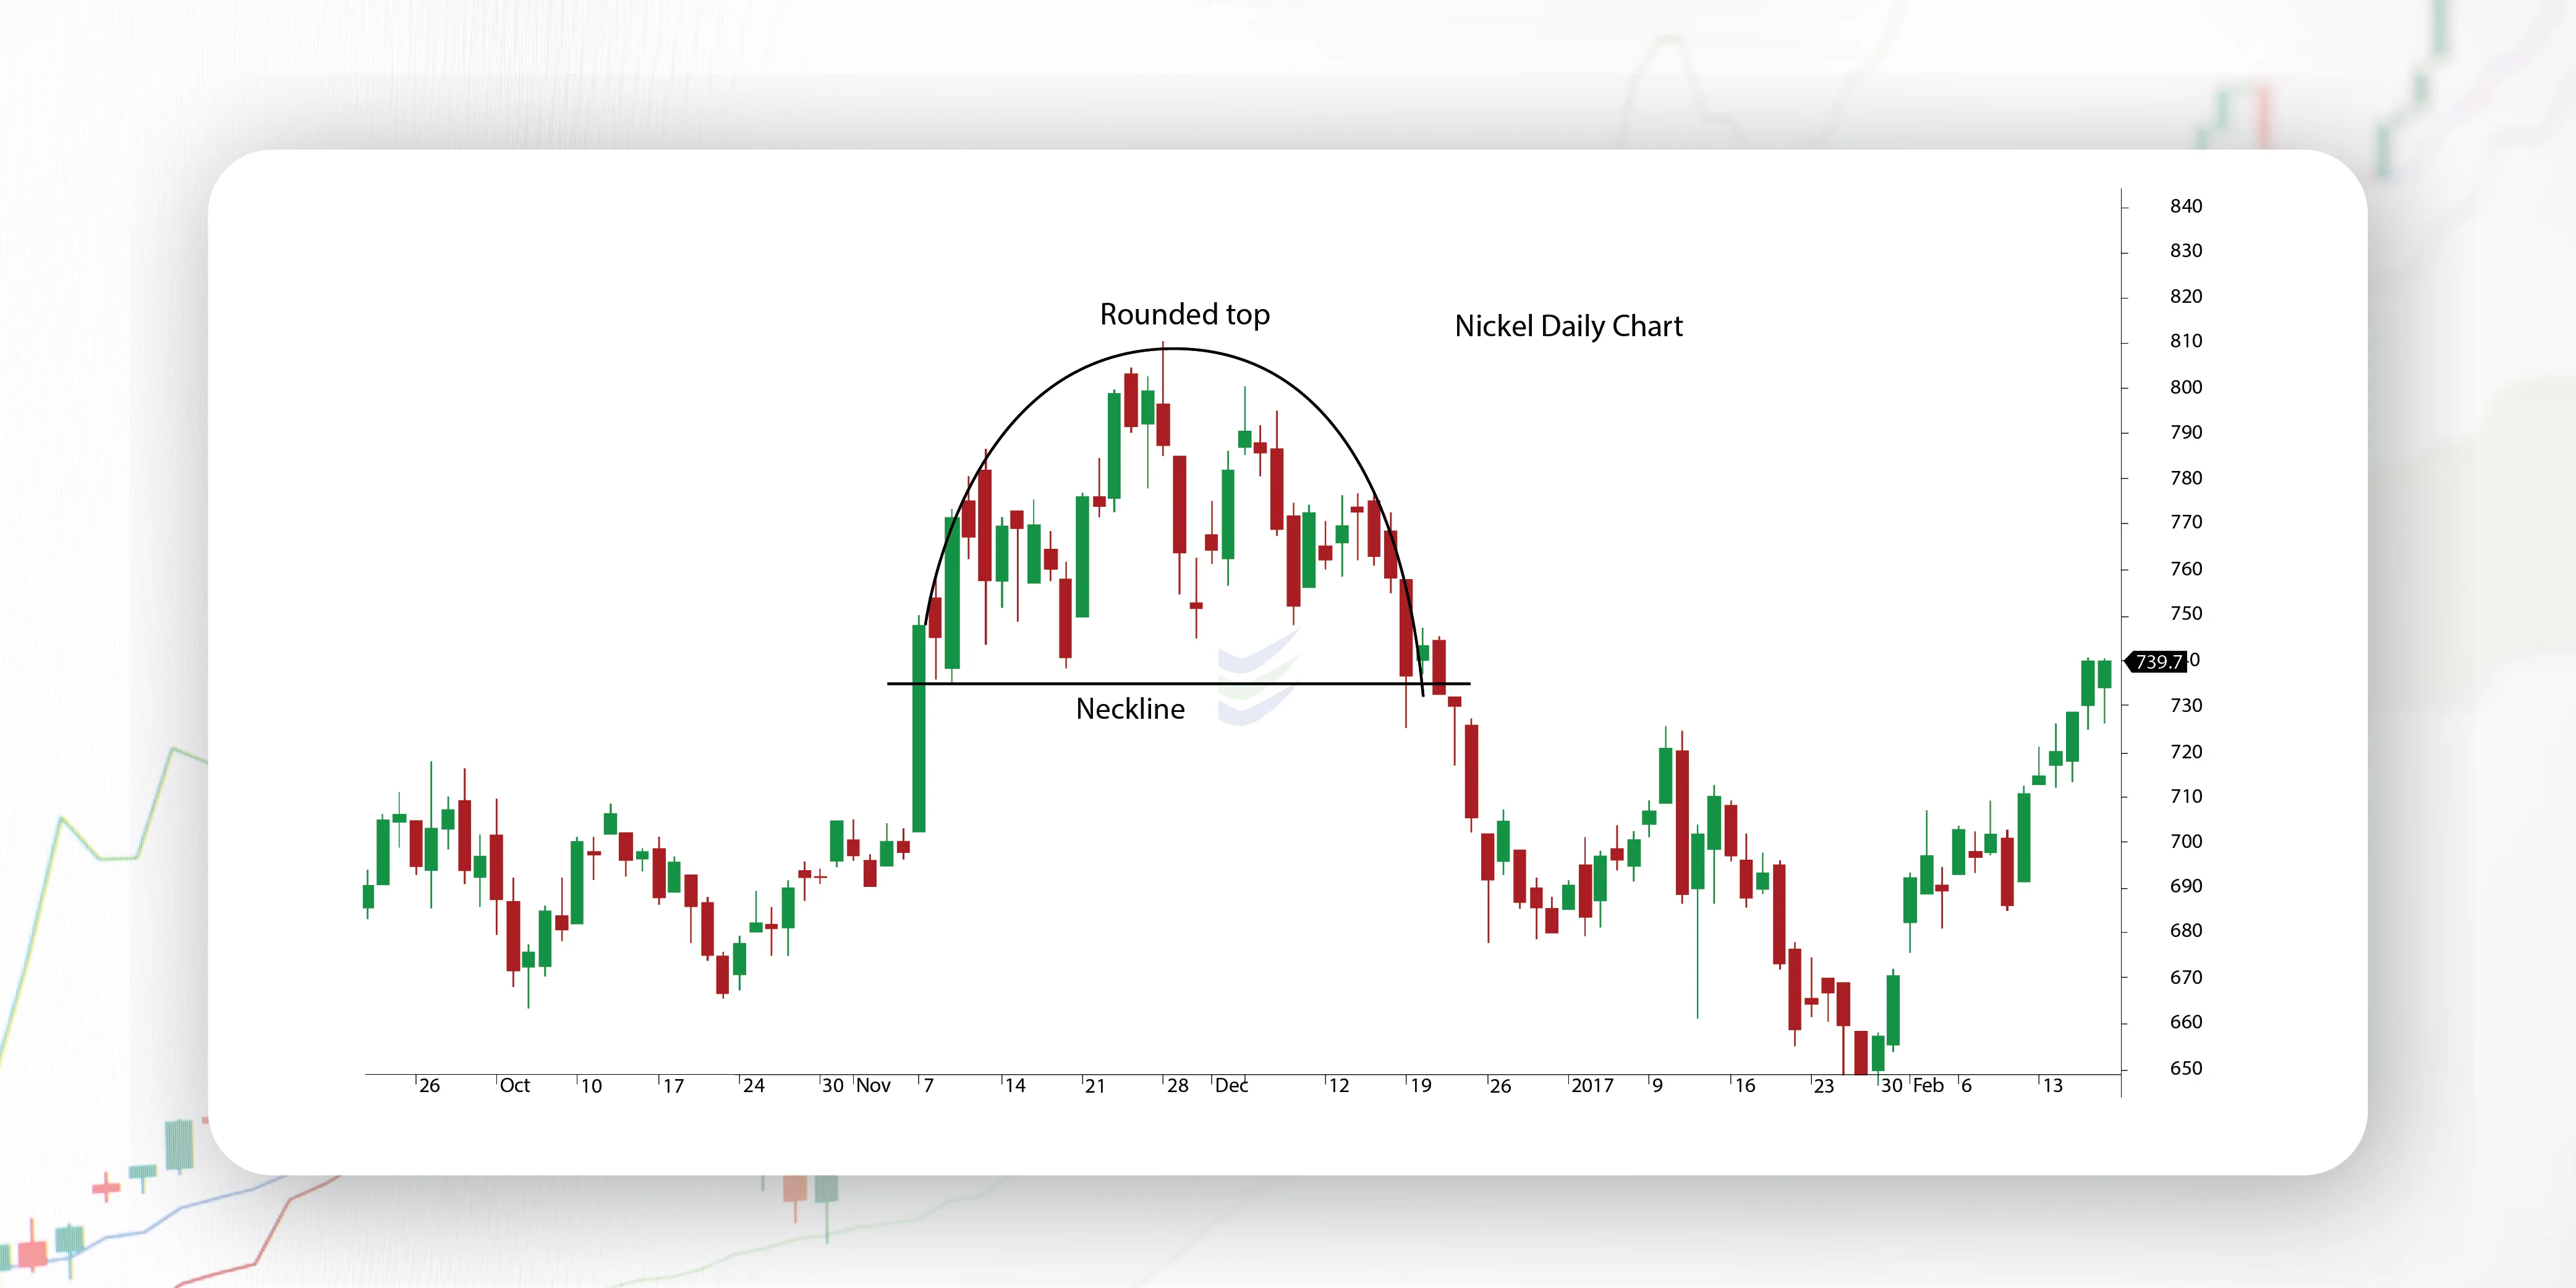
Resistance Line: Traders identify a resistance line at the highest point of the rounded curve. This line represents a level where the price has struggled to move beyond, further confirming the top of the pattern.
Confirmation: The rounding top pattern is considered confirmed when the price breaks below the support level. The support level is typically drawn at the lowest point of the curve, and a breakout below this level suggests that the bears (sellers) are gaining control, potentially leading to a downtrend.
When does a Rounding Top Chart pattern is formed?
A Up in round pattern chart typically forms after a prolonged uptrend and is characterized by a gradual and rounded curvature at the top of the price chart. Here's a detailed explanation of when and how a rounding top pattern is formed:
Uptrend Phase: The formation of a round top chart pattern begins with a sustained uptrend in the price of an asset. This uptrend is often marked by higher highs and higher lows, indicating a bullish sentiment in the market.
Gradual Flattening: As the uptrend progresses, the price levels off and gradually forms a smooth, rounded curve at the top of the chart. Instead of a sharp peak, the price exhibits a saucer-like shape. This flattening suggests that buying interest is waning, and the bullish momentum is fading.
Volume Decrease: During the formation of the round top pattern, trading volume often decreases. This reduction in volume indicates a decline in the conviction of buyers and may signal that market participants are becoming less interested in buying at these higher prices.
Resistance Line: Traders often draw a resistance line at the highest point of the rounded curve. This resistance line represents a level where the price has encountered selling pressure and has struggled to move beyond.
Confirmation Through Support Break: The rounding top pattern is considered confirmed when the price breaks below the support level, which is typically drawn at the lowest point of the rounded curve. This rounding top pattern breakout below support suggests that the bears (sellers) are gaining control, potentially leading to a downtrend.
Change in Market Sentiment: The rounding top pattern indicates a shift from bullish sentiment to potentially bearish sentiment. It suggests that buying interest has diminished, and selling pressure is increasing, potentially leading to a reversal of the prior uptrend.
Trade Opportunities: Traders often look for opportunities to enter short (sell) positions after the rounding top pattern is confirmed. They may place stop-loss orders above the pattern's resistance level and set price targets based on the pattern's height or support levels.
Risk Management: Proper risk management is crucial when trading based on the rounding top pattern. Setting stop-loss orders to limit potential losses and using appropriate position sizing are essential steps.
Confirmation Signals: Traders typically use additional technical indicators, such as moving averages, oscillators, or trendlines, to confirm the rounding top pattern and enhance the reliability of their trading decisions.
What does a Rounding Top Chart pattern indicate?
A rounding top chart pattern indicates a potential reversal of a prior uptrend and is often viewed as a bearish signal in technical analysis. Here's a detailed explanation of what a rounding top pattern indicates:
End of an Uptrend: The rounding top pattern typically forms after a sustained uptrend in the price of an asset. This uptrend reflects a period of bullish sentiment, with buyers dominating the market.
Gradual Flattening: As the uptrend matures, the price starts to lose momentum and gradually forms a smooth, rounded curve at the top of the price chart. Instead of sharp higher highs, the price levels off and shows signs of resistance.
Decreasing Volume: During the formation of the rounding top pattern, trading volume often decreases. This declining volume suggests that the conviction of buyers is waning, and it may indicate that fewer market participants are interested in buying at the elevated prices.
Resistance Line: Traders often draw a horizontal or slightly downward-sloping resistance line at the highest point of the rounded curve. This resistance line signifies a level where the price has struggled to move beyond, and it further confirms the pattern's existence.
Confirmation Through Support Break: The rounding top pattern is considered confirmed when the price breaks below the support level, which is usually marked at the lowest point of the curved pattern. This breakout below support is a key signal that the bears (sellers) are gaining control, potentially leading to a reversal from the prior uptrend to a downtrend.
Shift in Market Sentiment: The rounding top pattern indicates a shift in market sentiment from bullish to potentially bearish. It suggests that the buying interest that propelled the uptrend is diminishing, and selling pressure may be increasing.
Trading Opportunities: Traders often look for opportunities to enter short (sell) positions after the rounding top pattern is confirmed. They may use stop-loss orders placed above the pattern's resistance level to manage risk and set price targets based on the pattern's height or support levels.
Risk Management: Proper risk management is crucial when trading based on the rounding top pattern. Traders should set stop-loss orders to limit potential losses and employ sound position sizing strategies.
Confirmation Signals: To enhance the reliability of the rounding top pattern, traders often use additional technical indicators and analysis tools, such as moving averages, oscillators, or trendlines, to confirm the reversal signal.
How to trade when you see a Rounding Top Chart pattern?
Trading when you identify a rounding top chart pattern involves a structured approach that combines pattern recognition with risk management. Let’s analyze the round top chart pattern with the help of a chart.
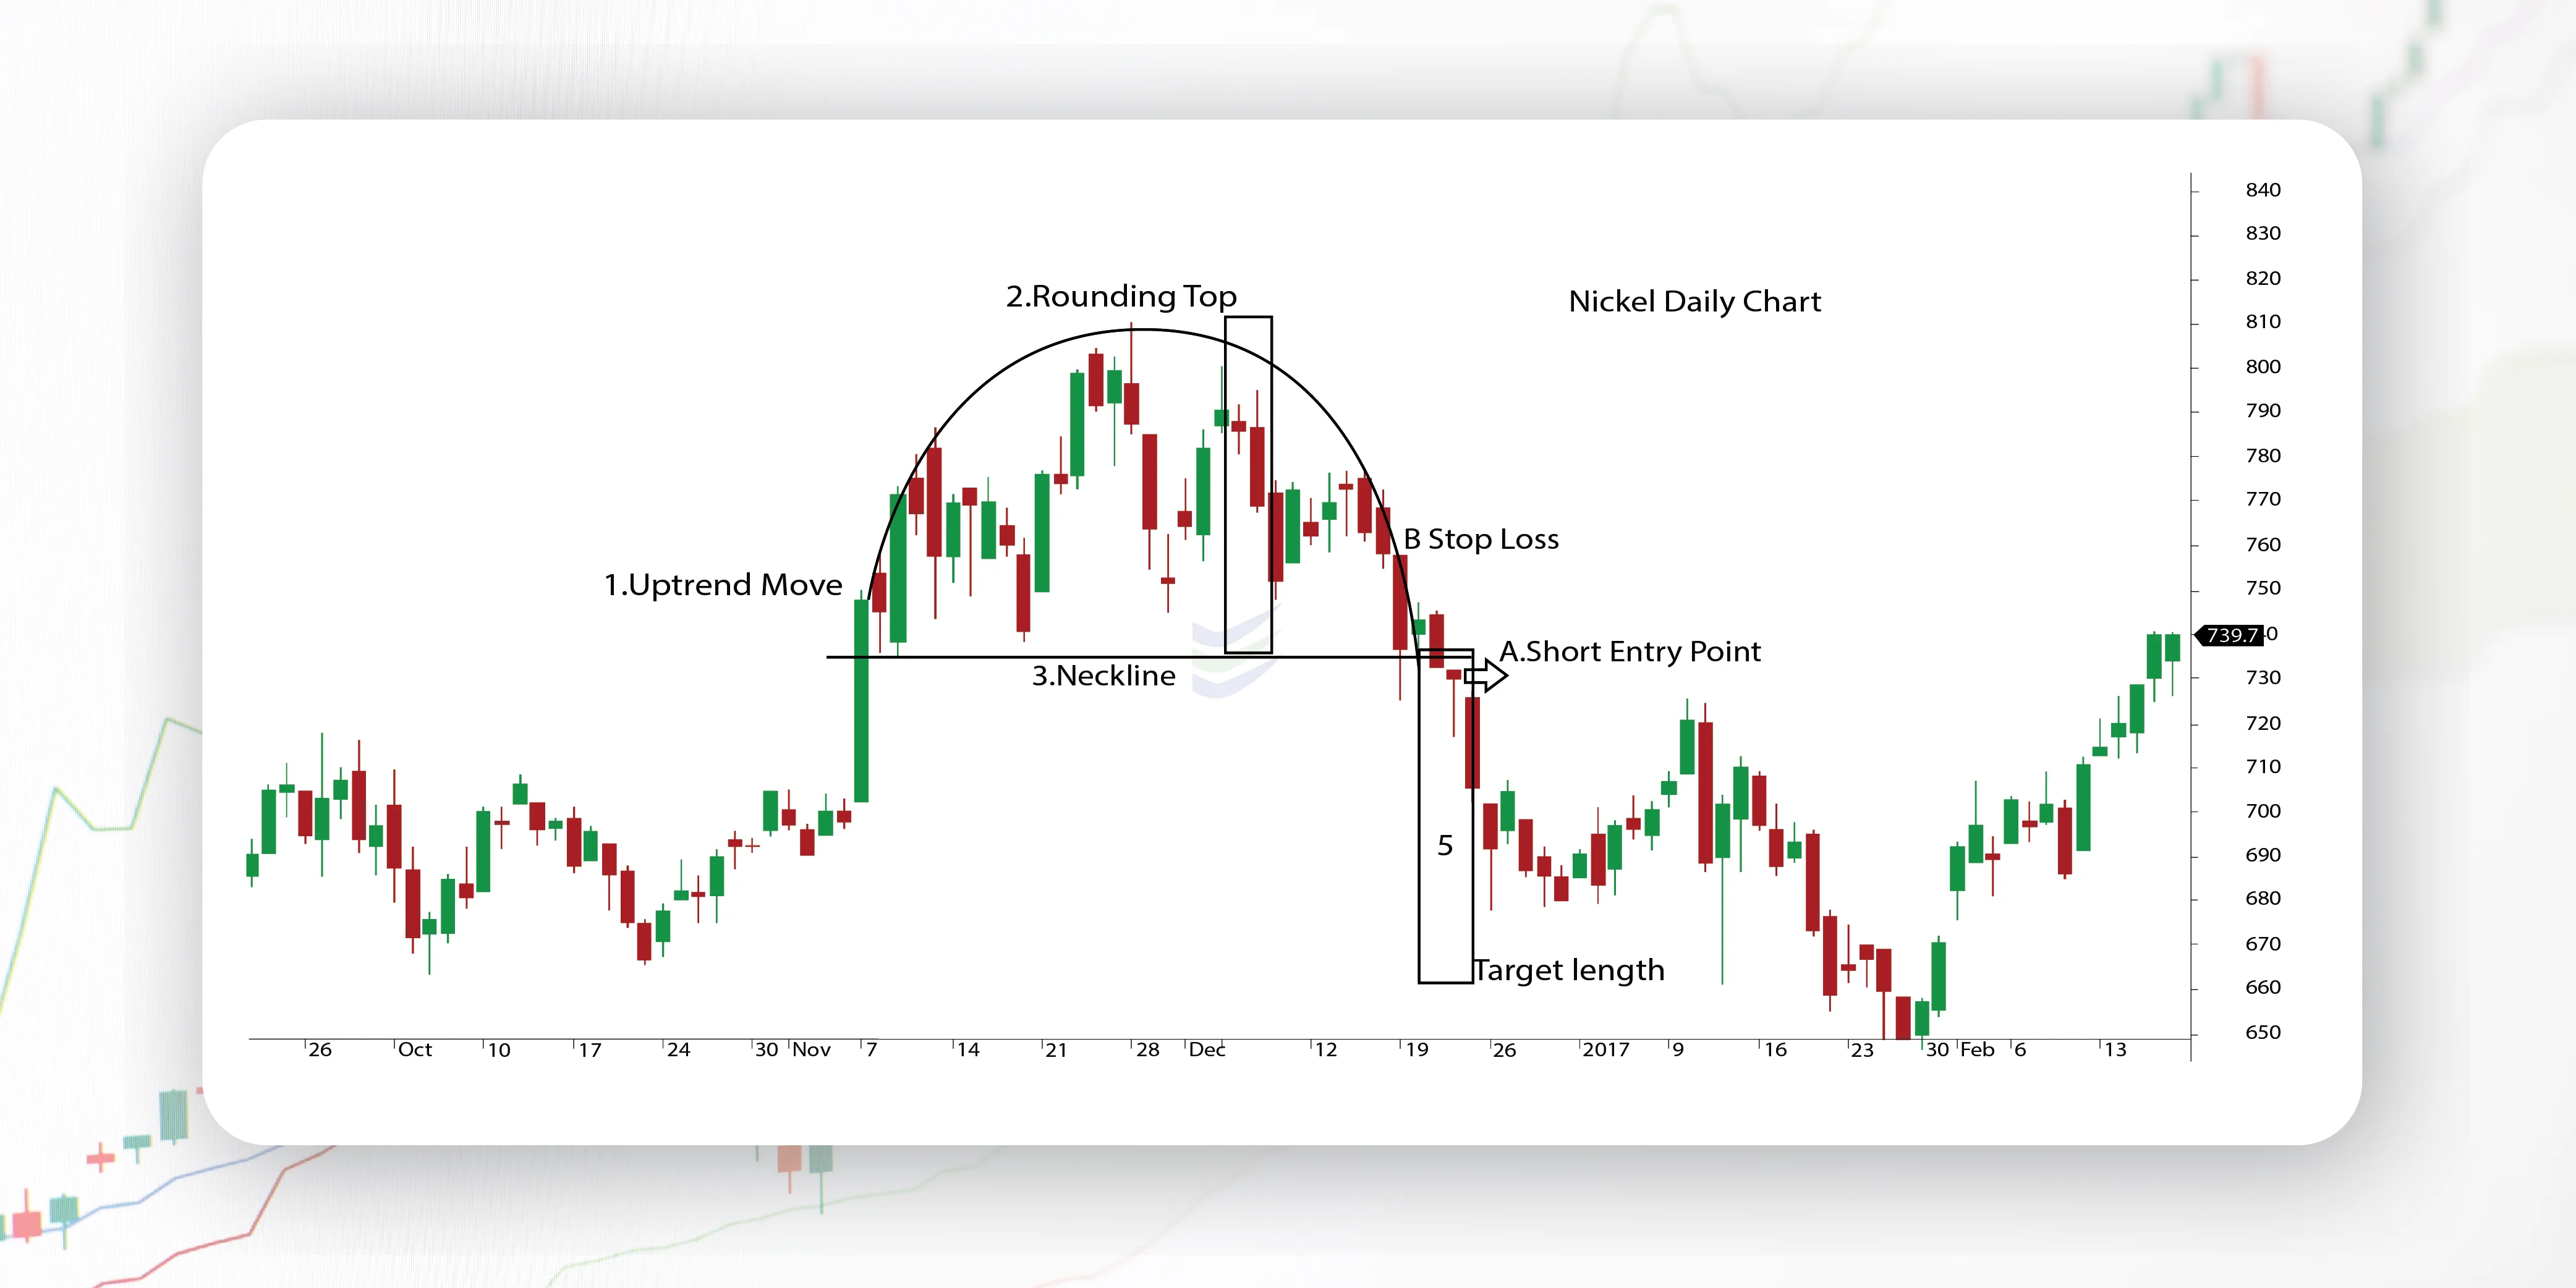
Description of the Rounding Bottom Channel pattern
1 – Long Sell Entry
2 – Stop loss order will be executed
3 – Take Profit
4 - Height of the actual pattern
5 - Profit Target Distance (same distance as 4)
Here's a detailed step-by-step guide on how to trade when you see a rounding top pattern:
Confirm the Pattern: Ensure that the rounding top pattern meets the necessary criteria: a sustained uptrend, a smooth and rounded curve at the top, decreasing volume during its formation, and a breakout below the support level.
Determine the Trade Direction: A rounding top pattern indicates a potential reversal from a bullish (uptrend) to a bearish (downtrend) market sentiment. Therefore, consider taking a short (sell) position.
Entry Point: Wait for confirmation of the breakout below the support level. This confirmation typically includes a candlestick closing below support, preferably with strong volume.
Set a Stop-Loss: Always use a stop-loss order to limit potential losses. Determine a level where you would exit the trade if the price moves against you. This level is usually set just above the breakout point or a nearby resistance level.
Establish a Price Target: Calculate a price target based on the pattern's height (the distance between the resistance and support levels) and project this distance downward from the breakout point. This provides an estimate of where the price may reach, but it's not a guarantee.
Risk-Reward Ratio: Evaluate the risk-reward ratio of the trade. Ensure that the potential reward (distance to the price target) justifies the risk (distance to the stop-loss). A favourable risk-reward ratio is typically 2:1 or better.
Position Size: Determine the size of your position based on your risk tolerance and the size of your trading account. Avoid overleveraging, as it can lead to significant losses.
Monitor the Trade: Keep a close eye on the round pattern trading as it progresses. Watch for signs of continued downward momentum and potential support levels where the price may bounce or stall temporarily.
Partial Profit-Taking: Consider taking partial profits as the price approaches your price rounding top pattern target or significant support levels. This locks in some gains and reduces risk.
Trailing Stop: Once the price has moved in your favour, you can use a trailing stop-loss to protect profits. This means adjusting your stop-loss downward as the price declines to lock in gains while giving the trade room to breathe.
Exit Strategy: Have a clear exit strategy in place. If the price reaches your price target or shows signs of bouncing, consider closing the trade to secure your profits.
Adapt to Market Conditions: Be flexible and adapt to changing market conditions. Not all rounding top patterns lead to successful reversals, so be prepared to exit the trade if the market sentiment turns bullish again.
Keep Learning: Continuously improve your trading skills and knowledge. Learn from both successful and unsuccessful trades to refine your trading strategy.
Frequently asked questions
What is the price target for a rounding top pattern?
Traders often estimate a price target by measuring the height of the round chart pattern (the distance between the resistance and support levels) and projecting this distance downward from the breakout point.
Can rounding top patterns fail to reverse the trend?
Yes, like all technical patterns, rounding top patterns can fail, resulting in false signals. Traders should use additional analysis and risk management techniques for confirmation.
Are there variations of the rounding top pattern?
Variations include asymmetrical rounding tops (with unequal sides), extended rounding tops (prolonged pattern formation), and triple tops (a series of three rounded peaks).
How long does it take for a rounding top pattern to form?
The duration of a rounding top pattern can vary, but it often spans several weeks to months, depending on the timeframe of the chart being analysed.
Can rounding top patterns be applied to different timeframes?
Yes, rounding top patterns can be observed on various timeframes, from intraday to daily or weekly charts, making them applicable to different trading styles.
What are some common pitfalls when trading rounding top patterns?
Common pitfalls include ignoring confirmation signals, neglecting risk management, and not adapting to changing market conditions. Traders should be aware of these pitfalls when trading based on this pattern.
What is a single top pattern?
The term "single top pattern" is not a standard technical chart pattern in traditional technical analysis. However, it appears to be a reference to a single or solo occurrence of a topping pattern, which typically indicates a potential reversal of an uptrend.
What is a half circle pattern in trading?
The term "half circle pattern" is not a recognized or standard technical chart pattern in trading. It is not a widely-used concept in technical analysis. It's possible that this term is being used informally or in a specific context that is not widely recognized.