Knowledge Center Technical Analysis
Technical Chart
Trend in Technical Analysis:

What is a Trend
The trend is an important conception in Technical Analysis.
A market trend is the price path that has been followed over time, as determined by previous highs and lows. The movement of these peaks and troughs defines whether the market is trending upwards, downwards, or staying relatively flat.
Types of Trends:
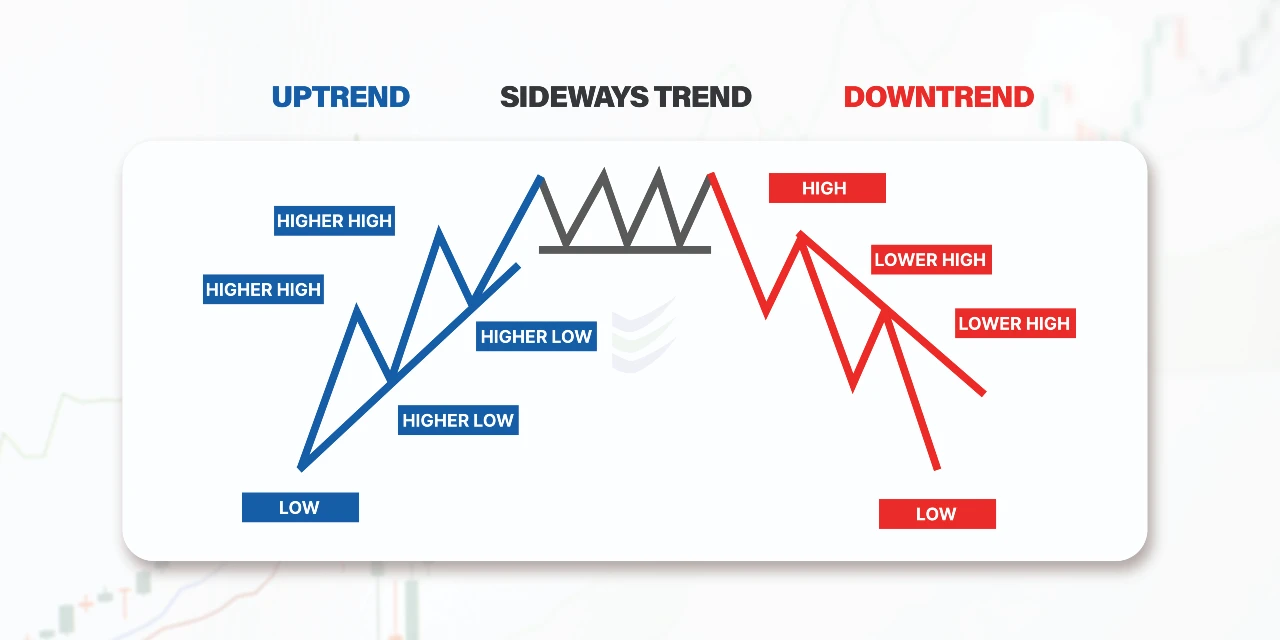
There are three types of trends:
-
Uptrend:
It's a positive trend where the prices are going up or rising over a period of time. Refer to the below uptrend chart patterns:
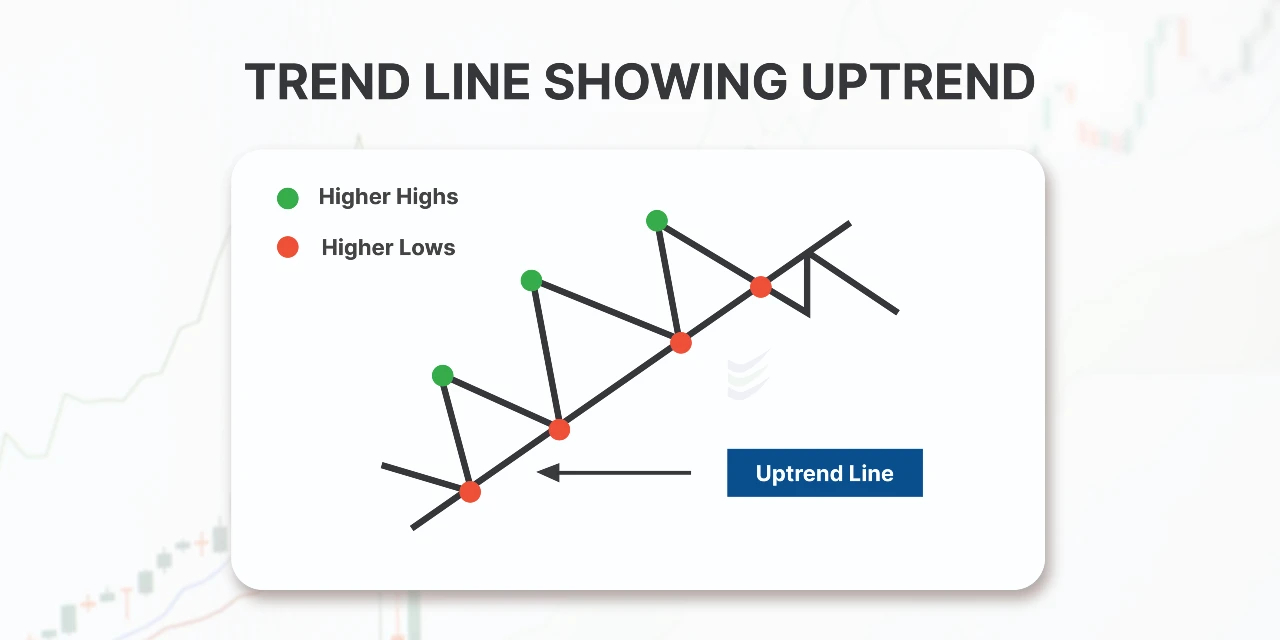
When the direction of price movement consistently creates new high points and higher low points, we call it an uptrend on a Silver Chart.
These new peaks, higher than the previous ones, are referred to as "higher highs," and the low points that are also higher than before are called "higher lows."Typically, when fundamental and psychological factors improve, it leads to an upward trend. The duration of an uptrend can vary widely, ranging from a few weeks to several years, depending on the underlying conditions and the force driving the trend.
When a commodity market experiences a long-term uptrend, it's often called a "bull market." In such a market, there's a prevailing optimism that commodity prices will continue to rise. During an uptrend, it's often considered a good strategy to purchase commodities when their prices temporarily dip.
-
Downtrend:
A downtrend in the market is when prices are generally moving in a direction where they are going down or falling over a period of time. It's like going downhill, where the low points keep getting lower, indicating a negative trend. Refer to the below downtrend chart patterns:
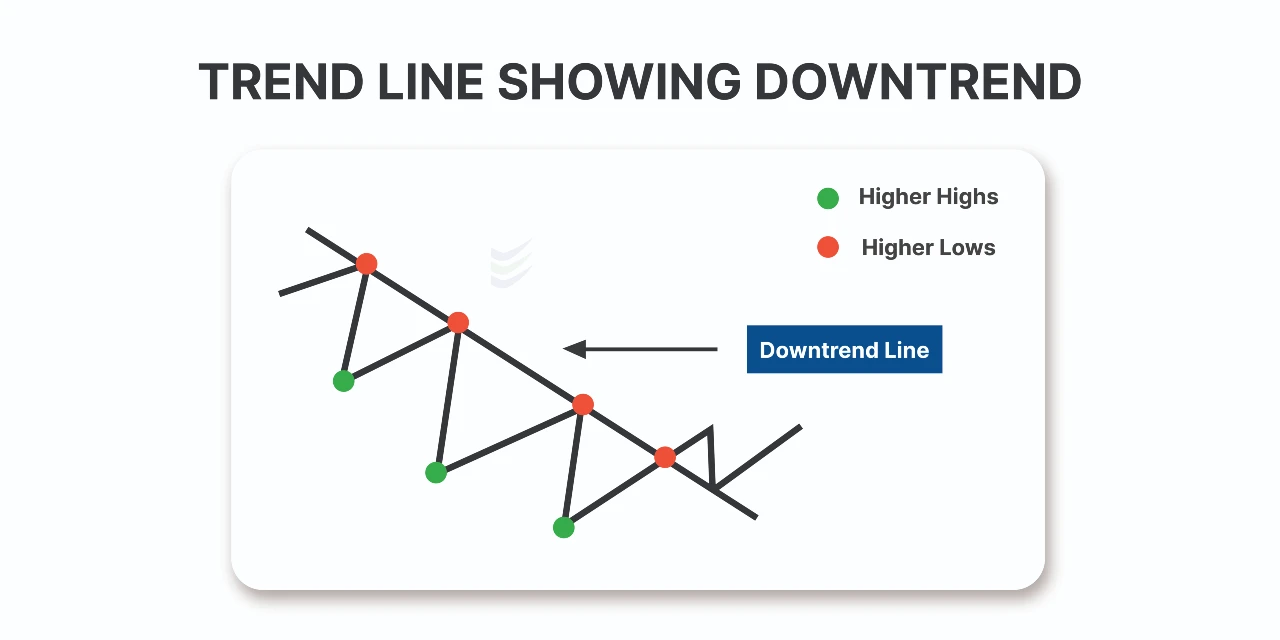
In a downtrend, crude oil displays a pattern of lower highs and lower lows, indicating a consistent decrease in both peaks and bottoms. This pattern emerges due to weakening psychological or fundamental factors and can persist for varying durations, ranging from weeks to years.
During this downtrend, a strategic approach involves selling crude oil during upward bounces. This decision is influenced by the prevailing market pessimism, suggesting further potential declines. This prolonged downtrend is formally termed a 'Bear Market.' Traders often implement a strategy of selling at higher trend lines or nearby resistance points, with the anticipated target being new lows, as indicated by the chart pattern
-
Sideway Trend
A sideways trend in the market is when prices are mostly moving within a range, neither going significantly up nor down. It's like a flat road where prices stay relatively stable, not showing a clear upward or downward trend. Refer to the below sideways chart patterns.
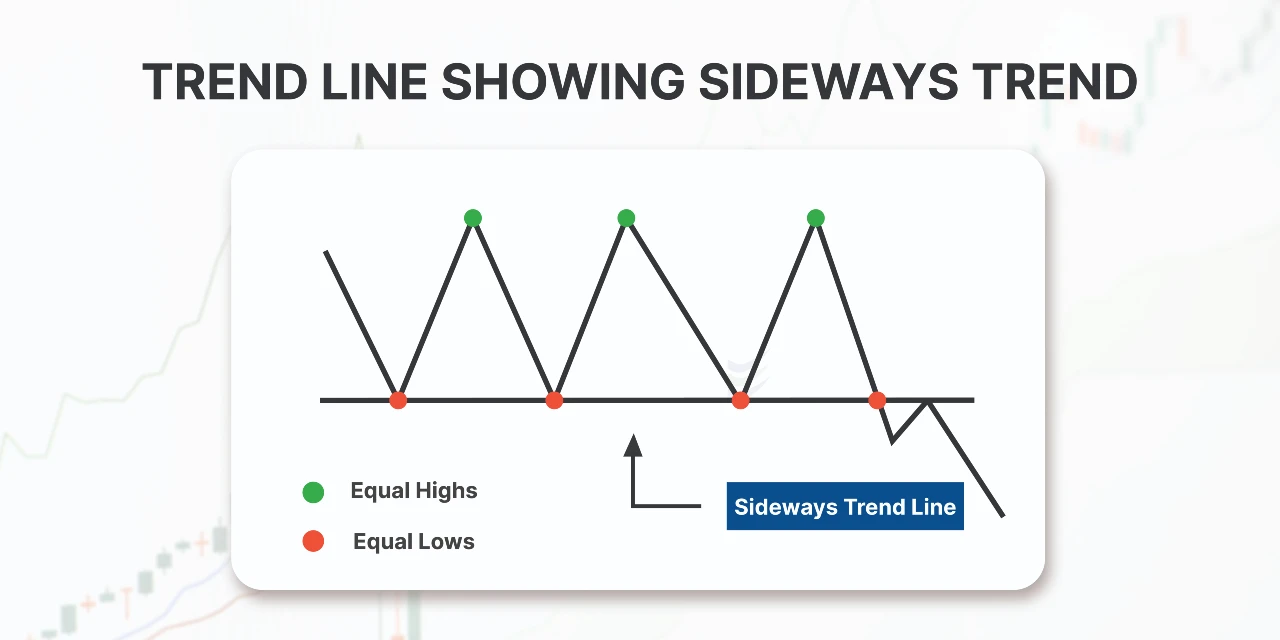
When natural gas shows a sideways trend on the chart, it means the prices are stable. This pattern is not influenced by psychological factors or fundamental news. Sideways trends can last from a few weeks to several years.
Major things to focus in side way pattern is :
-
Buy Natural Gas when it hits support levels.
-
Sell when it reaches resistance levels.
-
If support or resistance is broken, consider new trades, focusing on overall support and resistance areas.
Support line:
It shows the level at which the price tends to stop falling and might even bounce back up.
Resistance line:
It shows the level at which the price tends to stop rising and might reverse course and go down.
Key Takeaways:
Utilizing trend analysis and trend lines is a crucial part of technical analysis, but it's essential to remember that it's just one tool among many. When a trend line is breached, consider it a signal that the trend might be shifting. However, it's prudent to rely on other tools and signals to confirm this potential change in trend.
Frequently Asked Questions:
What is a trend in stock market trading?
A trend in stock market trading is the direction in which the price of a stock is moving upwards, downwards, or sideways.
What are trendlines used for?
Trendlines help traders identify and visualize trends in the price of an asset over time.
How do I draw a trendline?
To draw a trendline, connect two or more significant lows in an uptrend or two or more significant highs in a downtrend.
How do you know if a stock is in an uptrend?
If you can connect a series of chart low points sloping upward, then the stock is in an uptrend.
What is a resistance trendline?
A resistance trendline is drawn above the price, connecting lower highs, and it indicates a level where the price often encounters resistance and may reverse downward.