Knowledge Center Technical Analysis
Technical Chart
Gap/Windows charting pattern
In this session, we will explore the following subjects:
-
Understanding the Windows/Gap Pattern
-
Identifying Gap Up and Gap Down occurrences in a chart
-
Recognizing how Gaps can act as resistance/support levels
-
Visual examples illustrating Gap Up and Gap Down scenarios
-
Categorization of different types of Gaps
1. Understanding the Windows/Gap Pattern
A gap, also known as a window in Japanese candlestick charting or technical analysis, refers to an unfilled space or interval on a price chart, indicating an area where no trading transactions have occurred.
During an upward trend, a gap is formed when the highest price of one day is lower than the lowest price of the following day.
Conversely, during a downward trend, a gap forms when the lowest price of one day is higher than the highest price of the next day.
For example, if a stock reaches a high of Rs. 200.00 on Wednesday, opens at Rs. 204.50 on Thursday, drops to Rs. 203.00 in the early hours, then rises again to Rs. 205.00 without any trading occurring between the Rs. 200.00 and Rs. 203.00 price range, this untraded zone appears as a gap on the chart.
Understanding these gaps and their patterns before market movements can be pivotal for making well-informed trading decisions. Gaps often act as significant indicators of market sentiment, providing valuable insights for traders and investors.
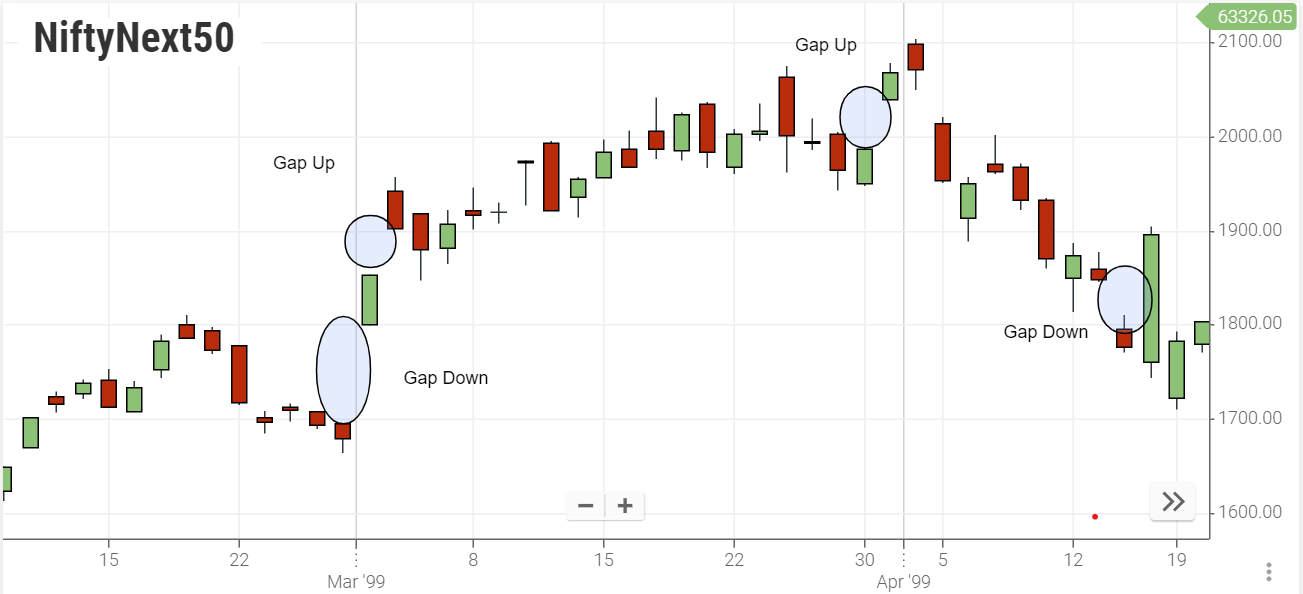
2. Identifying Gap Up and Gap Down occurrences in a chart
Price charts frequently display empty spaces, referred to as gaps, indicating periods when no shares were traded within a specific price range. Typically, these gaps occur between the market close of one trading day and the opening of the next. There are two main categories of gaps:
-
up gaps
-
down gaps.

A gap down occurs when the opening price on Day 2 is lower than the closing price on Day 1. It is clear that psychological factors significantly influence the formation of gaps in trading patterns.
3. Recognizing how Gaps can act as resistance/support levels
Gaps operate in the following manner:
-
When the price experiences a downward gap, the gap acts as a resistance level.
-
Conversely, if prices rise, the gap can serve as support for future crude oil prices.
Now, let's delve into examples illustrating how gaps function as support and resistance.
The below illustrates a Gap Up chart pattern acting as a support for prices.
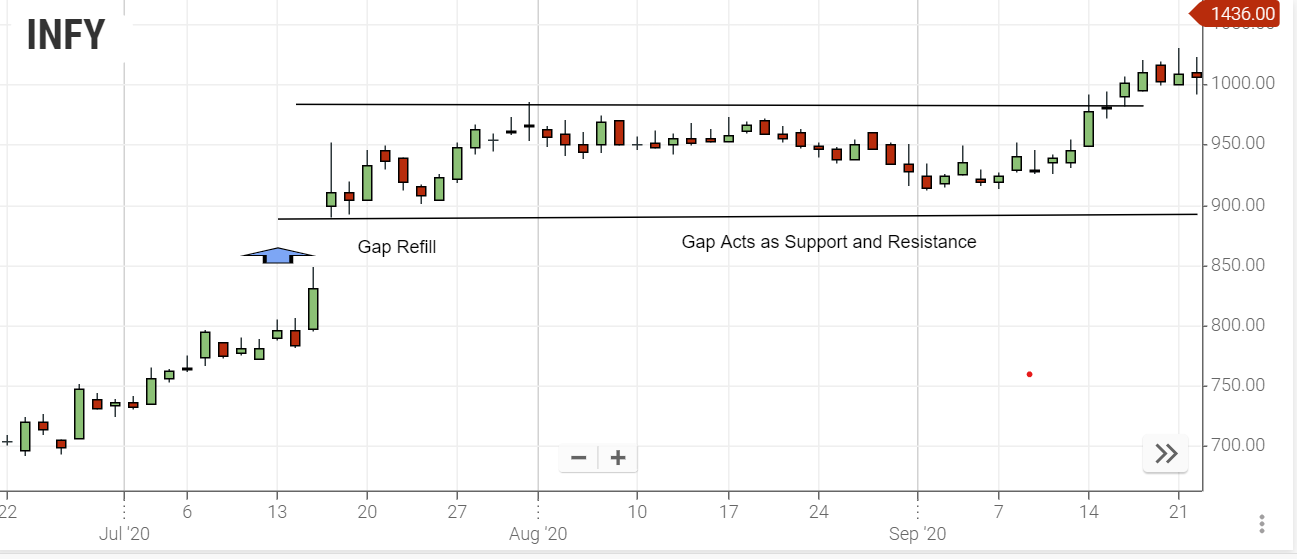
Analysis indicates that after a gap, the prices often aim to fill the gap, treating it as a void in the price chart that needs to be filled. Once the gaps are filled, the price tends to reverse its direction and move in the direction of the gap. In the provided illustration chart, this movement is observed to be upwards, showcasing how the gap functions as a support level.
Traders typically perceive anything below the gap as a point of no return, suggesting that the price is unlikely to revert to that level. The analysis of the illustration below demonstrates several instances of both Gap Up and Gap Down occurrences, providing valuable insights:
-
Gaps down can serve as areas of resistance.
-
Conversely, gaps up can act as areas of support.
4. Visual examples illustrating Gap Up and Gap Down scenarios
5. Categorization of different types of Gaps
Gaps can be categorized into four types:
A. Common Gap
B. Breakaway Gap
C. Runaway Gap
D. Exhaustion Gap
A. Common Gap
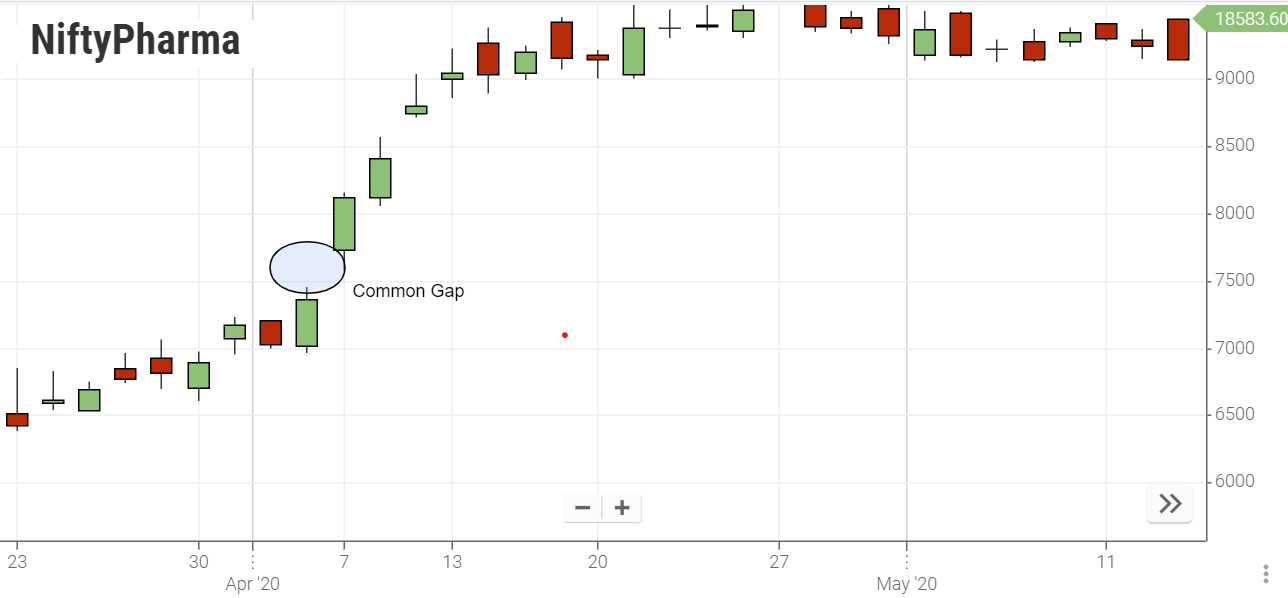
A common gap, also referred to as an area gap, pattern gap, or temporary gap, typically occurs when trading is confined within a short span of time between support and resistance levels. It happens in a sideways market where the price neither shows an uptrend nor a downtrend but moves within a relatively narrow range, forming no distinct trends. Common gaps can also be observed in price congestion. Usually, the price tends to move back or rise to fill these gaps in the subsequent days. However, if the gap is filled, it holds limited forecasting significance.
B. Breakaway Gap
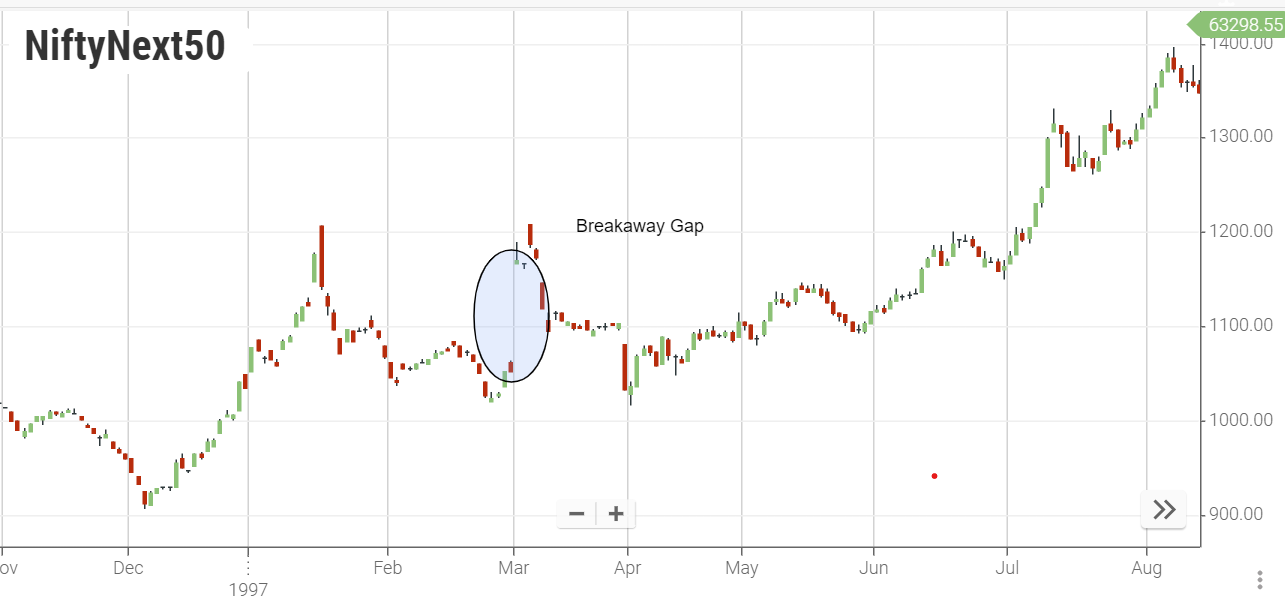
A breakaway gap occurs when prices break away from a period of congestion or consolidation. Specifically, when the price breaks away from a triangle pattern (either ascending or declining) with a gap, it implies a significant change in market sentiment, indicating a powerful upcoming move. Monitoring the trading volume is crucial in this scenario. If the volume is heavy after the gap forms, there is a higher probability that the market will not return to fill the gap. On the other hand, if the price breaks away on low volume, there is a possibility that the gap will be filled before prices resume their trend.
C. Runaway Gap
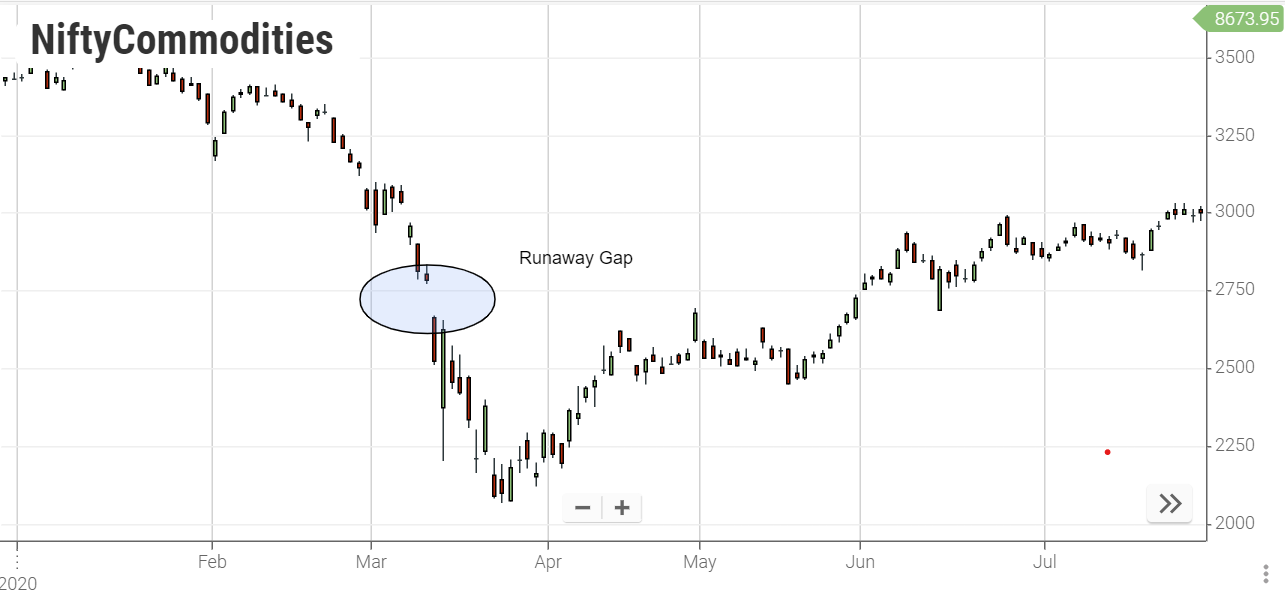
A Measuring Gap, also known as a runaway gap, typically forms around the halfway point of a price move. Unlike other types of gaps, it is not associated with congestion areas but is more likely to occur approximately in the middle of a rapid advance or decline. This type of gap can be utilized to estimate roughly how much further a price move is likely to extend. Runaway gaps are distinct in that they are not usually filled for a considerable period of time, indicating a strong and sustained market trend.
D. Exhaustion Gap
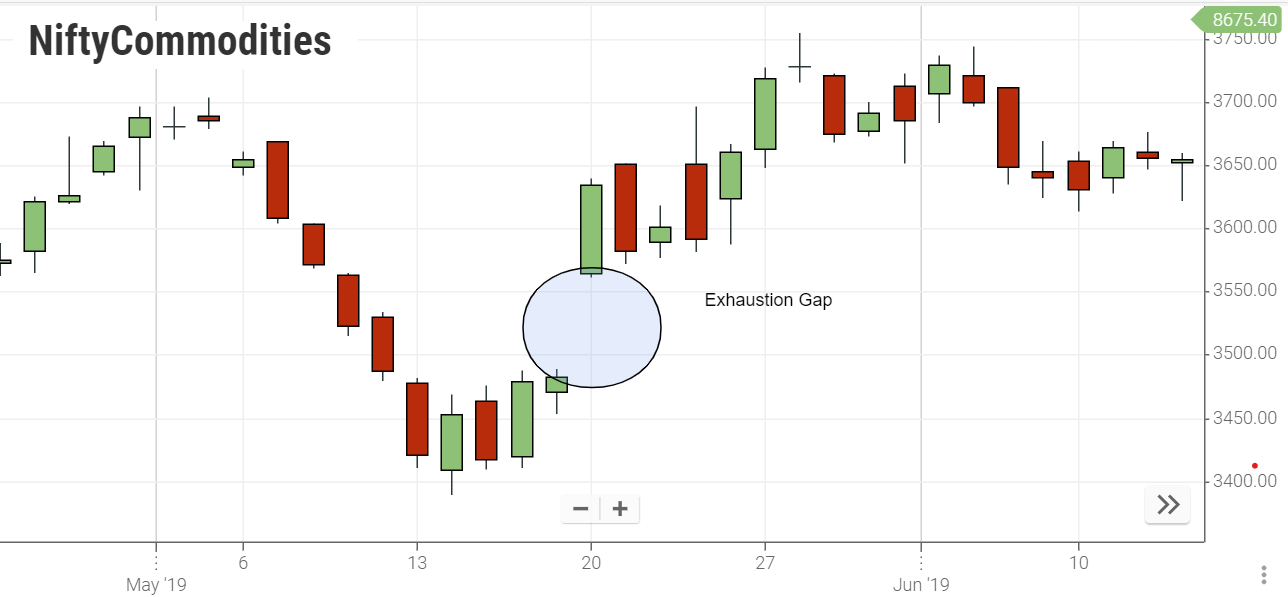
An exhaustion gap signals the conclusion of a price move and is typically linked to a rapid, straight-line advance or decline in the market. Distinguishing between a measuring gap and an exhaustion gap can be done by observing a reversal day. If an exhaustion gap forms at the top accompanied by heavy trading volume, there is a substantial likelihood that the market is exhausted and the prevailing trend has come to a halt. However, it's important to note that an exhaustion gap should not be interpreted as a major reversal but rather as an indication of a temporary pause or consolidation in the market trend, often followed by the development of other chart patterns.
Key Takeaways
-
Gaps, also known as windows, hold significant importance in technical analysis.
-
A gap signifies an area on a chart where no trading activities occur.
-
Gaps often serve as continuation patterns, indicating the existing trend's likelihood to persist after the gap.
-
In an uptrend, a gap forms when the highest price of one day is lower than the lowest price of the following day.
-
In a downtrend, a gap occurs when the lowest price of one day is higher than the highest price of the next day.
-
Downward gaps act as gap resistance once formed, while upward gaps can function as future support levels.
-
There are four types of gaps: common gap, breakaway gap, runaway gap, and exhaustion gap.
Frequently Asked Questions
-
What is a stock gap?
A stock gap, also known as a window in Japanese candlestick charting, refers to an unfilled space on a price chart where no trading transactions have occurred. It indicates an interval where no trading activities took place, creating a gap between the prices of consecutive trading days.
-
How do you predict the gap up and gap down?
Gap up and gap down occurrences in a chart can be predicted by analyzing market trends and identifying periods of congestion or consolidation. Heavy trading volume after a gap formation suggests the gap may not be filled, whereas low volume implies the possibility of the gap being filled before the trend continues.
-
How do you trade gap- up and gap-downs?
Traders can utilize gap up and gap down patterns to make informed trading decisions. Gap down can act as a resistance level, while gap up can function as future support. Observing volume and market sentiment is crucial to determining whether the gap will be filled or if the trend will continue.
-
What do gaps indicate in chart analysis?
Gaps in chart analysis show where no trades occurred, signaling sudden price shifts and potential market changes. They help traders identify support, resistance, and trends, aiding in decision-making.
-
How are breakaway gaps different from runaway gaps?
Breakaway gaps occur after consolidation, indicating a strong market shift. Runaway gaps form mid-move, representing rapid price changes. Runaway gaps often sustain trends, while breakaway gaps suggest significant market sentiment changes. Understanding these differences is essential for traders.