Knowledge Center Technical Analysis
Technical Chart
Identification and Understanding of Price Channels
Utilizing Price or Trading Channels to Visualize Chart Trends and Identify Potential Reversal Points
What constitutes a price or trading channel?
When the value of an asset consistently trades between two trend lines over an extended period, it is considered to be within a trading channel. This channel can be created using either two manually drawn trend lines or a channel tool available in your charting software. Regardless of the method chosen, the process of placing them on your chart is a manual one.
Identifying a price channel
When the price exhibits an upward trend, it is referred to as an ascending channel.

In a downtrend, the price is termed a descending channel.
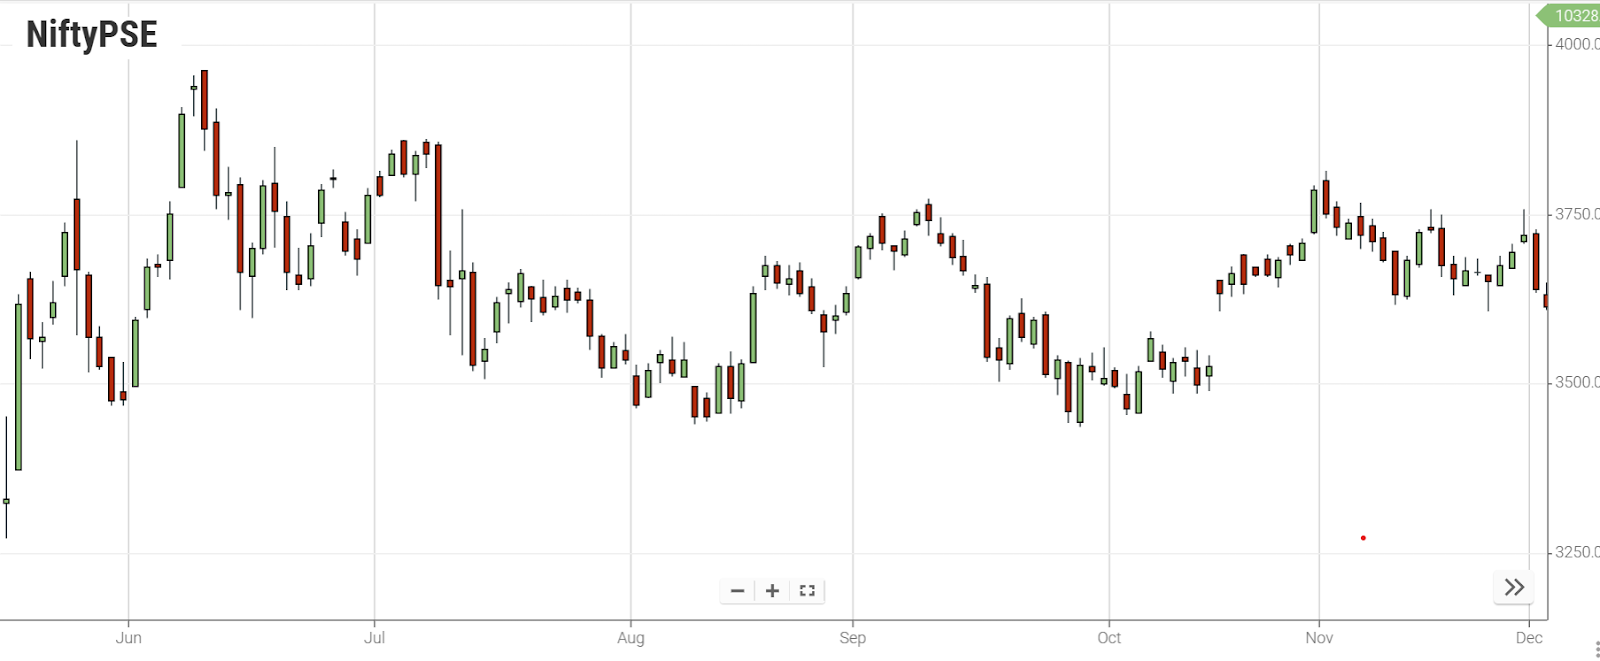
When the price fluctuates within a horizontal support and resistance zone, it is identified as a horizontal channel.
In the presence of an uptrend or downtrend, it is typically possible to delineate a channel. Drawing two trend lines is essential for this process—one connecting two lows and another connecting two highs. The occasional piercing of trend lines by two or more candles is acceptable; however, the majority of candles should remain within the established boundaries.
What Causes the Price to Remain Confined Within a Channel?
Channels operate as a self-fulfilling prophecy, functioning effectively due to their widespread recognition and utilization by traders. The prevalence of traders identifying a channel contributes to its increased usage as a reference for entering and exiting trades.
For instance, consider the image on the right, which portrays a hypothetical asset that has never undergone trading. Initially valued at Rs. 1, the demand surges, causing the price to escalate to Rs. 4.5.
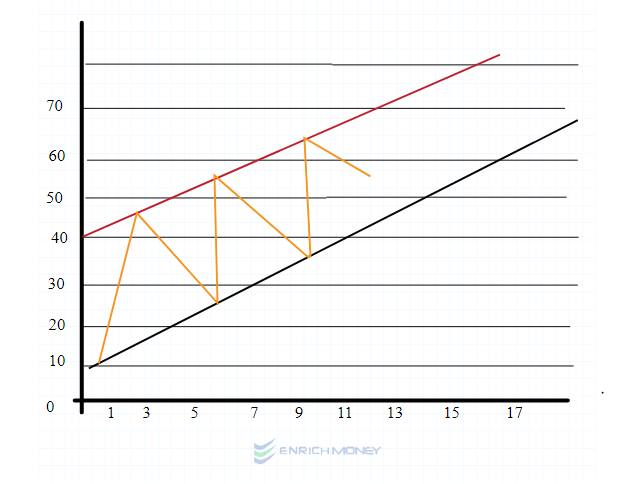
In the chart, you can observe that at the price of Rs. 4.5, buyers who initially purchased at Rs. 1 may deem it a substantial profit and begin selling. With an increase in sellers, the asset experiences more supply than demand, leading to a decline in price. To safeguard their profits and mitigate losses in the sudden downtrend, an increasing number of individuals opt to sell, causing the price to drop to, let's say, Rs. 2.
At this point, traders might perceive the asset as reasonably priced again, considering its previous peak at Rs. 4.5, prompting them to resume buying. However, when the asset hits Rs. 5, traders may feel it is overvalued, given its past peak at Rs. 4.5. To secure profits, they initiate selling, instigating a new downward trend. As the asset reaches Rs. 2.5, it becomes attractive once more in comparison to Rs. 5, leading to a resurgence in buying activity.
Traders are able to observe the current price movements, depicted as the zigzag pattern on the chart. In the illustration on the right, this zigzag pattern generates the highs labeled as number 10 and the lows marked as number 20. Traders leverage these high and low points to draw trend lines, giving rise to the formation of a channel. This channel remains a viable trading strategy for a duration, yet its validity is contingent upon fundamental shifts that may lead to a breakout, rendering the channel obsolete.
Incorporating Channels for Informed Trading Decisions
Utilizing a channel for trading can be simplified by assuming the asset will remain within established boundaries. A short trade is initiated when the price touches the upper boundary, while a long trade is executed at the lower boundary.
In the depicted chart, the price adheres to the ascending trend lines, forming an ascending channel and presenting opportunities for both buying and selling.
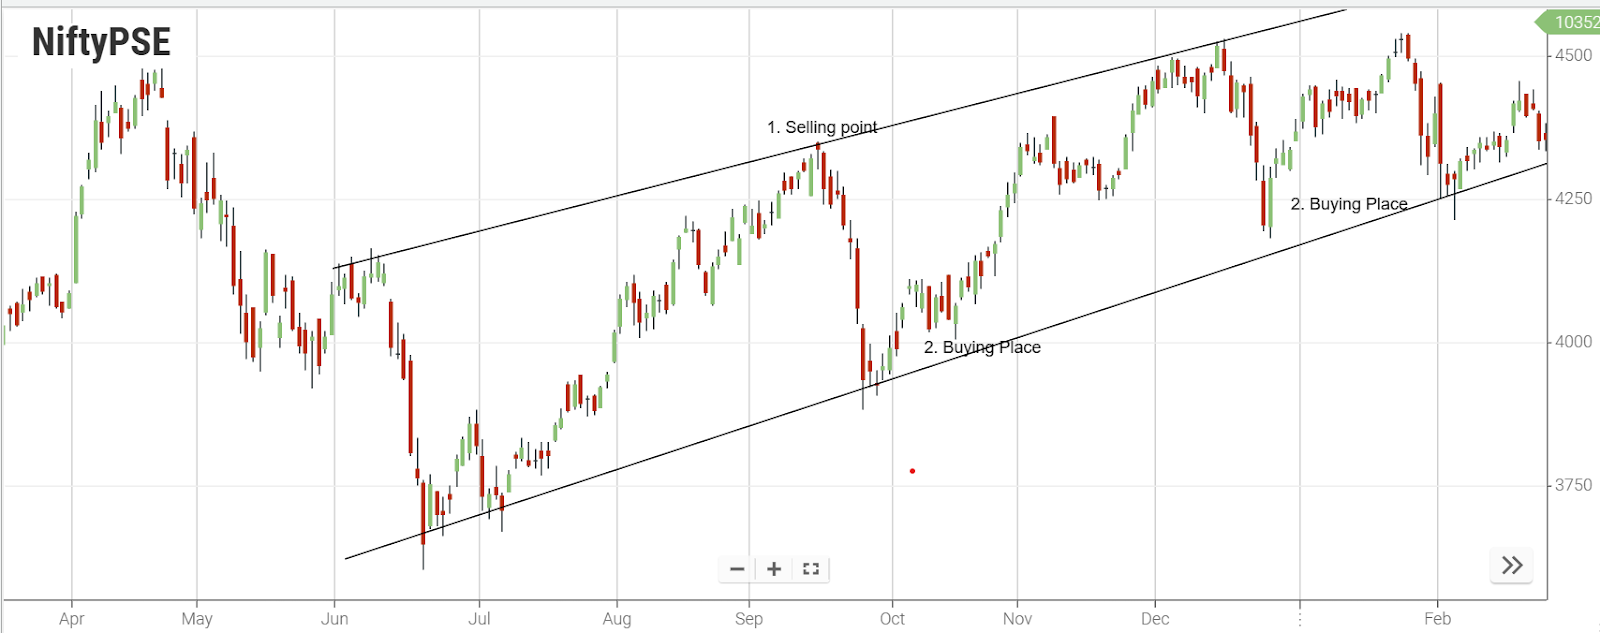
-
Potential sales opportunities
-
Potential buying opportunities
An alternative approach to incorporating channels in trading involves trading breakouts. In this scenario, a trade is initiated as soon as a candle opens and closes outside the channel, opting for a long trade when the upper boundary is breached and a short trade when the lower boundary is surpassed.
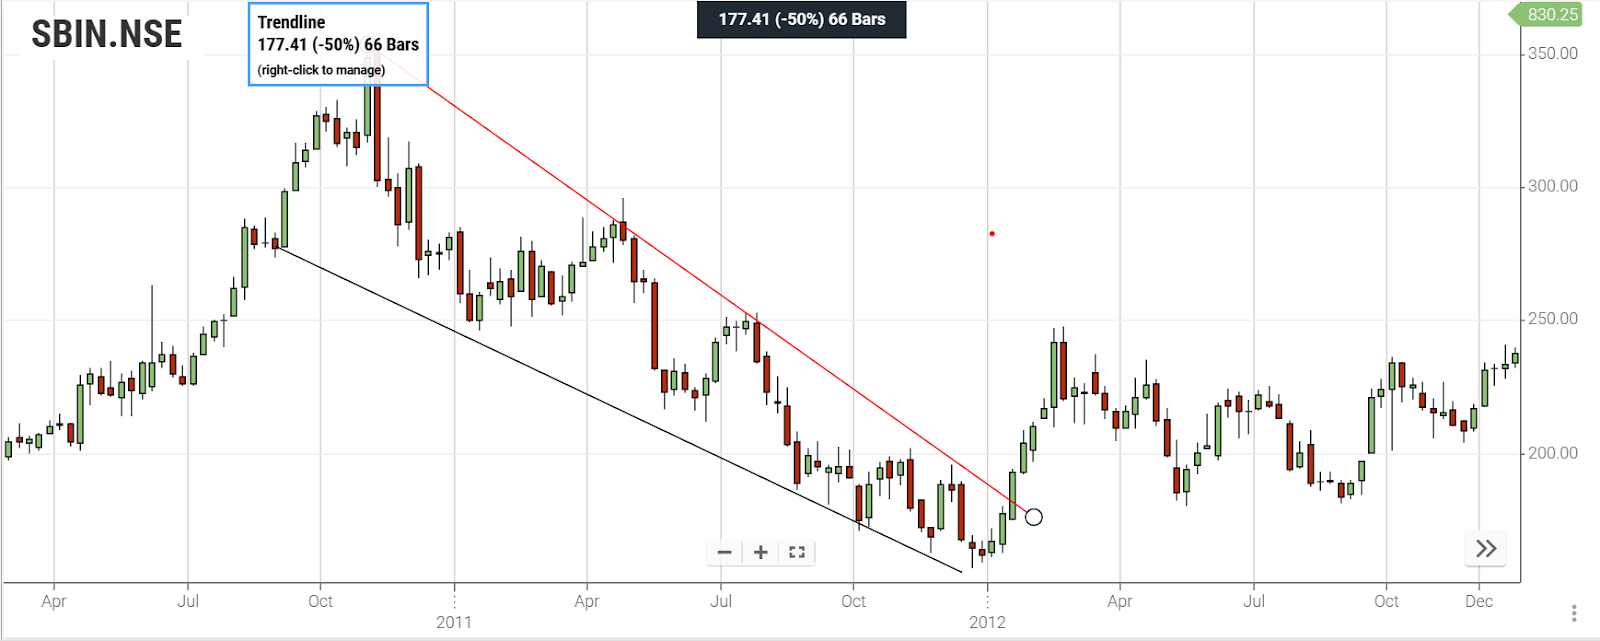
In the provided chart, the price breaks through the channel to the downside, closing on the outside, thereby presenting a potential opportunity for selling.
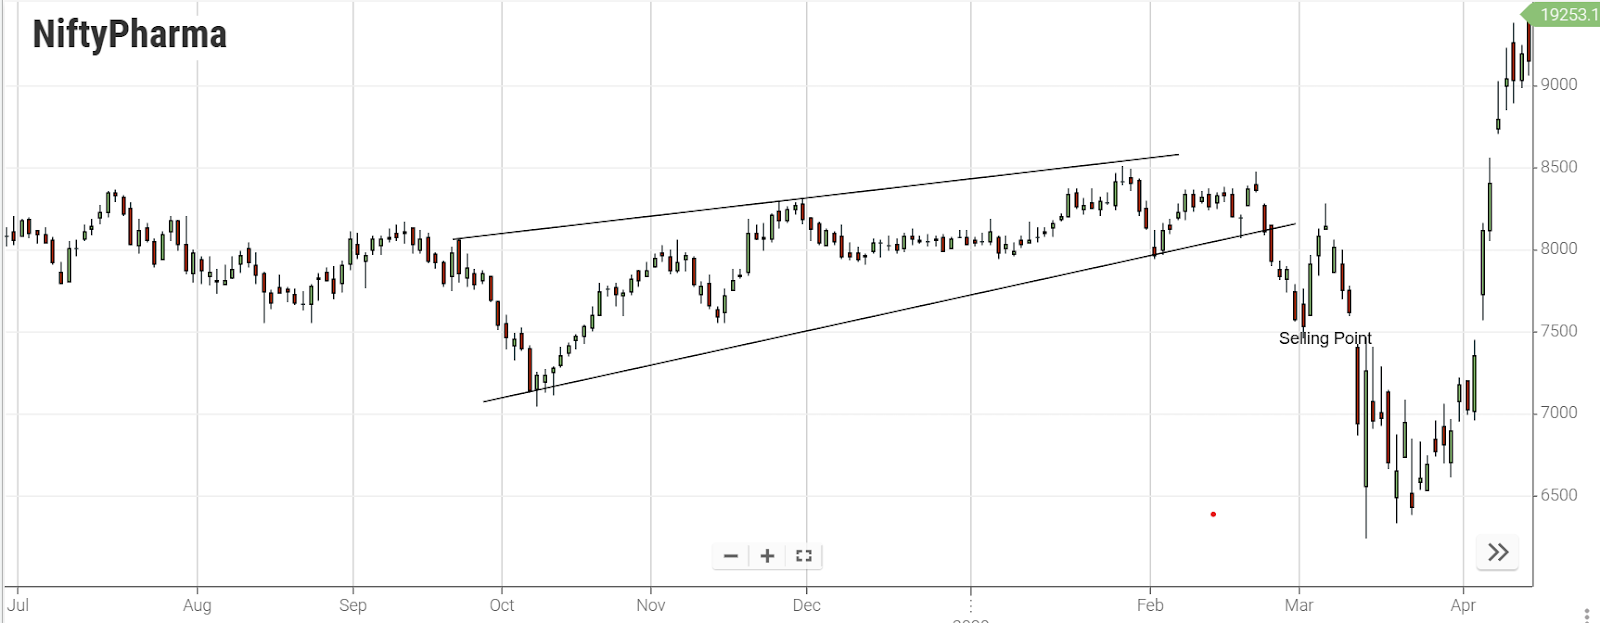
Price channels hold significant influence, and traders often follow their indications. Consequently, breakouts from a channel may not always be genuine. To mitigate the risk of false breakouts, it is advisable to wait for the candle to conclusively close outside the channel before entering a trade. Alternatively, exercising patience for a re-test of the trend line can further enhance the reliability of trading decisions.
Incorporating Channels in the Analysis of Multiple Time Frames
The third approach in channel trading involves utilizing them as a reference in multiple time frame analysis. This entails entering short trades on lower time frames with a tighter stop loss when the asset is trading around the upper boundary on a higher time frame. Conversely, long trades on a lower time frame can be initiated when the price approaches the lower boundary on the higher time frame.
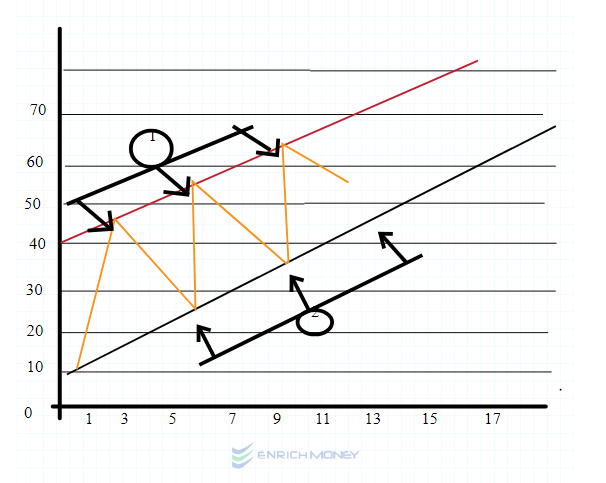
The provided chart below illustrates the confirmation of the channel over a longer time frame.
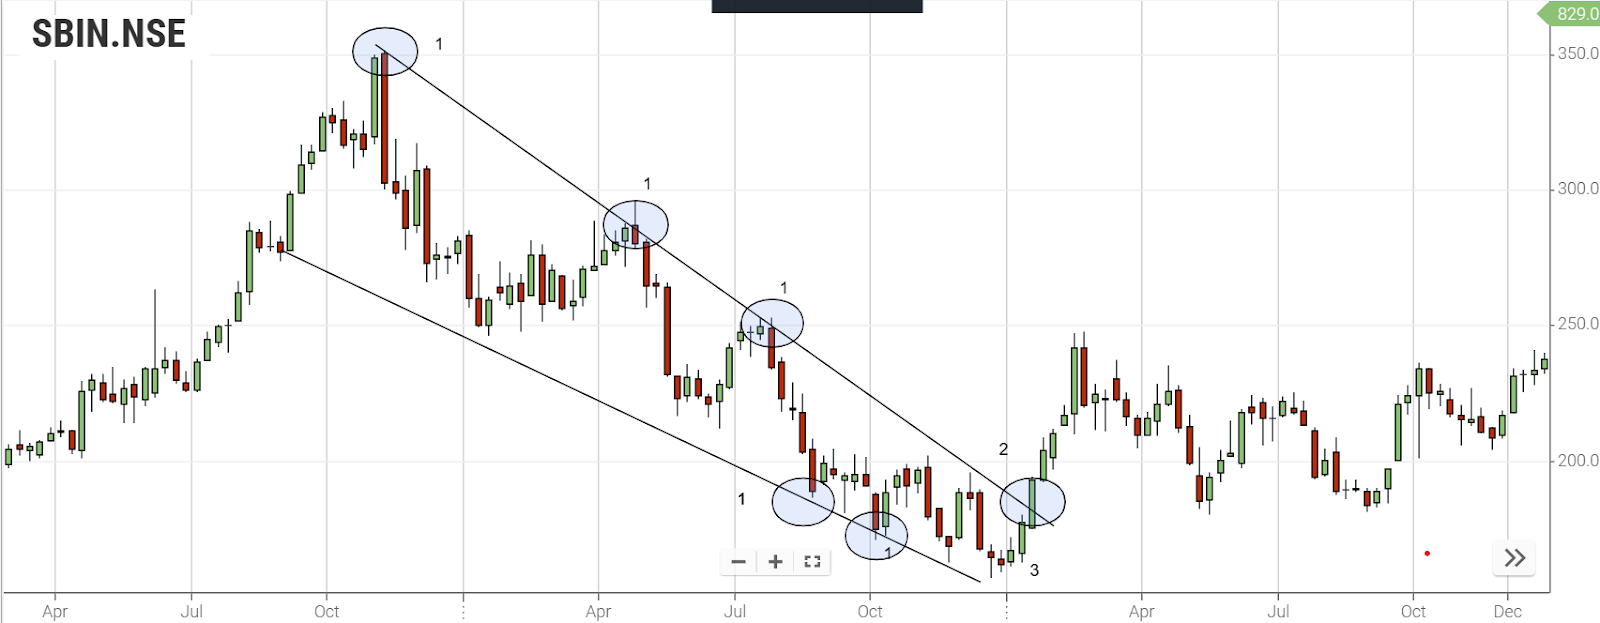
No. 1: Validation of the channel through swing highs and lows.
No. 2: Establishing Long Entry with corresponding Stop Loss.
No. 3: Identifying potential trade opportunities.
Nut Shell
-
Price channels form when the price stays between two boundaries.
-
There are three types of channels: Ascending: Signals an uptrend,Descending: Marks a downtrend; Horizontal: Price moves in a range.
-
More traders using channels make them influential in trading decisions.
-
Breakouts from channels offer potential trade signals.
-
Combining channels with multiple time frames helps find low-risk entry points.
Frequently Asked Questions
-
What is an ascending channel pattern?
An ascending channel is characterized by price action confined between upward-sloping parallel lines, featuring higher highs and higher lows. Technical analysts construct it by connecting swing lows with a lower trend line and swing highs with an upper channel line.
-
What is the pattern of a declining channel?
A descending channel is formed by two downward trendlines drawn above and below a price, representing resistance and support levels. Also known as a "falling channel" or "channel down."
-
What is a horizontal trend pattern?
A horizontal pattern occurs when data values fluctuate around a constant mean. It is the simplest and easiest-to-predict pattern, such as sales of a product that remain constant over time.
-
What is a channel breakdown?
The Channel Breakout Strategy establishes a channel with bands based on the highest and lowest values for the last X bars, with X being the value of the 'Length' setting.
-
Is breakout trading profitable?
Breakout trading can be profitable, but it comes with a high risk of false breakouts. A sound risk management plan is crucial, and traders should aim for a reasonable risk/reward ratio, preferably at least 1:2.