Knowledge Center Technical Analysis
Wedge Patterns
Descending Broadening Wedge Pattern
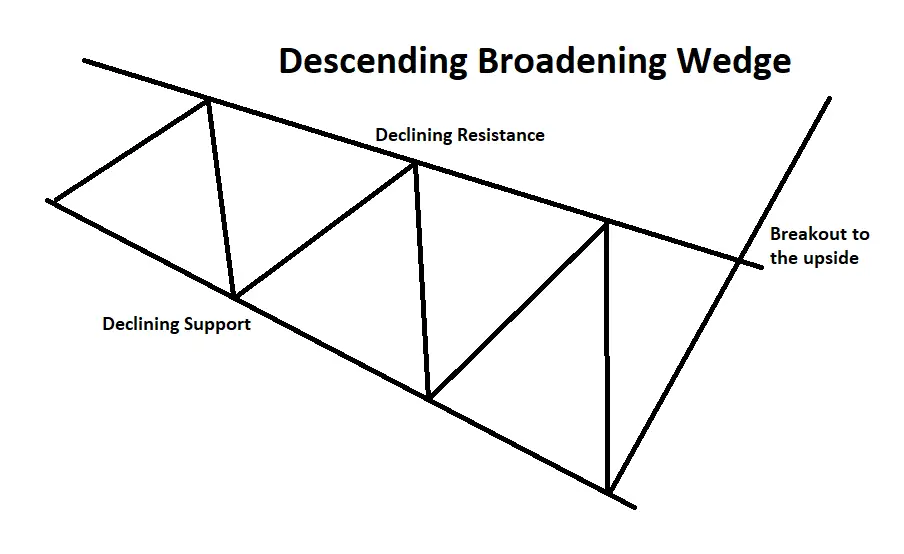
The descending broadening wedge chart pattern is a bullish reversal formation characterized by two sloping and diverging trend lines. This pattern emerges as the price fluctuates between the upper resistance and lower support trend lines, expanding the trading range during a downtrend. For the pattern to be valid, the price should touch each line at least 2 or 3 times. Visually, it resembles a megaphone pointing downward and to the right.

The descending wedge pattern can serve as both a continuation or reversal signal, contingent on its position on a price chart. This tutorial guides you through recognizing the pattern and demonstrates how it can be utilized to identify potential buying opportunities.
The Success Trend Ratio :
For a reversal to occur, there must be a pre-existing trend, much like other reversal patterns. The descending broadening wedge can emerge on various time frames, indicating a potential reversal in short, intermediate, or long-term trends.
There is an 80% likelihood of a breakout to the upside, with only a 20% chance of a downside breakout. Sometimes, the pattern can absorb the entire existing trend, while in other instances, it forms after a prolonged decline.
How to recognize Descending Broadening Wedge
To recognize this pattern on the chart, adhere to these steps:
-
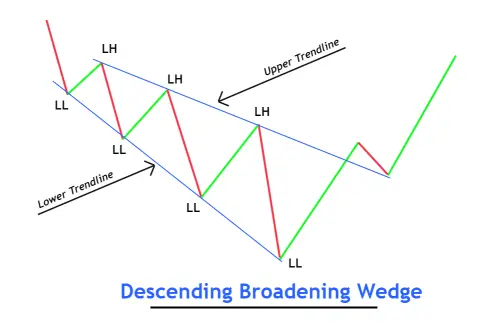
Determine the initial point of the wave, where the price forms lower lows and lower highs.
-
Ensure each succeeding wave is larger than the preceding one.
-
Sketch two trend lines connecting the swing high and swing low points of the waves.
-
The starting point of the wedge pattern should be narrow, while the ending point should be wide.
-
A descending wedge pattern must comprise a minimum of three waves.
These uncomplicated criteria aid in identifying this pattern on the price chart.
Refer to the illustration below for a clearer understanding.

What do traders learn from the descending broadening wedge pattern?
In the realm of market trading, price action is the most effective strategy, but mastering it requires extensive screen time.
Price action involves understanding how prices behave at specific levels or under certain conditions, such as chart patterns.
By employing the price action technique, traders can gain mastery over descending broadening wedge patterns. This is crucial because currency charts often present misleading signals and trade concepts. Profits can be earned by discerning the valuable trades amidst the noise of the market crowd. Such discernment comes with experience in trading this particular chart pattern.

Trading with the descending Broadening Wedge Method 1
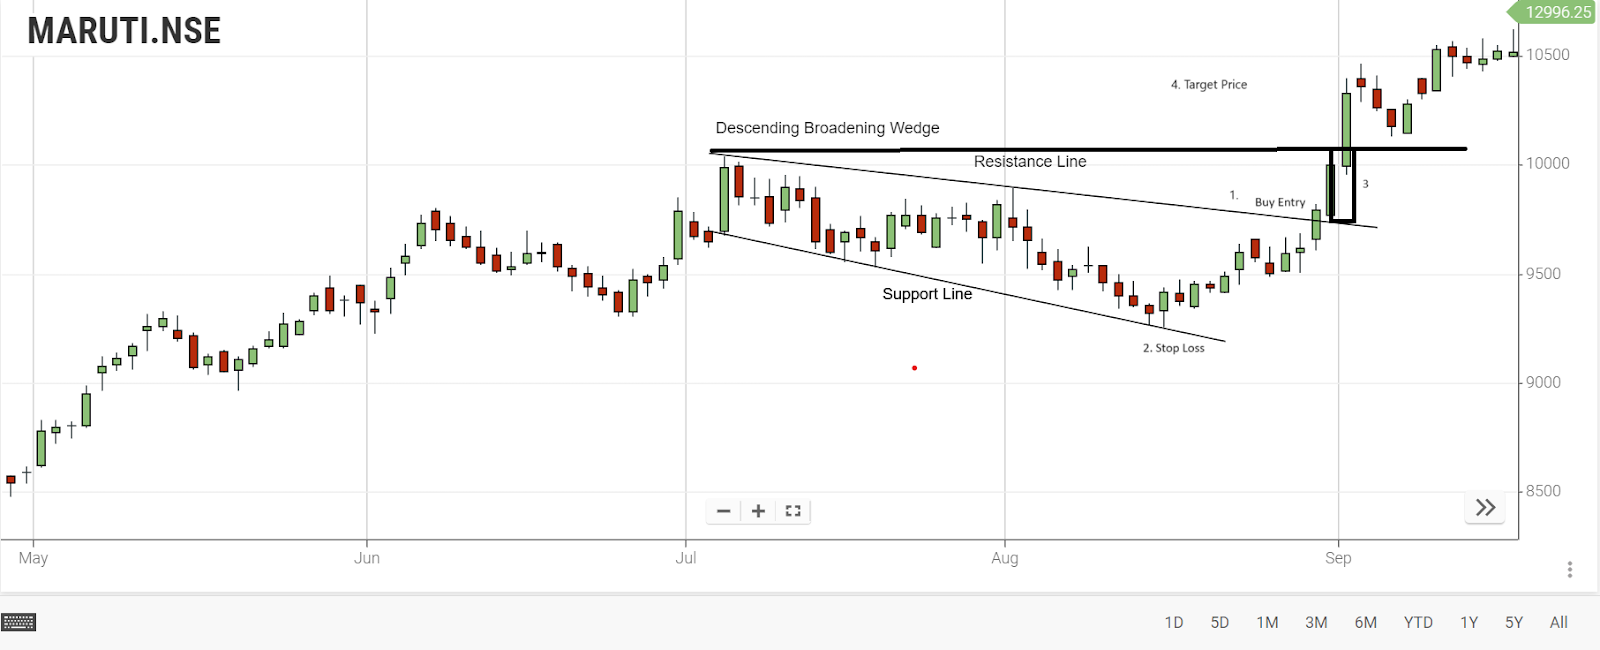
One approach to entering the pattern involves initiating a buy order (long entry) upon the breakout of the upper side of the wedge. To prevent falling for false breakouts, it's essential to wait for a candle to close above the top trend line before making a move.
The chart below illustrates the buy order and the specific region where the price has breached the upper trend line of the wedge
The stop loss should be set below the lower side of the descending wedge pattern.
Lastly, the chart displays the profit target, determined by measuring the height of the back of the wedge and extending that distance upward from the trend line breakout point.

-
Long Entry
-
Stop Loss
-
Back of the Wedge
-
Take Profit/Target Profit
Resistance Line: At least two high points are essential to establish the upper resistance trend line. Lower highs in the price action are necessary to validate the descending broadening wedge pattern.
Support Line: A minimum of two low points is needed to draw the lower support trend line. Lower lows in the price action are crucial for the pattern to be considered valid.
Trading with the descending Broadening Wedge Method 2
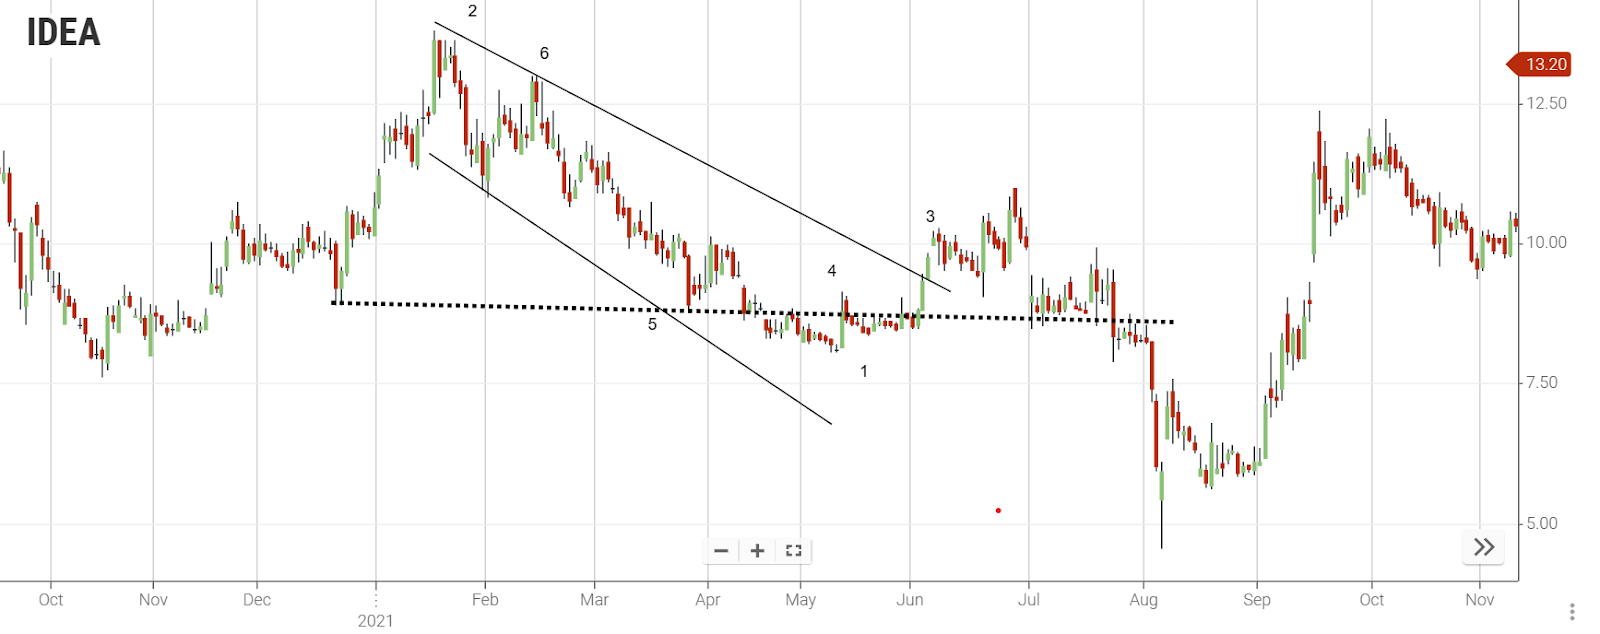
Another method to trade the falling wedge pattern is to wait for the price to trade above the trend line (the broken resistance), similar to the first example. Once that happens, you can place a buy order when the price retests the trend line, which would act as support. The stop loss should be set below this new support area. Similar to method one, this can be calculated by measuring the height of the back of the wedge and extending that distance upward from the entry point.

-
The price discovers support at the upper side of the falling wedge.
-
Back of the wedge refers to the rear part of the wedge pattern.
-
The distance from the entry point (buy order) to the third take profit level is the same as the height of the back of the wedge (item 2).
-
Long entry signifies entering a trade with a buy order.
-
Stop loss denotes the predetermined price level set to limit losses.
-
Profit target represents the anticipated price level at which profits will be taken.
Break-in Resistance Line:
Confirmation of the bullish momentum occurs when the resistance line is successfully breached upwards, and the current time frame's candle has closed beyond the break.
For a secure move, it's advisable to wait for a breakout from the preceding lower high. Once this resistance is surpassed, a pullback is likely to establish the newly formed support level, indicated by the previously broken resistance line.
Key Takeaways
-
The descending broadening wedge pattern indicates a possible chance to buy, either after a downtrend or within an ongoing uptrend.
-
This pattern resembles a bearish megaphone shape. Entry (buy order) points occur when the price breaks above the top side of the wedge or finds support at the upper trend line.
-
To set a stop loss, it's placed below the back of the wedge, considering its height. The take profit target is calculated by extending this distance upward from the trend line breakout.
-
The descending broadening wedge pattern can persist for extended periods due to increasing market unpredictability. Unlike pennants, wedges, or triangles, this pattern lacks a clear "crossing point," making it challenging to predict its conclusion. Irregularity is expected, with the key indication being the divergence of the two lines and distinct support/resistance levels.
Frequently Asked Questions
-
Is a Descending Broadening Wedge Bullish?
The descending broadening wedge is considered bullish and is often seen as a reversal pattern. However, it's worth noting that even though it indicates a potential reversal, there's a possibility of the downtrend resuming.
-
How to Measure a Descending Broadening Wedge?
To measure a descending broadening wedge after downward breakouts, determine the height by calculating the difference between the highest peak and the lowest valley in the chart pattern. Multiply this height by the overlay and subtract it from the lowest valley to find the price target.
-
Is the Broadening Pattern Bullish or Bearish?
Broadening wedges are typically viewed as bearish, characterized by increasing volatility without a clear directional move, making them uncertain for most long-term investors.
-
Why Is a Descending Wedge Bullish?
The descending wedge pattern is considered bullish as it emerges after a bearish trend. It signifies a shift in control from bulls to bears, leading to lower lows in price but at a slower pace, indicating a potential change in market sentiment.
-
What's the Difference Between a Falling Wedge and a Descending Triangle?
Both falling wedges and descending triangles are chart patterns used in technical analysis, but they indicate different market behaviors. A falling wedge is a bullish continuation pattern, characterized by converging trendlines with the price making lower lows and lower highs. In contrast, a descending triangle is a bearish continuation pattern, formed by a horizontal support level and a descending trendline, indicating a potential downward price movement.
-
What Does a Falling Wedge Mean in Trading?
A falling wedge in trading signifies a potential bullish reversal or continuation of an existing uptrend. It represents a temporary slowdown in a downtrend, often followed by a price breakout to the upside. Traders interpret a falling wedge as a signal that selling pressure is decreasing, and buyers might gain control, leading to a potential upward price movement. Trading strategies often involve entering long positions when the price breaks above the upper trendline of the falling wedge pattern.
