Knowledge Center Technical Analysis
Wedge Patterns
Rising Wedge Pattern
When we draw straight lines to connect the highest points (Pivot Highs) and lowest points (Pivot Lows) on a price chart, we create two distinct trend lines. Now, if these trend lines come together, we can see that they are converging but not parallel, This pattern is called a wedge pattern. Below are the references for the said chart patterns.
The wedge pattern has three characteristics:
-
Coverage of the trend lines
-
Volume decreases when the price progresses
-
Breakout occurrence from one of the trend lines.
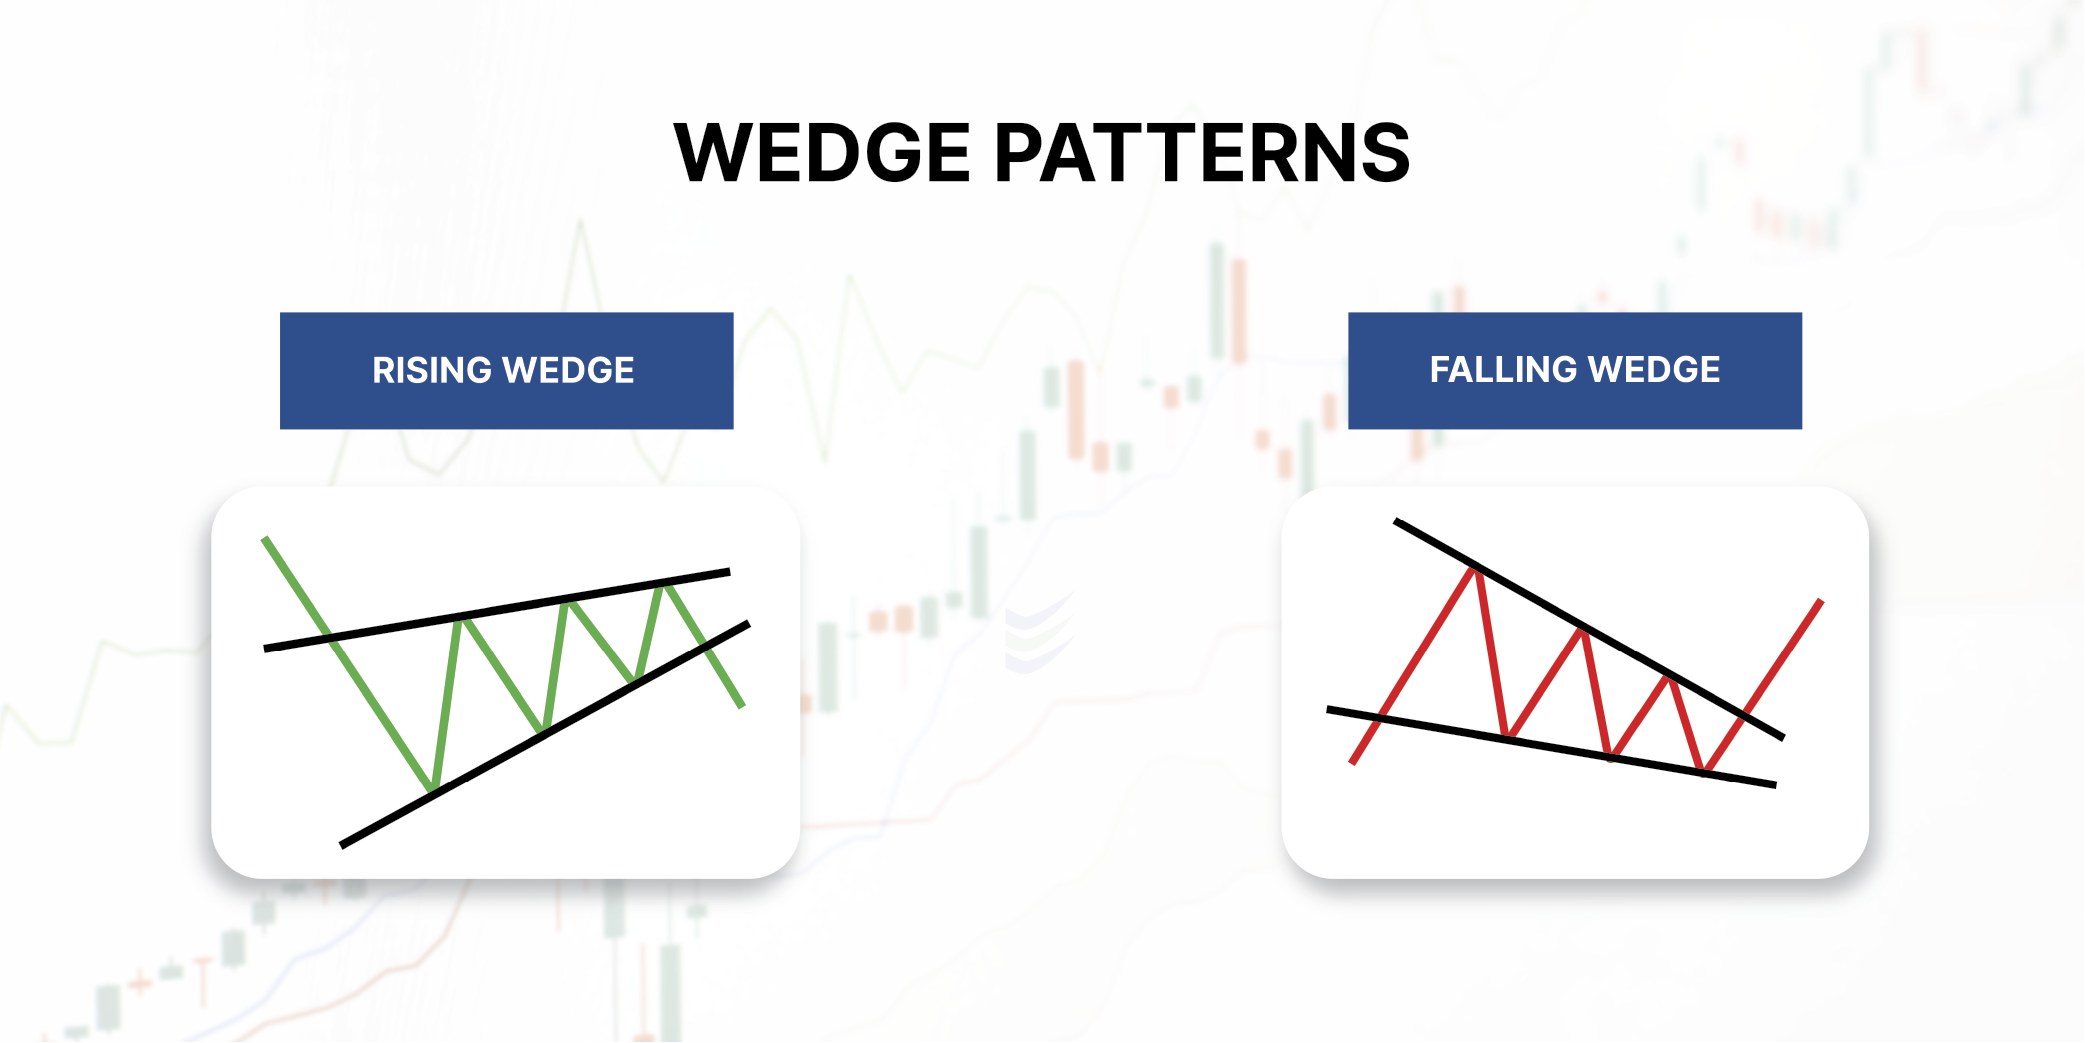
Types of wedge patterns
There are two types of wedge patterns,
The one that arises near the end of an upward trend, where the lines incline downward, is called the rising wedge Pattern.
Another that arises near the end of a downward trend, where the lines incline up, is called a Falling wedge pattern.
Let's get to know the Rising Wedge Pattern in detail.
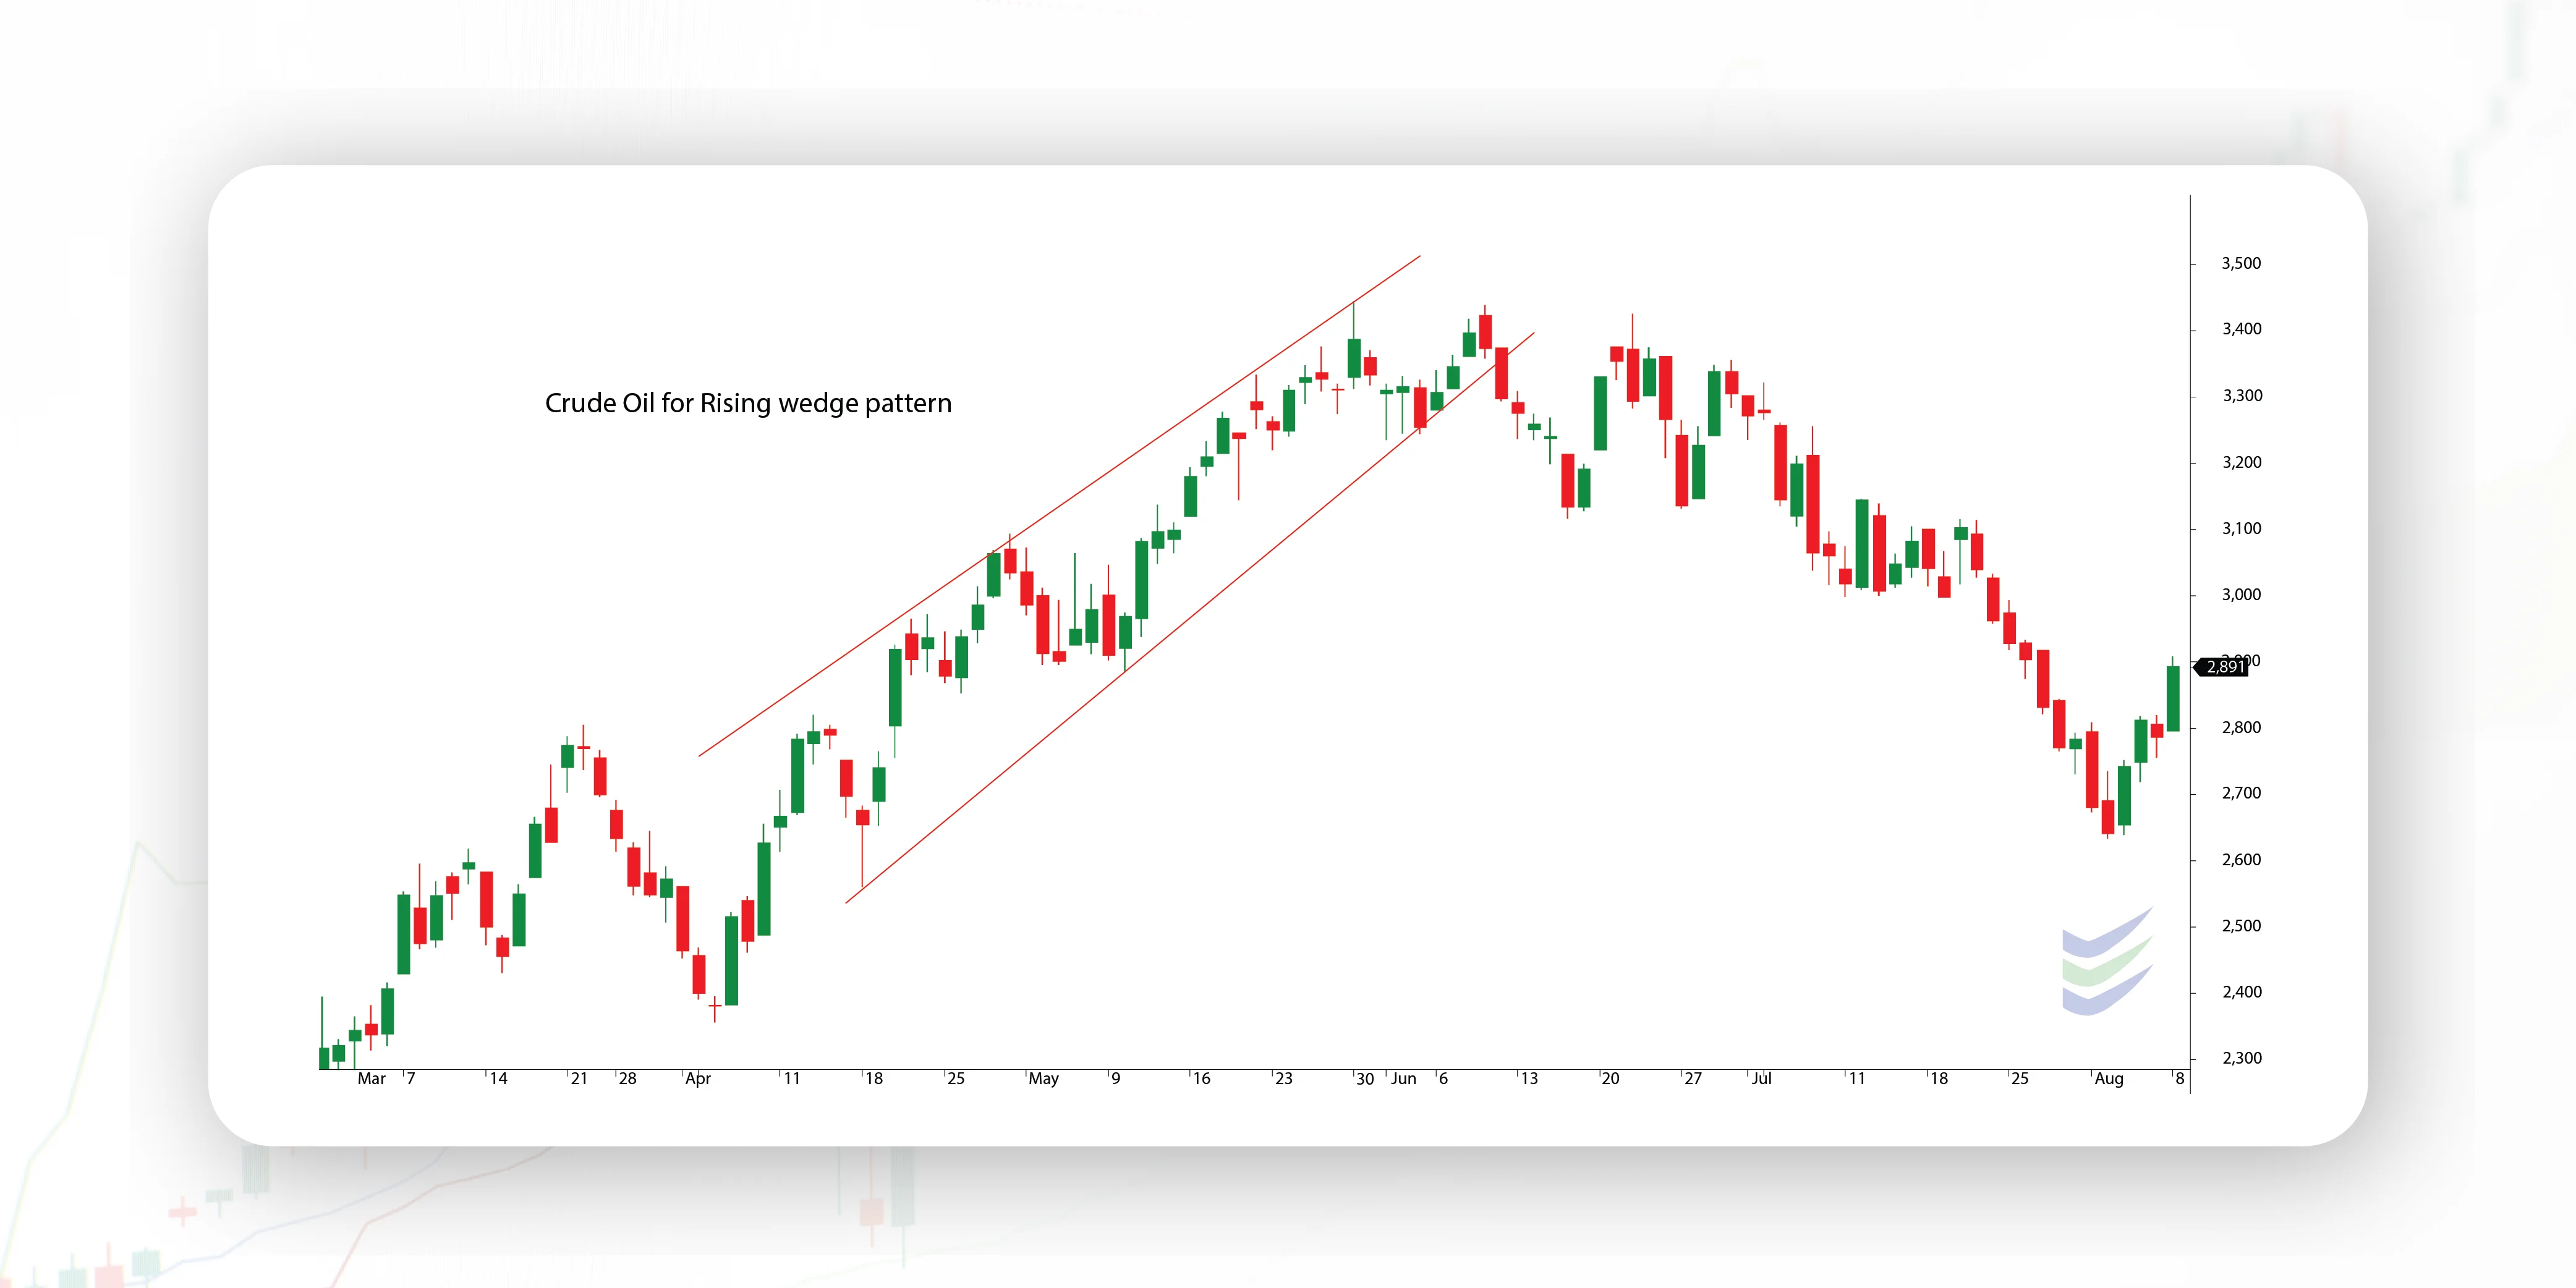
A rising wedge pattern is also called an ascending wedge pattern. It takes shape after a longer uptrend when the price makes higher highs and higher lows. All the high points and low points should be in line.
If the price does not respect the upper or lower trend line, then that will not be a valid Pattern.
Following that, the trend lines converge to form a Wedge pattern. But before the lines converge, sellers arrive at the forex, which consequently brings low momentum to the rise of prices.
However, this leads to breaking the upper or lower trend line. where prices usually break out in the opposite direction of the trend line.
Rising Wedge pattern in an uptrend.
A rising wedge pattern in an uptrend signifies that a reversal of the downtrend is likely to happen (a bearish wedge pattern). It enables forex traders with opportunities to take sell positions.
Rising Wedge pattern in a downtrend.
A rising wedge pattern in a downtrend signifies the continuation of the prior trend. This shows the breakout should happen at the lower trend line. It allowed crypto traders to take sell positions.
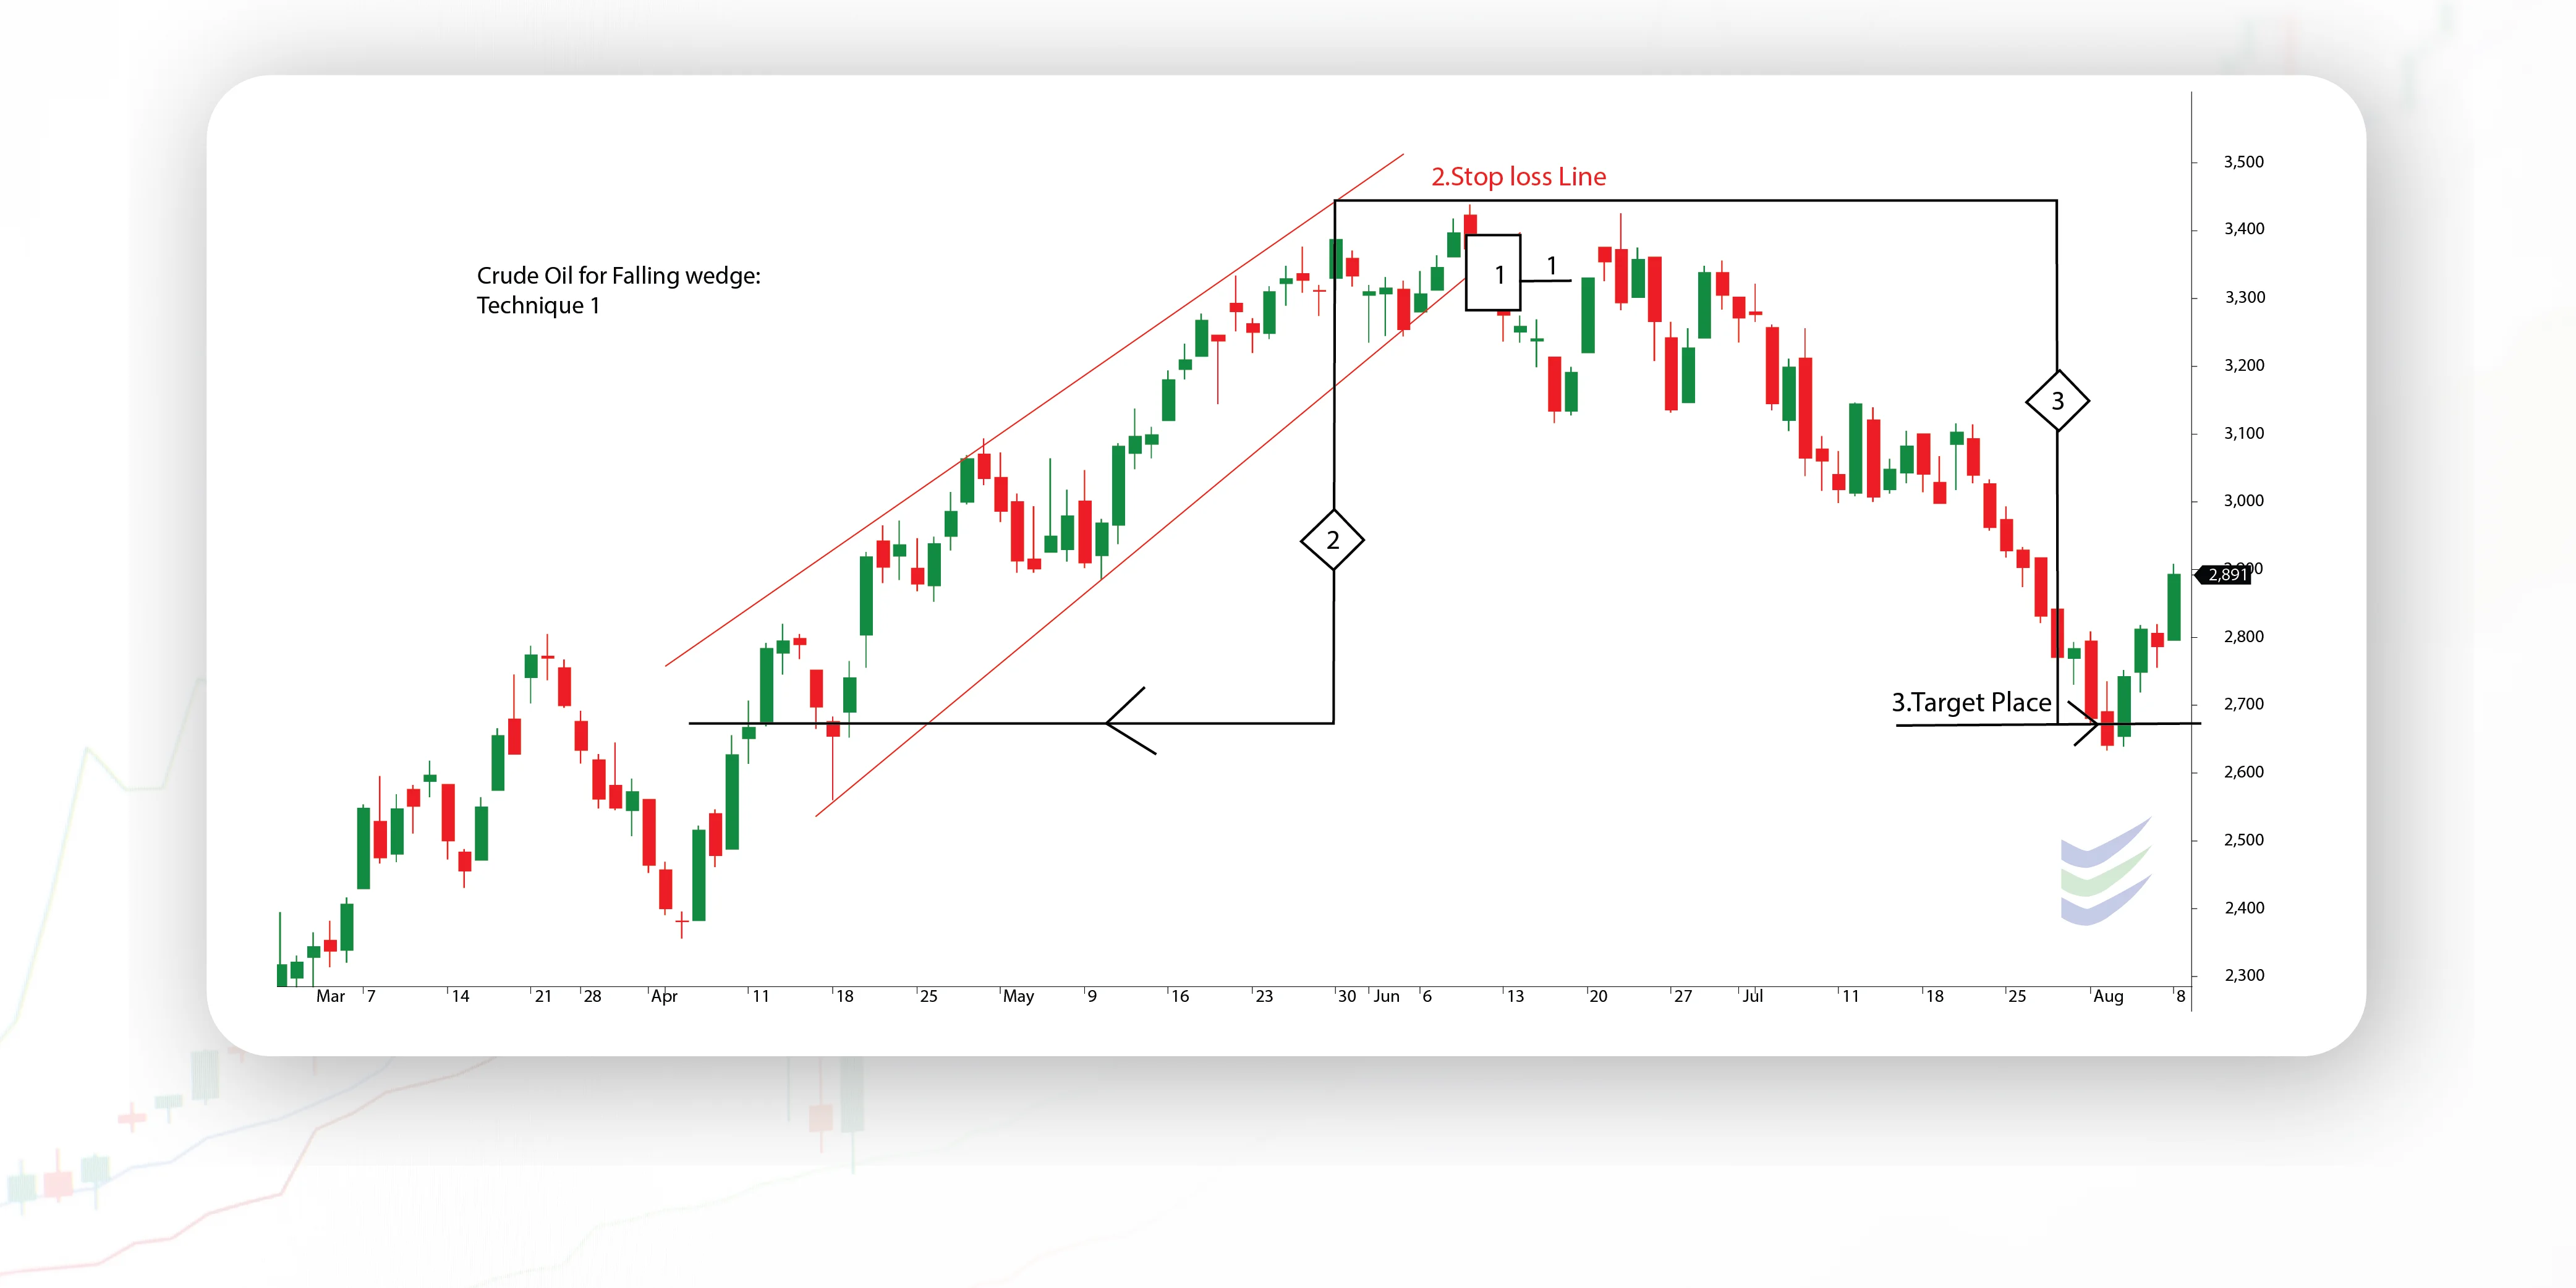
Trading the Rising Wedge: Method One
When you spot a rising wedge in an uptrend or downtrend, one way to enter the market is by selling (short entry) when the price breaks below the wedge's lower side. To confirm the breakout, wait for a candle to close below the bottom trend line before making your move. Look at the chart below to see where to place your sell order after the price breaks the lower support trend line.
-
The profit target is measured by taking the height of the back of the wedge and extending that distance down from the trend line breakout.
-
Sell order (short entry)- an area where the price has broken the lower support trend line.
-
Stop loss - Back of the wedge.
-
Take profit - it is the same height as the back of the wedge.
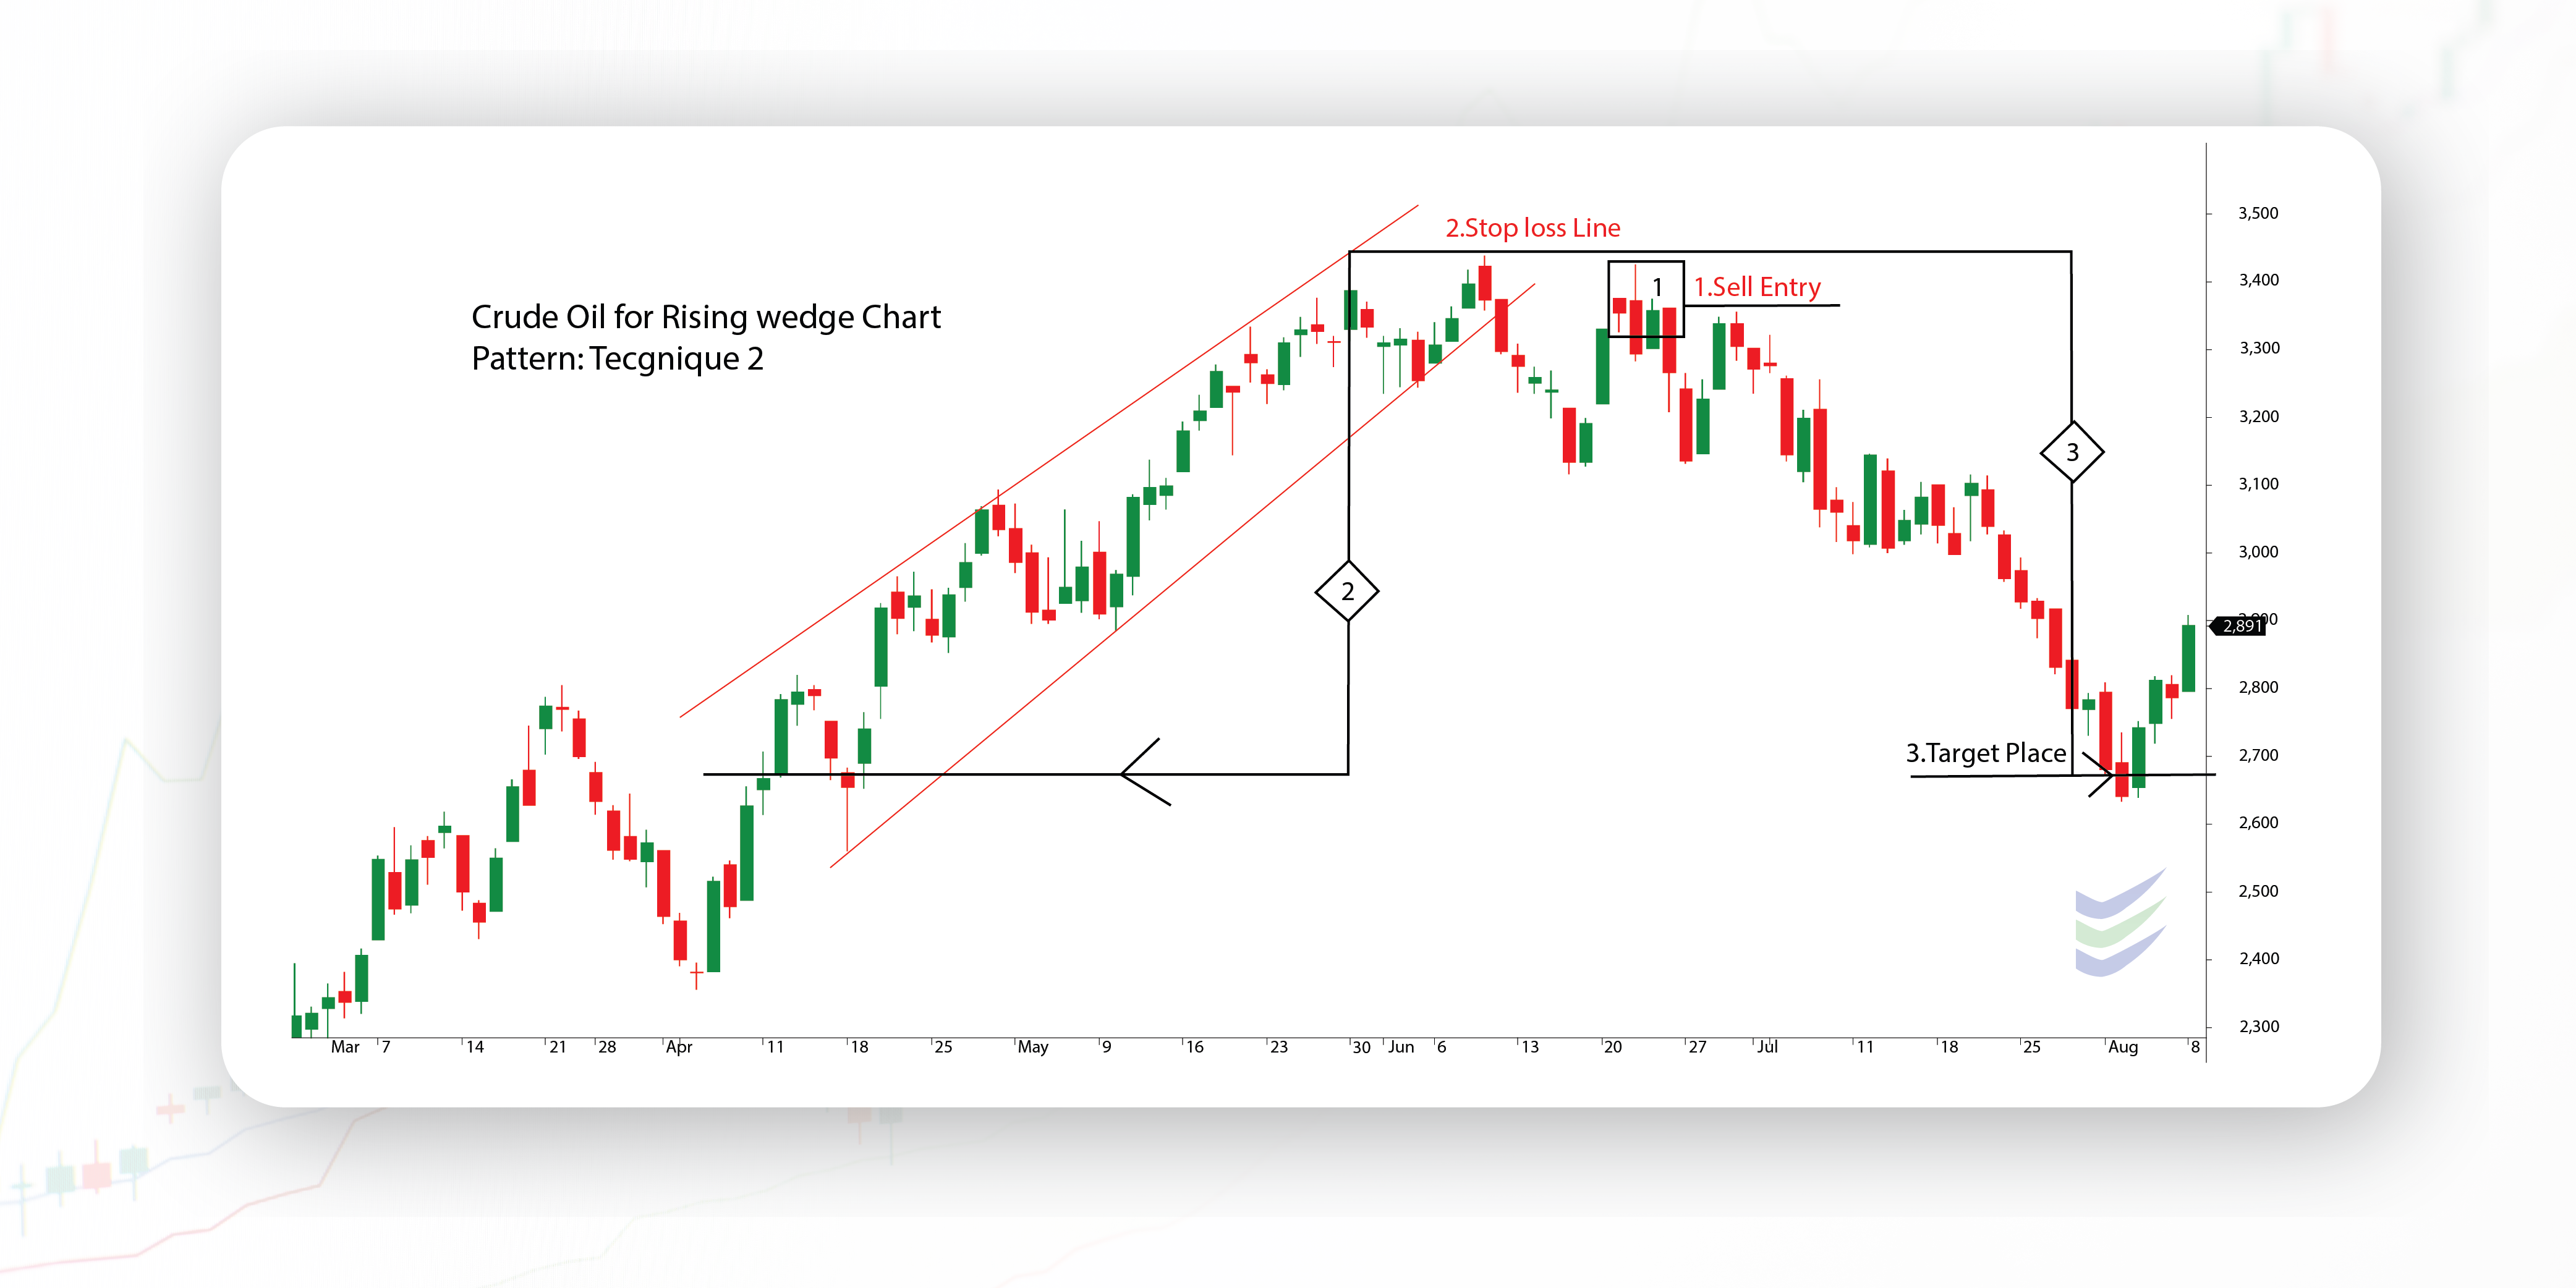
Trading the Rising Wedge: Method Two
In the second method, wait for the price to drop below the trend line (broken support), similar to the first example. Afterward, place a sell order when the price retests the trend line, which has now turned into resistance.
-
Sell order (short entry)-The point at which the price finds resistance is at the lower part of the wedge.
-
Stop Loss-Back of the wedge
-
Take Profit- The distance between entry (sell order) es1 and take profit (TP3) is the same height as the back of the wedge number.
Key Takeaways
-
The rising wedge pattern shows a possible selling opportunity after an uptrend or an existing downtrend.
-
The entry, i.e., the sell order, is placed when the price breaks below the bottom side of the wedge.
-
The stop loss is located at the back of the wedge.
-
The take profit target is calculated by taking the height of the back of the wedge and extending that distance down from the entry.
Frequently Asked Questions:
What is a rising wedge pattern?
A rising wedge pattern is a visual pattern on a price chart that occurs when both the highs and lows of an asset's price are rising, but the rate of increase in the lows lags behind that of the highs, resulting in converging trend lines forming a wedge-like shape.
What does a rising wedge pattern mean?
A rising wedge pattern means that the price might go down as the upward momentum weakens, and traders look for a breakout to confirm this possible downward movement.
Is the rising wedge pattern always accurate?
No, like all technical patterns, the rising wedge pattern is not always accurate.
What are the common mistakes made by traders using the rising wedge pattern?
Common mistakes include overtrading, not waiting for confirmation of the breakout, and ignoring broader market factors. To avoid these, traders must follow a trading plan, use risk management strategies, and stay informed about news that might impact their chosen asset.
Does a rising wedge pattern appear in all sorts of financial markets?
Absolutely! We can spot rising wedge patterns in various financial markets, such as stocks, currencies, commodities, and more. It's a handy pattern that analysts use across different types of assets.