Knowledge Center Technical Analysis
Wedge Patterns
Right Angled Ascending Broadening Wedge Pattern
Introduction
Right-Angled Broadening Wedges pattern comes in two categories,
-
Right angled ascending broadening wedge pattern
-
Right angled descending broadening wedge pattern
They comprise a horizontal trend line and a sloping trend line. Prices should hit both trend lines twice. Two hits form the horizontal trend line, and two hits from the sloping trend line. A partial rise or a partial decline is formed on a breakout from these two patterns.
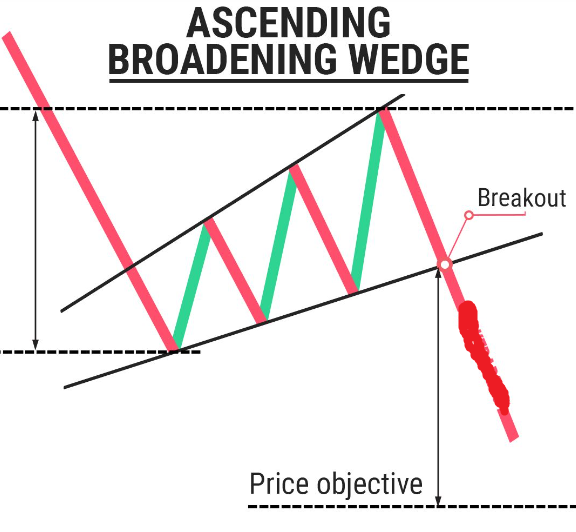
A right-angled ascending broadening wedge is a technical chart pattern that can occur in financial markets, particularly in technical analysis of stocks and other securities. It is a variation of the ascending broadening wedge pattern, characterized by specific geometric features.
Characteristics of Right-Angled Ascending Broadening Wedge Pattern
The right-angled ascending broadening wedge pattern is a specific formation in technical analysis that traders use to analyze and predict potential price movements in financial markets. Here are the key characteristics of this pattern:
-
Structure: The right-angled ascending broadening wedge is identified by two trendlines – a rising lower trendline indicating higher lows and a steeper upper trendline that is nearly parallel, forming a distinctive right-angled structure.
-
Bearish Reversal Signal: This pattern typically serves as a bearish reversal signal, suggesting that the existing bullish trend is losing momentum, and a downward reversal may follow.
-
Volume Dynamics: Volume often expands as the price moves within the wedge, but it may decrease as the pattern approaches completion, indicating potential weakening of the current trend.
-
Breakout Direction: Anticipation of a breakout is to the downside, with traders expecting a significant price decline after the price breaks below the lower trendline.
-
Confirmation: Traders often seek additional confirmation through technical indicators or patterns to strengthen the reliability of the bearish reversal signalled by the right angle broadening wedge.
How to Identify Right-Angled Ascending Broadening Wedge Pattern
Identifying a right-angled ascending broadening wedge pattern involves recognizing specific visual and structural characteristics on a price chart. Here's a step-by-step guide on how to identify this pattern:
-
Chart Analysis:
-
Start by examining a price chart of the asset in question. This pattern is typically observed in uptrends.
-
Focus on identifying rising peaks and troughs.
-
Locate Trendlines:
-
Identify two trendlines. The lower trendline should connect the successive higher lows (troughs), indicating the ascending nature of the pattern.
-
The upper trendline should connect the successive higher highs (peaks) but is nearly parallel to the lower trendline, creating a right-angled structure.
-
Right-Angle Formation:
-
Confirm that the upper and lower trendlines form a right-angled broadening wedge or are very close to it. This distinctive right-angled structure is a key characteristic of the pattern.
-
Volume Analysis:
-
Analyze trading volume during the formation of the pattern. Generally, volume should expand as the price moves within the wedge. However, volume may decrease as the pattern nears completion, signalling potential weakening of the existing trend.
-
Bearish Reversal Signal:
-
Recognize the pattern as a bearish reversal signal. The right-angled ascending broadening wedge suggests that the bullish trend is losing strength, and there is potential for a reversal to the downside.
-
Confirmation:
-
Look for additional confirmation signals. Traders often use other technical indicators or patterns, such as momentum indicators or candlestick patterns, to confirm the potential bearish reversal signalled by the right-angled ascending broadening wedge.
-
Breakout Direction:
-
Anticipate a breakout to the downside. The expected outcome is a significant price decline after the price breaks below the lower trendline.
-
Target Price:
-
Estimate the ascending wedge pattern target for the downward move by measuring the widest part of the wedge (the vertical distance between the two parallel trendlines) and projecting it downward from the point of the breakout.
When Does a Right-Angled Ascending Broadening Wedge Pattern is formed
A right-angled ascending broadening wedge pattern is typically formed in an uptrend and indicates a potential bearish reversal. Here's when this pattern is formed:
-
Prior Uptrend: The right-angled ascending broadening wedge pattern usually emerges within the context of a prior uptrend. This suggests that buyers have been in control, leading to higher highs and higher lows.
-
Formation Stage: As the pattern develops, it is characterized by two trendlines. The lower trendline slopes upward, connecting higher lows, and the upper trendline is nearly parallel, creating a right-angled structure. The price oscillates between these trendlines.
-
Right-Angled Structure: The distinct feature of this pattern is the right-angled structure formed by the parallel upper and lower trendlines, setting it apart from a standard ascending broadening wedge.
-
Volume Dynamics: During the formation of the pattern, trading volume often expands as the price swings within the wedge. However, as the pattern nears completion, volume may diminish, signalling potential exhaustion of the existing uptrend.
-
Bearish Reversal Signal: The right-angled ascending broadening wedge serves as a bearish reversal signal. It suggests that the bullish trend is losing strength, and there's a potential for a trend reversal to the downside.
-
Breakout Direction: Traders anticipate a breakout to the downside, marking the point where the price breaks below the lower trendline. This breakout is considered a significant signal for a potential trend reversal.
-
Confirmation: Traders often seek additional confirmation through other technical indicators or patterns to strengthen the reliability of the bearish reversal signalled by the right-angled ascending broadening wedge.
What Does a Right-Angled Ascending Broadening Wedge Pattern Indicate
The broadening formations right-angled and ascending pattern typically indicates a potential bearish reversal in the market. Here's what this pattern suggests:
-
Bearish Reversal Signal: The ascending broadening wedge is considered a bearish reversal pattern. It signals that the prior uptrend is losing momentum, and there is a potential shift in market sentiment from bullish to bearish.
-
Weakness in the Bullish Trend: The broadening wedge pattern suggests that the buyers who were driving the upward trend are encountering resistance, leading to a broader price range between higher highs and higher lows. This widening range indicates uncertainty and potential weakness in the existing bullish trend.
-
Right-Angled Structure: The right-angled structure formed by the parallel upper and lower trendlines is a key characteristic. This structure, distinct from a standard ascending broadening wedge, indicates a unique pattern associated with potential bearish implications.
-
Potential Price Decline: Traders often interpret the right-angled ascending broadening wedge as a signal that the price is likely to break out to the downside. This breakout can lead to a significant price decline, prompting traders to consider short-selling or adopting bearish strategies.
-
Confirmation through Breakout: Confirmation of the bearish reversal is typically sought through a decisive breakout below the lower trendline. A sustained move below this trendline is considered a confirmation that the pattern is unfolding as expected.
-
Volume Dynamics: During the formation of the pattern, trading volume often expands as the price oscillates within the wedge. However, as the pattern nears completion, volume may diminish, indicating potential exhaustion of the prior uptrend.
How to Trade a Right-Angled Ascending Broadening Wedge Pattern
Trading a right-angled ascending broadening wedge pattern involves recognizing the pattern, understanding its implications, and executing trades based on anticipated price movements. Here's a step-by-step guide:
-
Pattern Identification:
-
Identify the right-angled ascending broadening wedge pattern on the price chart. Look for the distinctive right-angled structure formed by parallel upper and lower trend lines within the context of an uptrend.
-
Confirmation:
-
Confirm the pattern through additional technical indicators or patterns. This can include looking for bearish divergence on oscillators or observing weakening momentum in the market.
-
Breakout Confirmation:
-
Wait for a confirmed breakout to the downside. The breakout is considered confirmed when the price decisively moves below the lower trendline. This could be accompanied by an increase in volume, providing additional confirmation.
-
Entry Point:
-
Enter a short position (sell) once the breakout is confirmed. Some traders may choose to enter immediately upon the breakout, while others may wait for a pullback to the broken trendline to enter at a potentially more favourable price.
-
Stop-Loss Placement:
-
Place a stop-loss order above the upper trendline to manage risk. This level acts as a potential point of invalidation, and if the price breaks back above the upper trendline, it may signal a false breakout.
-
Profit Targets:
-
Set profit targets based on the projected price decline. One common method is to measure the widest part of the wedge (the vertical distance between the parallel trendlines) and project it downward from the breakout point. Additionally, traders may use support levels or Fibonacci retracement levels as potential targets.
-
Monitoring and Adjustments:
-
Continuously monitor the trade and be prepared to adjust based on market conditions. Traders may consider trailing stop-loss orders to lock in profits as the price moves in their favor.
-
Risk Management:
-
Implement sound risk management practices, including position sizing and diversification, to protect against potential losses. This ensures that no single trade has a disproportionate impact on the overall portfolio.
-
Confirmation of Trend Reversal:
-
Confirmation of the trend reversal is crucial. Traders may look for signals such as sustained downward momentum, break of key support levels, or additional bearish patterns to validate the continuation of the bearish trend.
Trading Strategy
Technique 1:
Consider the chart below.
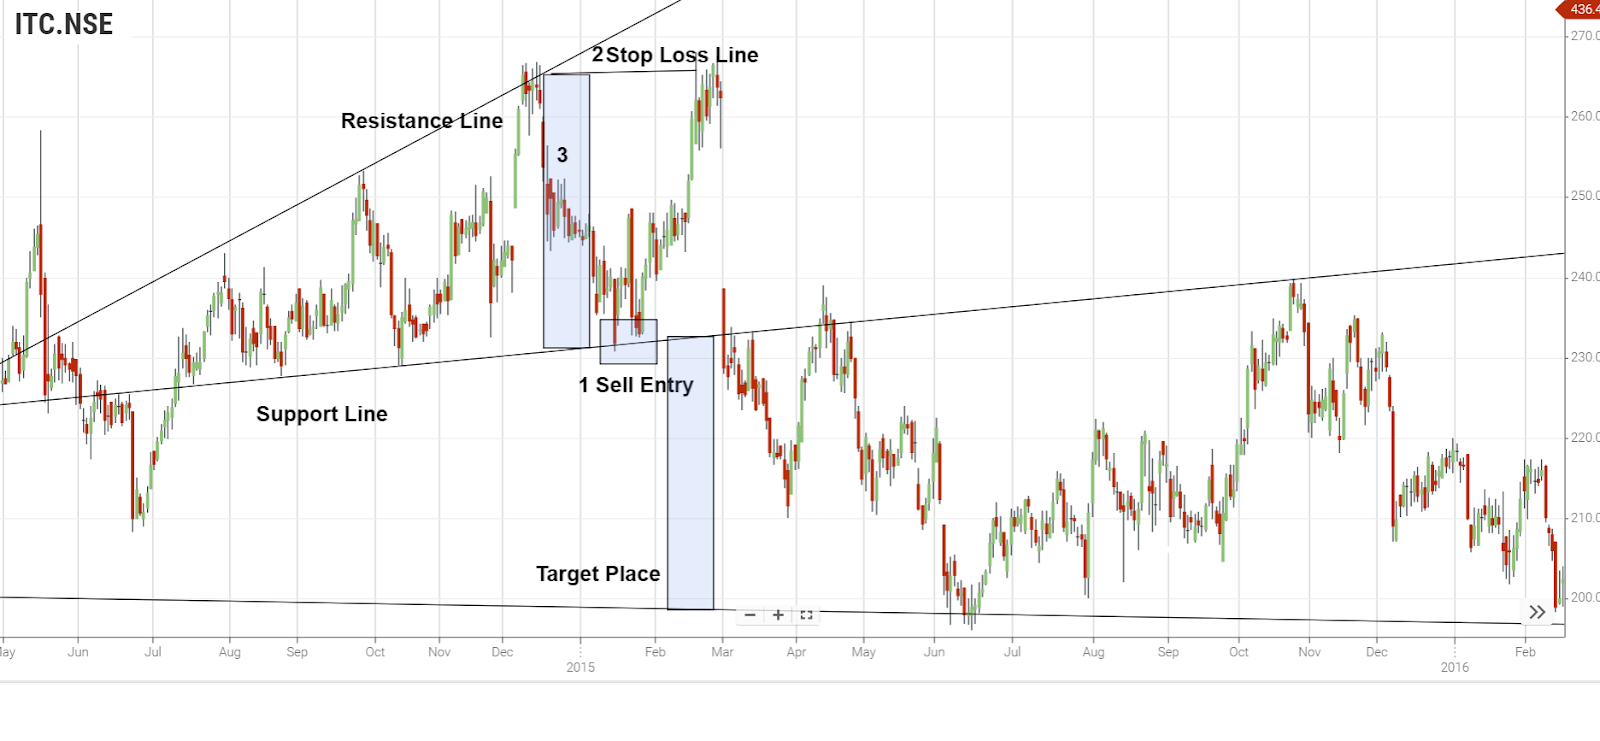
It is observed that a right angled ascending broadening pattern is formed. A support and resistance trendline is drawn on the pattern. Wait for the price to move below the support line. Consider this as a breakout confirmation signal. Place a short sell entry below the breakout line. Place a stop loss order just above the sloping resistance line to manage risk. Target profit is placed below sell entry just at a distance equal to the distance between support line and stop loss order.
The chart represents the following:
Area where price has broken the lower horizontal support trend line
1- Sell order (short entry)
2- Stop loss
3- Target distance
4- Target profit distance
Technique 2:
Consider the chart below,
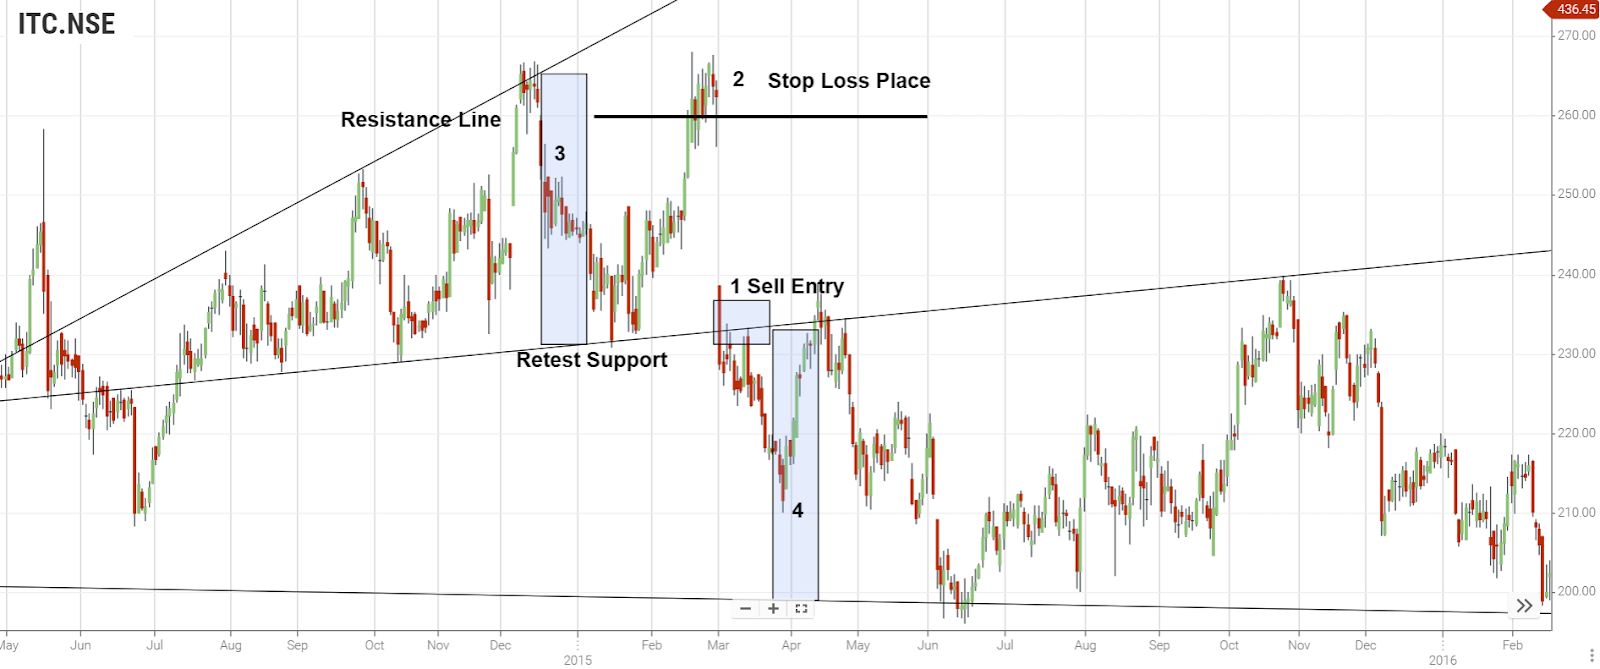
It is observed that price moves below the support trendline causing a breakout. But it is observed that the price has once again moved up . Thus a new support and resistance trendline is formed. Enrich Money provides the best tools to identify the perfect support and resistance trendline for the traders.
Again the price has moved down , causing a breakout at the support trendline. In these cases, traders must wait to avoid false breakout signals. Once the breakout is confirmed, the traders can place a short sell entry at ‘retest support’ line and a stop loss order at newly formed resistance line . And the target distance is calculated and a target profit order is placed at the same distance below the retest support line for the buy exit .
1- Sell order (short entry)
2- Stop loss
3- Take profit
Profit Target: Alike Technique 1, the profit target is calculated by taking the height of the Back of the wedge and by expanding that distance down from the entry.
Conclusion
Thus a “Right angled ascending broadening wedge pattern” indicates a likely selling opportunity after an uptrend or an existing downtrend.
The entry (sell order) is positioned when the price breaks below the bottom of the horizontal support line of the wedge or when the price finds resistance at the lower trend line.
The stop loss is positioned above the Back of the wedge.
The take profit target is calculated by taking the height of the Back of the wedge and by expanding that distance down from the entry.
Frequently Asked Questions
What is a Partial Rise?
It can be termed a partial rise after the two trend lines have been formed. The pattern can be identified when the price rises off the lower trend line and doesn’t reach the upper trend line before falling back to the lower trend line.
What is a Partial Decline?
It can be termed a partial decline when the price falls off the upper trend line and doesn’t reach the lower trend line before rising back to the upper trend line.
What is the rising expanding wedge pattern?
The rising expanding wedge pattern is a technical chart formation characterized by upward-sloping diverging trendlines, creating a widening price range. It signals potential bearish reversal as the pattern suggests diminishing upward momentum and increased volatility, often leading to a downside breakout.
What is the broadening triangle pattern?
The broadening triangle pattern is a technical chart pattern characterized by diverging trendlines, forming a shape resembling an expanding cone (megaphone). This pattern suggests increased volatility and potential indecision in the market, often signalling uncertainty and a potential reversal.
What is a right angle triangle chart pattern?
The right-angled triangle chart pattern is a technical formation characterized by converging trendlines, creating a right angle. It consists of a horizontal support or resistance level and is often seen as a continuation pattern, suggesting a potential breakout in the direction of the prevailing trend. Traders commonly use it to identify price consolidation before a significant price movement.