Knowledge Center Technical Analysis
Continuation Pattern
Ascending or Symmetrical Triangle
The ascending triangle is a pattern in trading charts. Unlike the symmetrical triangle, it has one flat side and one sloping side.
An ascending triangle pattern in trading charts has a flat top resistance line and a sloping bottom line, forming higher lows. This suggests weakening resistance and a potential upward breakout. The rising lows indicate growing strength in buyers, offering a chance to consider buying. This lesson will teach you two methods for trading using ascending triangles.
Recognizing the Ascending Triangle Pattern in Trading
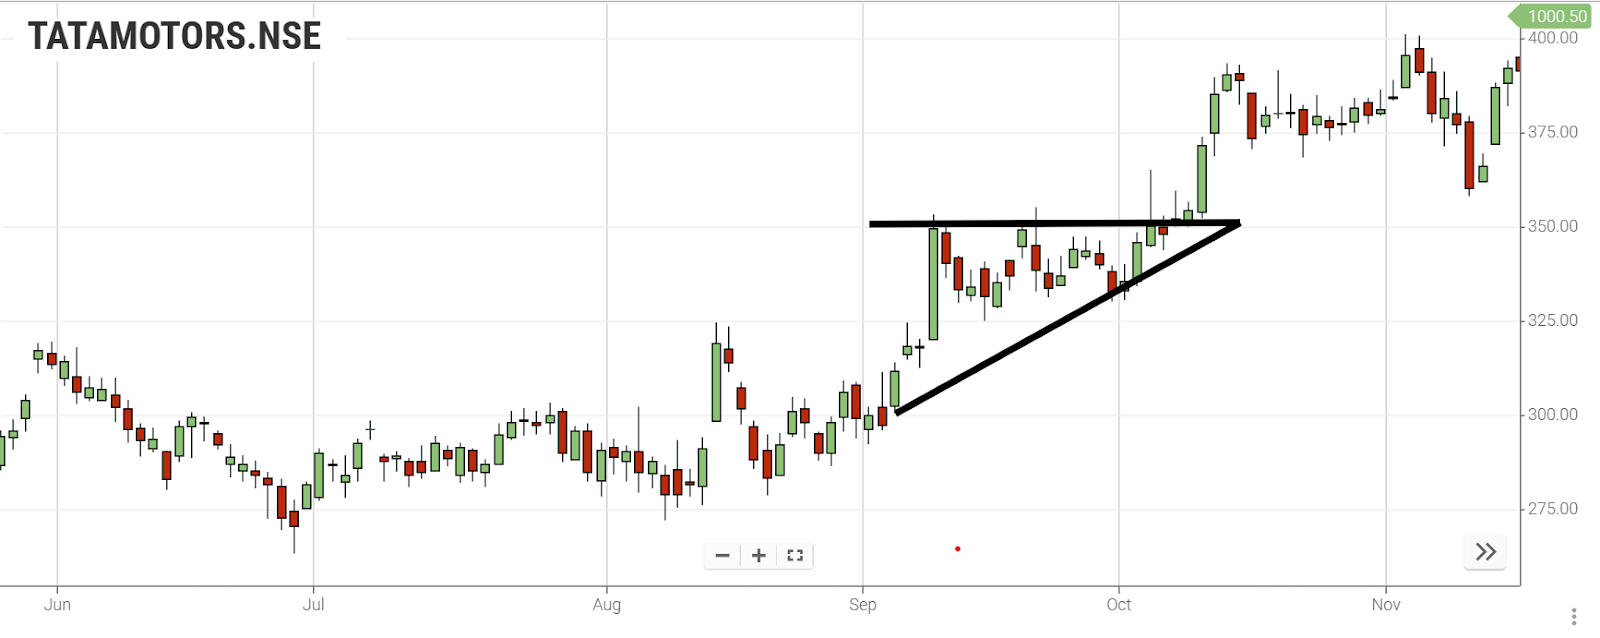
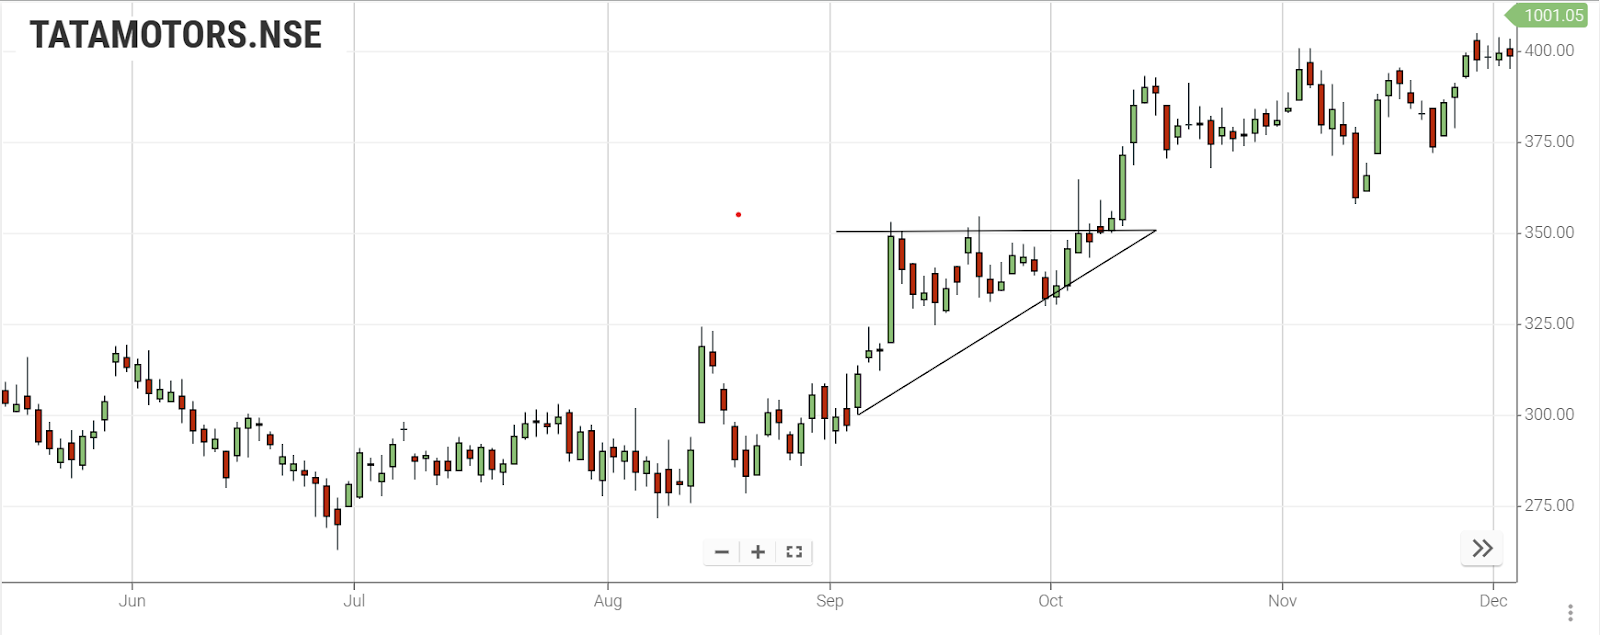
The chart below illustrates the appearance of an ascending triangle pattern.
Trading with Ascending Triangles: Method One
A strategy for trading with an ascending triangle is to enter the market when the resistance level is breached and the price begins to rise.
You can set the stop loss below the upward-sloping side of the triangle pattern and determine the profit target by measuring the height of the back of the ascending triangle and extending that distance up from the breakout trend line.
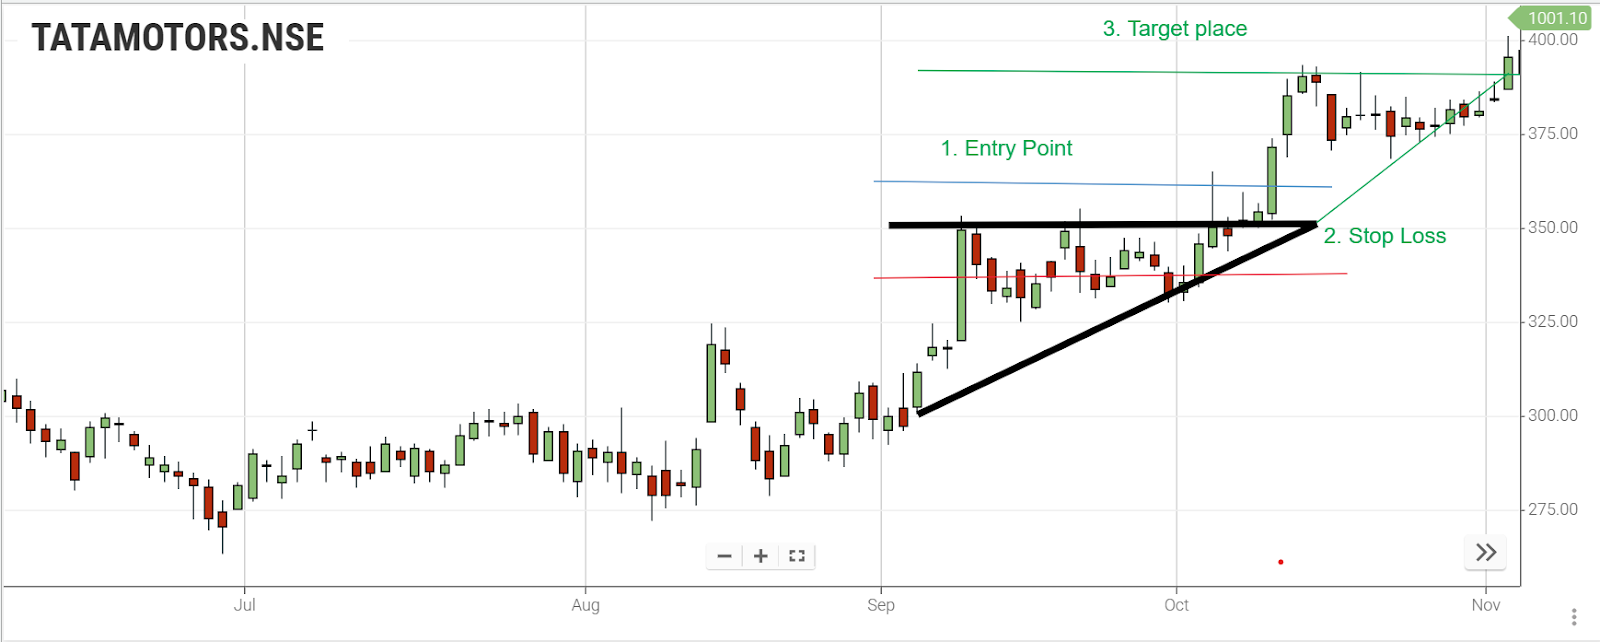
The chart below shows where to position the entry (blue), stop loss (red), and take profit levels (green).
-
Entry: Place the trade when the price breaks out of the triangle pattern to the upside.
-
Stop Loss: Set the stop loss just below the sloping side of the triangle.
-
Profit Target: Position the profit target at the same distance as the back of the triangle from the breakout point.
Trading with Ascending Triangles: Method Two
The alternative approach is to wait for the price to break out of the triangle, surpassing the resistance level as demonstrated in the initial example. Then, consider placing a buy order during the retest of the previous support line, where the broken resistance now acts as support.
Place the stop loss just below the newly formed support area, and keep the profit target consistent with the first example—align it with the length of the back of the triangle.
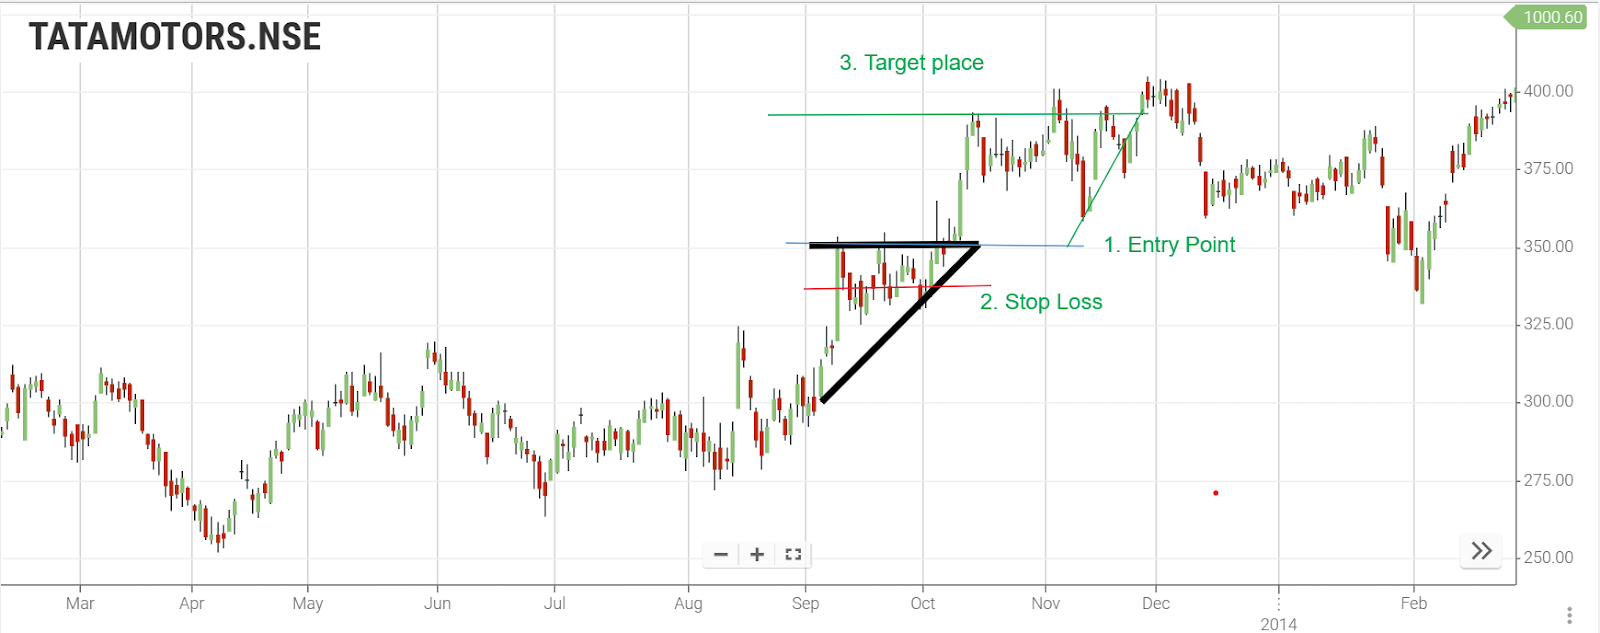
The chart below illustrates the second method for trading the ascending triangle pattern. It indicates the entry point, stop loss, and take profit levels.
-
Long entry- enter the trade for a long position.
-
Set the stop loss just under the support line.
-
Set the profit target at a distance equal to the back of the triangle above the entry point.
Nutshell
Up to this point, you've discovered that:
-
An ascending triangle pattern suggests weakening resistance and a potential upward trend, offering a chance to buy.
-
You can enter the trade after the resistance level is broken, either during the breakout or when there's a retest of the upper line.
-
Place the stop loss just below the lower sloping level to manage risks.
-
Determine the take profit level by measuring the distance from the back of the triangle and extending that same distance upward from the entry point.
Frequently Asked Questions
-
What are ascending and symmetrical triangle patterns in trading?
Ascending triangles have a flat top and a sloping bottom, indicating potential upward movement. Symmetrical triangles are characterized by two sloping sides meeting at a point, suggesting a potential breakout.
-
How can I identify ascending triangle patterns in stock charts?
Ascending triangle patterns feature a flat top resistance line and a rising trendline at the bottom, creating higher lows. Understanding these patterns is essential for making well-informed trading choices.
-
When is the right time to enter a trade using ascending triangles?
Enter a trade when the price breaks above the resistance level of the ascending triangle, signaling a potential upward move. This breakout often presents a buying opportunity.
-
How Do I Set Stop Loss and Profit Targets When Trading Ascending Triangles?
Place the stop loss just below the sloping side of the triangle to manage risks. Determine the profit target by measuring the height of the back of the triangle and extending that distance upward from the breakout point.
-
Are there specific stocks known for ascending triangle pattern breakouts?
Yes, certain stocks exhibit ascending triangle pattern breakouts. Monitoring these stocks can provide valuable insights for traders looking for profitable opportunities.
-
What Are Symmetrical Triangle Patterns, and How Do They Impact Trading Strategies?
Symmetrical triangles, with two converging trendlines, indicate a period of consolidation. A breakout from this pattern can signal a significant price movement, impacting trading strategies and decision-making.