Knowledge Center Technical Analysis
Continuation Pattern
Bullish Pennant Chart Pattern
Introduction
A Bullish Pennant Pattern is a continuation pattern characterized by a small symmetrical triangle, or pennant, that forms after a strong upward price movement. It signals a brief consolidation before the uptrend resumes. Traders often anticipate a bullish breakout when the price moves above the pennant's upper trendline, confirming the continuation of the previous upward trend.
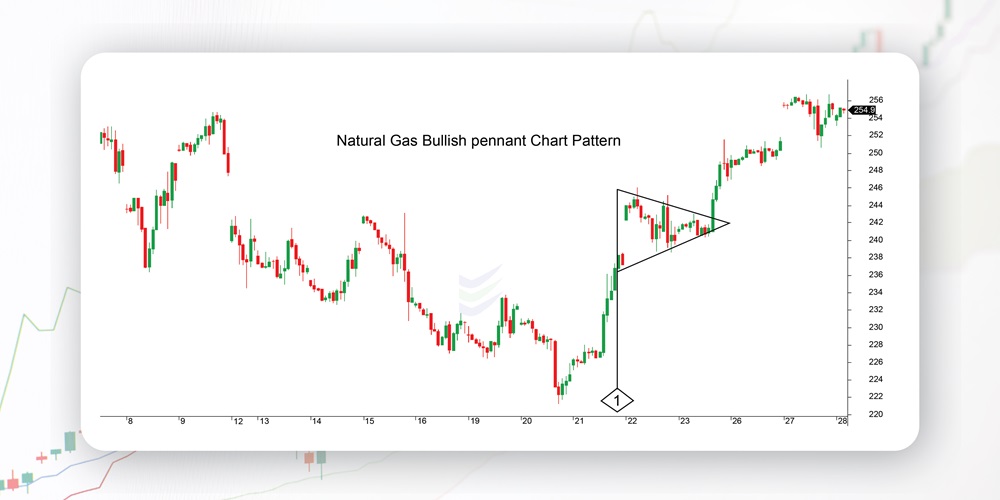
Number 1: Pole of the pattern
The pole indicates the start or the continuation of the uptrend.
The pole is necessary for the calculation part in placing the profit target for a buy trade.
This pattern is hard to spot as the size of the triangular pennant is relatively tiny compared to the size of the entire uptrend.
How does a Bullish Pennant Chart pattern look like?
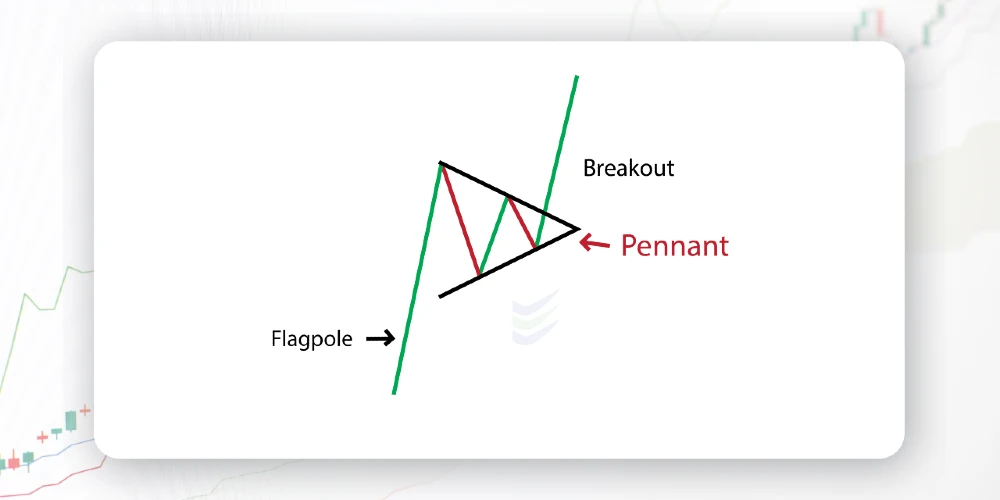
A Bullish Pennant is characterized by the following features:
Flagpole: The Pennant Chart pattern typically begins with a strong and upward price movement, known as the flagpole. This represents the initial surge in the price.
Pennant: Following the flagpole, a small symmetrical triangle or pennant forms, representing a brief consolidation period. The bull pennant is formed by converging trend lines that create a triangular shape.
Breakout: The bull pennant chart pattern is completed with a bullish breakout when the price moves above the upper trendline of the pennant. This breakout signals the resumption of the prior upward trend, and traders often look for buying opportunities at this point.
When does a Bullish Pennant Chart pattern is formed?
A Pennant Pattern is typically formed under the following conditions:
Strong Uptrend: The pattern usually forms after a significant and sustained upward price movement, known as the flagpole. This indicates a strong bullish trend in the market.
Consolidation Period: Following the flagpole, a brief consolidation period occurs, and a small symmetrical triangle or pennant takes shape. This consolidation represents a temporary pause in the uptrend.
Decreasing Volume: During the consolidation period, trading volume often diminishes. This decrease in volume signals a contraction of volatility and suggests that the market is catching its breath before potentially resuming the upward momentum.
Bullish Breakout: The Bullish patterns is completed when the price breaks out above the upper trendline of the pennant. This breakout signals a continuation of the prior uptrend, and traders may interpret it as a bullish confirmation.
Confirmation Signals: Traders may use additional technical indicators or confirmation signals, such as an increase in volume upon the breakout, to validate the strength of the Bullish Chart pattern.
What does a Bullish Pennant Chart pattern indicate?
A pennant candlestick pattern indicates several key aspects:
Continuation of Uptrend: The primary signal of a Bullish Penant is that it suggests a continuation of the existing uptrend in the market. The pattern forms after a strong upward price movement, indicating that the bullish momentum is likely to persist.
Brief Consolidation: The formation of a small symmetrical triangle or bull flag pennant signifies a brief consolidation or pause in the market. This consolidation is often interpreted as a period of rest or equilibrium before the uptrend resumes.
Potential Buying Opportunity: Traders often view the breakout from the upper trendline of the pennant as a potential buying opportunity. The bullish breakout suggests that buyers are regaining control, and the upward momentum may pick up again.
Volume Analysis: Examining trading volume during the formation and breakout of the Bullish Pennant is essential. Typically, a decrease in volume during the pennant formation followed by an increase in volume upon the breakout can provide confirmation of the pattern's validity.
Price Target: Some traders use the height of the flagpole (the initial upward price movement) to estimate a potential price of bullish pennant target for the continuation of the uptrend after the breakout.
Confirmation Signals: Traders may look for confirmation from other technical indicators, such as moving averages or oscillators, to strengthen their confidence in the Bullish Pennant pattern.
Caution with False Breakouts: While the penant pattern is generally considered bullish, false breakouts can occur. Traders should exercise caution and wait for confirmation signals to reduce the risk of entering a trade based solely on the pattern.
Market Sentiment: The pattern bullish formation reflects a positive market sentiment, indicating that buyers are still active and willing to push the price higher.
How to trade when you see a Bullish Pennant Chart pattern?
Trading a Pennant Patterns involves a systematic approach to take advantage of the potential continuation of an uptrend. Let’s analyze the Bullish Pennant chart pattern with the help of a charts.
Technique 1:
Trade as soon as the price breaks out of the triangle pattern.
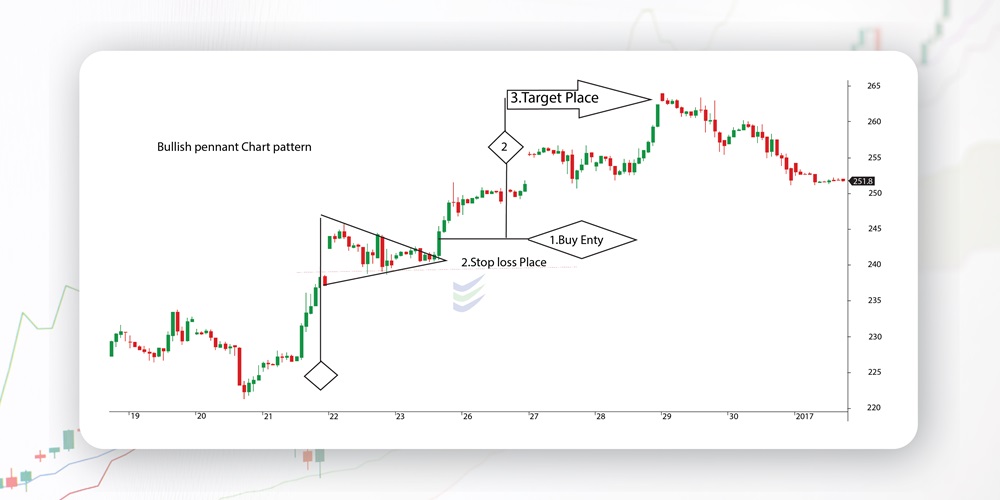
Description of the Chart Pattern Pennant
1 – Long Buy order is executed by the trader (Enter the trade when the candlestick has closed above the pennant’s upper trend line.)
2 – Stop loss order will be executed (Place your stop loss on the other side of the pennant, just below its lower trend line.)
3 – Profit Target Distance (Before the consolidation of the market, measure the initial rise in price. Place the profit target the same distance above the pennant’s breakout point.)
Pole No.1: Pole of the pattern
Pole No. 2: Profit target distance (same height as pole number 1)
Technique 2:
Wait for the price to rise above the pennant’s upper trend line.
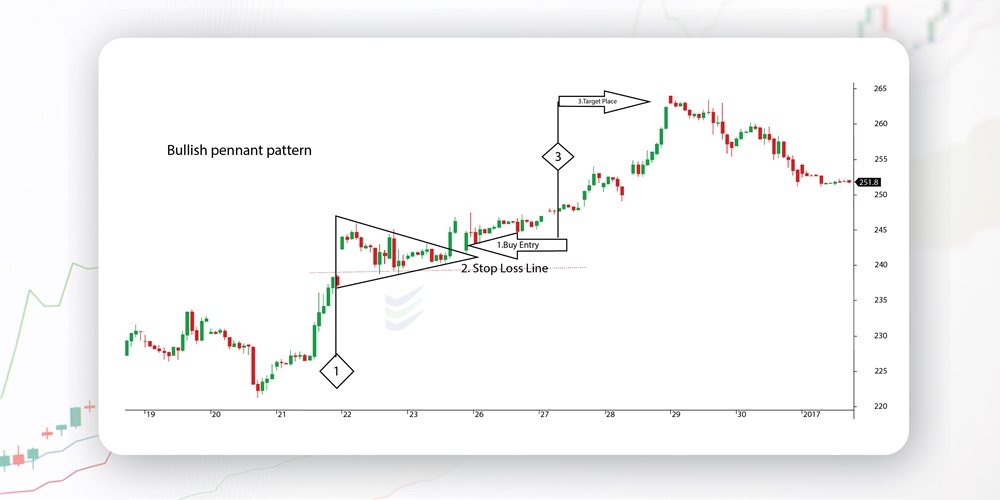
Description of the Chart Pattern Pennant
1 – Long Buy order is executed by the trader (Enter your trade as soon as the price rises above the pennant's upper trend line.Once resistance breaks, place a buy order after the price retests that trend line.)
2 – Stop loss order will be executed (The broken resistance now becomes support level. Place your stop loss below the new support area.)
3 – Profit Target Distance (Measure the size of the pennant's pole. Place your profit target an equal distance above the pennant's breakout. (Entry of our trade))
Pole No.1: Pole of the pattern
Pole No. 3: Profit target distance (same height as pole number 1)
In a nutshell, the steps to consider during Pennant Pattern Trading
Identification of the Bullish Pennant:
Recognize the formation of a Bullish Pennant on the price chart. This includes identifying a preceding strong upward price movement (flagpole) followed by a consolidation period forming a small symmetrical triangle (pennant).
Confirmation with Volume Analysis:
Confirm the pattern by analyzing trading volume. During the consolidation period (formation of the pennant), there should be a decrease in volume, and upon the breakout, an increase in volume can strengthen the validity of the pattern.
Wait for the Bullish Breakout:
Exercise patience and wait for a clear breakout above the upper trendline of the pennant. The breakout should be accompanied by increased volume and signify a resumption of the prior uptrend.
Entry Point:
Consider entering a long (buy) position once the price convincingly breaks above the upper trendline of the pennant. Some traders may wait for a close above the trendline to confirm the breakout.
Stop-Loss Placement:
Implement a risk management strategy by placing a stop-loss order below the breakout point. This helps limit potential losses in case the breakout is a false signal.
Target Levels:
Set potential target levels based on the height of the flagpole. Some traders measure the flagpole's height and project this distance upward from the breakout point to estimate a target level.
Monitor for Confirmation Signals:
Keep an eye on confirmation signals from other technical indicators, such as moving averages or momentum oscillators, to strengthen the confidence in the bullish bias.
Regularly Review and Adjust:
Regularly review the trade and adjust stop-loss or take-profit levels based on the evolving market conditions. This helps manage risk and maximize potential profits.
Consider the Broader Market Context:
Take into account the broader market context and consider fundamental factors that could impact the asset. Positive news, earnings reports, or changes in market sentiment can reinforce the bullish outlook.
Be Prepared for Alternatives:
Be prepared for alternative scenarios. While the Bullish Pennant suggests a continuation of the uptrend, unexpected market developments could impact the trade. Having a plan for managing unforeseen events is crucial.
Frequently asked questions
What role does volume play in the Bullish Pennant pattern?
Volume analysis is crucial in confirming the validity of the Bullish Pennant pattern. During the consolidation period (pennant formation), a decrease in volume is expected, and a breakout with an increase in volume strengthens the bullish signal.
How do I trade a Bullish Pennant pattern?
Trading a Bullish Pennant involves waiting for a bullish breakout above the upper trendline of the pennant. Traders may enter a long position after the breakout, with a stop-loss below the breakout point and target levels based on the flagpole's height.
Can the Bullish Pennant pattern fail or result in a false breakout?
Yes, false breakouts can occur, and the pattern is not foolproof. Traders should exercise caution, wait for confirmation signals, and consider the broader market context to reduce the risk of false signals.
Can the Bullish Pennant pattern be applied to different timeframes?
Yes, the Bullish Pennant pattern can be identified on various timeframes, from short-term charts to longer-term charts.
Are there variations of the Bullish Pennant pattern?
While the classic Bullish Pennant involves a symmetrical triangle, variations include pennants with slightly different shapes. Traders may also encounter similar patterns like the Bullish Flag, which has a rectangular shape.