Knowledge Center Technical Analysis
Continuation Pattern
Bearish Flag Chart Pattern
What is a bear flag pattern?
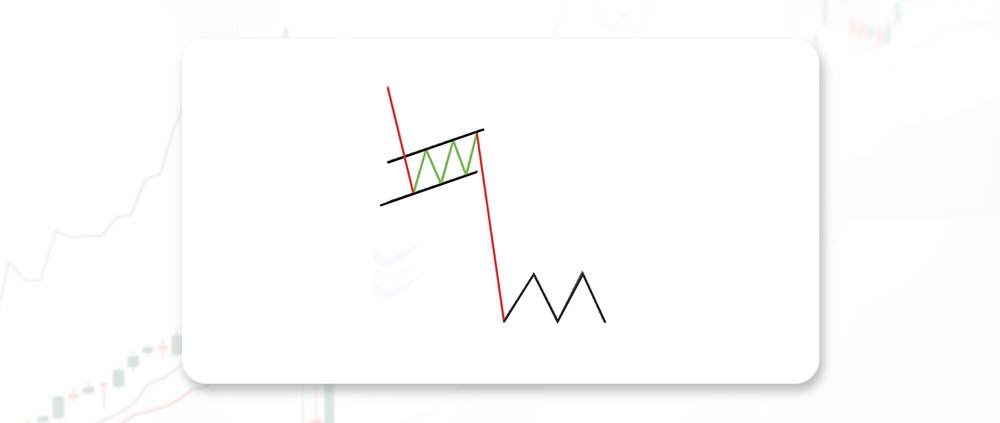
A bearish chart pattern is a technical analysis pattern that traders and investors use to identify potential opportunities in financial markets. It is considered a bearish continuation pattern, suggesting that a previous downtrend is likely to continue after a temporary consolidation or correction. This pattern is characterized by its distinct shape, which resembles a flag on a flagpole, hence the name "bearish flag."
How does a Bearish Flag Chart pattern look like?
A bearish flag chart pattern is characterized by its distinct appearance, which resembles a flag on a flagpole. Here's a detailed description of what a bear chart pattern looks like:
Flagpole: The flag pattern bearish begins with a strong and sharp downward price movement, which is referred to as the "flagpole." This initial leg of the pattern represents a significant and rapid decline in the asset's price.
Flag: Following the flagpole, the price enters a consolidation or correction phase, forming a distinct flag-like pattern. The flag is typically a rectangular or parallelogram shape, and it slopes against the direction of the previous trend. If the preceding trend was bearish (downward), the flag will usually slope upward. The flag's width is generally narrower than the flagpole's length.
Support and Resistance Lines: Within the bearish chart patterns, two key lines are often drawn:
Upper Boundary (Resistance): This is a trendline drawn along the upper edge of the flag, connecting the peaks within the consolidation phase. It represents a level where selling pressure may be stronger.
Lower Boundary (Support): This is a trendline drawn along the lower edge of the flag, connecting the troughs within the consolidation phase. It represents a level where buying interest may be stronger.
Volume: During the formation of the flag pattern, trading volume tends to decline. This decrease in volume indicates a decrease in market participation and can be seen as a sign of consolidation.
Breakout: The bearish flag pattern is considered complete when the price breaks below the lower boundary (support) of the flag. This breakout typically occurs in the same direction as the preceding downtrend, confirming the bearish sentiment.
Price Target: To estimate a potential price target for the continuation of the downtrend after the breakout, traders often measure the height of the flagpole (the initial sharp decline) and project it downward from the point of the breakout. This projected distance provides a rough target for the expected price decline.
Confirmation: Traders often use additional technical indicators or analysis methods to confirm the bearish flag pattern before making flag pattern trading decisions. This can include looking for bearish flag pattern candlestick, using oscillators like the Relative Strength Index (RSI), or considering fundamental factors that support the bearish outlook.
When does a Bearish Flag Chart pattern is formed?
A Bearish Flag Chart pattern is formed as a result of specific price movements in a financial market. It typically consists of several distinct stages, and here is a detailed breakdown of when and how a Bearish Flag Chart pattern is formed:
Prior Downtrend: A Bearish Flag and pole begins to form after a prolonged and pronounced downward price movement, which is often referred to as the "flagpole." This preceding downtrend flag pattern signifies a period of strong selling pressure in the market.
Flag Formation: Following the sharp decline (flagpole), the price enters a consolidation or correction phase, giving rise to the flag portion of the pattern. During this consolidation phase, the price moves in a narrower range compared to the flagpole's decline. The shape of this consolidation is typically rectangular or parallelogram-like and is visually similar to a flag flying on a flagpole.
Duration: The flag pattern can vary in duration. It can be relatively short-term, lasting a few days, or extend over several weeks, depending on the timeframe of the chart being analyzed.
Volume: As the Bearish Flag pattern takes shape, trading volume often decreases. This diminishing volume indicates a decrease in market participation and reflects a period of indecision or equilibrium between buyers and sellers.
Support and Resistance Levels: Traders often draw trendlines along the upper boundary (resistance) and lower boundary (support) of the flag. These trendlines help define the consolidation phase and can serve as reference points for potential breakout levels.
Breakout: The Bearish Flag pattern is considered complete when the price breaks below the lower boundary (support) of the flag. This breakout usually occurs in the same direction as the preceding downtrend, signifying a resumption of bearish momentum. The bearish flag pattern breakout is a critical signal for traders to take action.
Confirmation: To enhance the reliability of the bear chart patterns, traders often look for additional confirmation signals. This can include using technical indicators such as the Relative Strength Index (RSI) or Moving Averages, as well as considering fundamental factors that align with the bearish outlook.
Price Target: Traders often use the length of the flagpole (the initial sharp decline) to estimate a potential price target for the continuation of the downtrend. They measure the height of the flagpole and project it downward from the point of the breakout. This projected distance provides a rough target for the expected price decline.
What does a Bearish Flag Chart pattern indicate?
A Bear Flag Chart pattern is a technical analysis pattern that provides specific indications about the potential future price movement in a financial market. In detail, here's what a Bearish Chart pattern indicates:
Continuation of a Downtrend: The primary indication of a Bearish Flag Chart pattern is that it suggests the continuation of a prior downtrend. This means that after a period of consolidation or correction (the flag), the price is likely to resume its previous downward movement. The flag pattern chart represents a temporary pause or consolidation within a larger bearish trend.
Bearish Sentiment: The pattern reflects bearish sentiment in the market. During the flag formation, sellers are still in control, and while the price consolidates, it's an indication that sellers are not willing to let the market reverse significantly. The subsequent breakout below the flag's lower boundary signals the persistence of bearish pressure.
Short-Term Trading Opportunity: For traders, the flag trading pattern provides a potential short-term trading opportunity. Traders who are bearish on the asset can look for opportunities to enter short positions (selling the asset with the expectation of profiting from a price decline) after the breakout from the flag.
Target Price Estimate: The pattern offers a rough estimate of a potential price of pattern bearish pattern target for the continuation of the downtrend. Traders commonly use the height of the flagpole (the initial sharp decline) to project a target price for the next leg down. They measure the flagpole's length and project it downward from the breakout point to estimate where the price may reach.
Risk Assessment: The Bearish Flag pattern also helps traders assess risk. The breakout point, where the price exits the flag formation, can serve as a reference for placing stop-loss orders. This allows traders to limit potential losses if the market unexpectedly reverses.
Confirmation: Traders often seek additional confirmation signals to increase the reliability of the Bearish Flag pattern. This can involve analyzing other technical indicators (e.g., RSI, MACD) or looking for other bearish patterns or candlestick flag pattern formations that align with the bearish outlook.
Market Psychology: The pattern reflects market psychology, indicating that after a strong downtrend, traders may take a breather or consolidate their positions, creating the flag. However, the underlying bearish sentiment remains, leading to the eventual breakdown and resumption of the downtrend.
Timeframe: The duration of the Bearish Flag pattern can vary, ranging from short-term patterns lasting a few days to longer-term patterns spanning several weeks or even months. The duration can provide insights into the potential magnitude of the price move.
How to trade the Bearish Flag pattern?
Trading a Flag pattern in chart involves a systematic approach to capitalize on the anticipated continuation of a downtrend. Let's analyze the bearish flag chart pattern with the help of a chart.
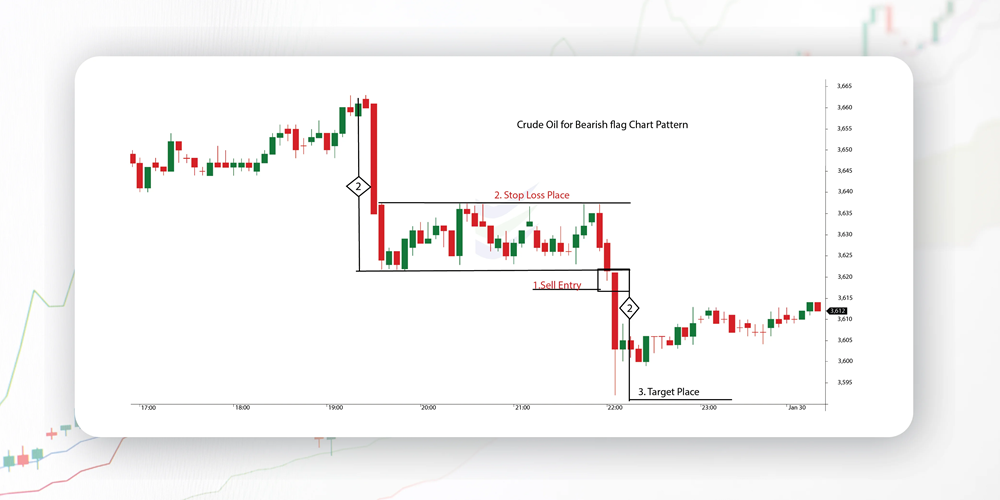
Description of the bearish flag chart pattern
1 - Sell entry When the price crosses below the support line, where a breakout is expected to occur, Place your sell entry.
2 - Stop loss order Place your stop loss order at the point just above the resistance line.
3 - Take profit
Here's a detailed step-by-step guide on how to trade when you see a Bearish Flag Chart pattern:
Confirm the Pattern: Ensure that you've correctly identified a Bearish Flag Chart pattern. Verify that there is a prior downtrend (flagpole), followed by a consolidation phase (flag), and decreasing volume within the flag.
Set Up Your Chart: Use a flag trading platform that allows you to draw trendlines and identify support and resistance levels within the pattern.
Determine Bearish Flag Pattern Entry and Exit Points:
Entry Point: Plan your entry point for a short (selling) trade. The entry point is typically just below the lower boundary (support) of the flag, which is where the breakout is expected to occur.
Stop-Loss: Place a stop-loss order just above the upper boundary (resistance) of the flag to limit potential losses if the trade goes against you. This level should be chosen based on your risk tolerance and the specific characteristics of the pattern.
Take Profit: Calculate your take-profit level based on the estimated price target. This level is usually derived from the height of the flagpole and projected downward from the breakout point.
Risk Management: Determine the position size based on your risk tolerance and the distance between your entry point and stop-loss level. Ensure that you are not risking more than a predetermined percentage of your trading capital on this trade.
Entry Order: Place a sell entry order slightly below the lower boundary of the flag, just before the anticipated flag pattern breakout. This order should execute automatically when the price reaches the specified level.
Monitor Confirmation Signals: Keep an eye on confirmation signals to enhance the reliability of the trade. Look for additional bearish indications such as bearish flag candle patterns (e.g., shooting star, bearish engulfing) or negative readings on technical indicators like the Relative Strength Index (RSI) or Moving Averages Convergence Divergence (MACD).
Monitor the Trade: Once the trade is executed, monitor it closely. Pay attention to price movements and potential signs of reversal or weakness.
Adjust Stop-Loss: If the flag pattern in trading moves in your favour, consider adjusting your stop-loss level to lock in profits or reduce potential losses. This is known as trailing your stop.
Manage the Trade: Continually assess the trade and make adjustments as necessary. If the price reaches your take-profit level, consider closing the trade to secure your profits. If the trade is not performing as expected, adhere to your stop-loss and exit the trade.
Evaluate and Learn: After the trade is closed, evaluate your trading strategy. Assess whether the Bearish Flag Chart pattern trade was successful and identify areas for improvement. Learning from your trades is essential for continuous improvement.
Frequently asked questions
What does decreasing volume within the flag indicate in stock analysis?
Decreasing volume during the flag phase suggests a reduction in market participation and can indicate a temporary balance between buyers and sellers. This is common in consolidation patterns.
How can traders confirm the validity of a Bearish Flag pattern in stock analysis?
Confirmation can be sought by waiting for a breakout below the lower boundary (support) of the flag. The breakout should be accompanied by increased volume and preferably align with other bearish indicators or patterns.
How do I set a price target when trading a Bearish Flag pattern in stocks?
To estimate a price target, measure the height of the flagpole (the initial sharp decline) and project it downward from the point of the breakout. This provides a rough target for the expected price decline.
What are the risk management considerations when trading Bearish Flag patterns in stocks?
It's essential to set stop-loss orders just above the upper boundary of the flag to limit potential losses if the trade goes against you. Position sizing should also be based on your risk tolerance and the distance between entry and stop-loss levels.
Can I use other technical indicators with Bearish Flag patterns in stock analysis?
Yes, traders often use additional technical indicators such as moving averages, Relative Strength Index (RSI), or MACD to complement the analysis and increase the confidence in their trading decisions.
What is the inverted flag and pole pattern?
The term "inverted flag and pole pattern" does not correspond to a recognized or standard technical chart pattern in trading or technical analysis. It appears to be a misunderstanding or a misinterpretation of typical chart patterns.
What is the flag triangle pattern?
A "flag triangle pattern" is not a recognized or standard technical chart pattern in trading or technical analysis. It appears to be a combination of two distinct chart patterns: the flag pattern and the triangle pattern.