Knowledge Center Technical Analysis
Continuation Pattern
Bullish Rectangle Chart Pattern
Rectangles are patterns that happen when prices take a break in a strong trend. They bounce between two parallel lines before the trend goes on. There's a bullish (good) and a bearish (bad) type. This lesson teaches how to find the bullish rectangle, which can be a chance to buy.
How to Spot or identify the bullish rectangle
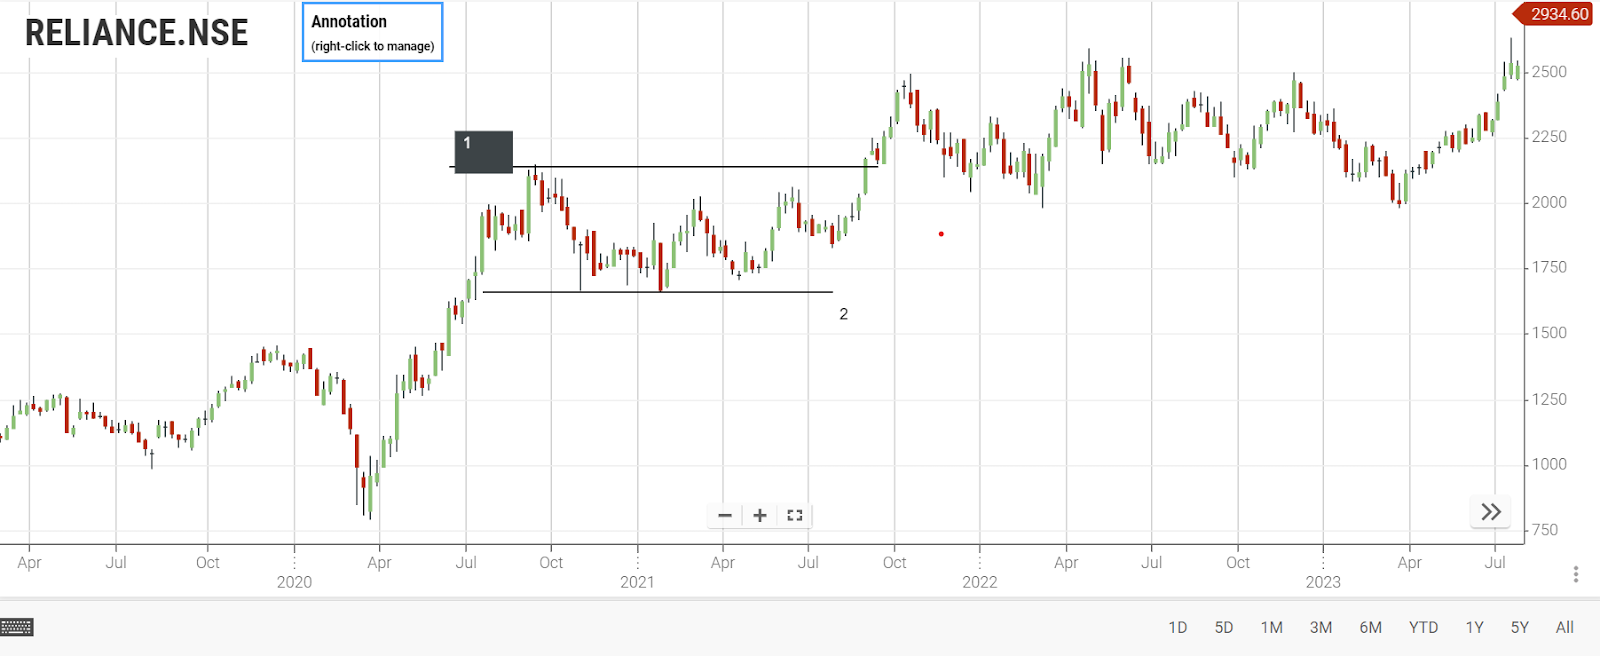
Bullish rectangles are simpler to recognize compared to certain patterns like pennants. Below is a price chart example illustrating what a bullish rectangle looks like.
-
Resistance line
-
Support line
In the given illustration, the price goes up strongly and then begins to stabilize between temporary support and resistance levels.
It moves sideways, bouncing between these parallel lines, shaping a box-like pattern, which is why it's called a bullish rectangle.
Eventually, the price breaks out above the upper resistance level and keeps going up in its trend.
Trading the Bullish Rectangle Pattern: Method 1
We will now present two methods for trading the bullish rectangle pattern.
Execute your trade
as soon as a candlestick closes above the upper parallel line of the rectangle pattern (representing the resistance level) by placing a long (buy) order.
Place Stop Loss
Put your stop loss just below the lower parallel line of the rectangle, which is also known as the support level.
Place Profit Target
Determine the rectangle's height and set your profit target at the same distance above the upper parallel line of the rectangle.
Refer to the chart below for a visual example of Method 1 strategy:
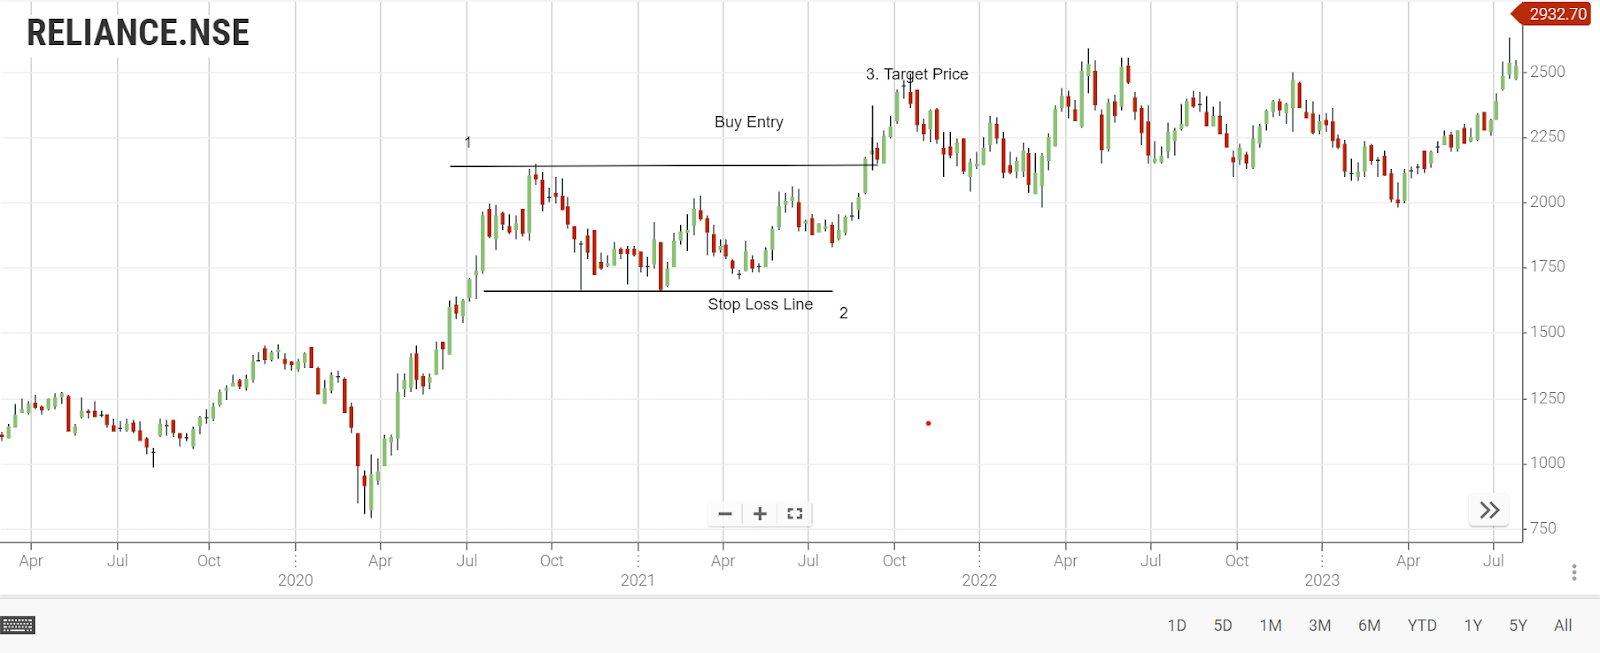
Number 1: Resistance line
Number 2: support line
Number 3: Area where the price has surpassed the first resistance level.
1 Buy order (long entry)
2 Stop loss
3 Take profit
Trading the Bullish Rectangle Pattern: Method 2
The following method outlines the second approach to trading the bullish rectangle chart pattern.
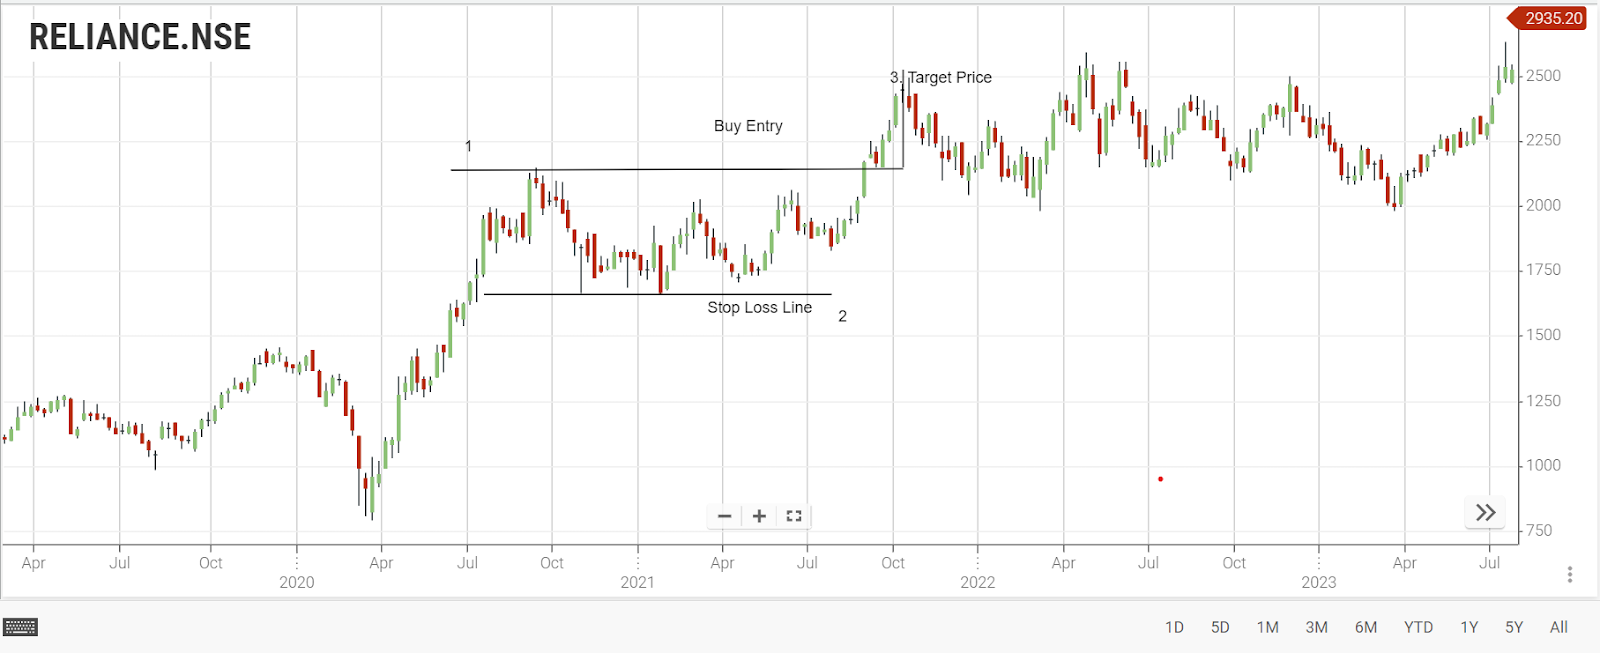
Number 1: Resistance turned support
Number 2: Support
1. Buy order (long entry)
2. Stop loss
3. Take profit
Execute your trade
Enter your trade by following a similar process as method 1: wait for a candlestick to close above the upper parallel line, indicating a breakout from the rectangle's resistance. Subsequently, wait for the price to retest the upper line, which has now become a support level, and place your buy order.
Place Stop Loss
Set your stop loss just below the upper parallel line of the rectangle pattern, which was previously the resistance level and has now become support.
Set your Profit target
Determine your profit target by measuring the height of the rectangle pattern and placing it at the same distance above the upper parallel line, mirroring the strategy used in Method 1.
NutShell
-
Bullish Rectangles as Continuation Patterns:
Bullish rectangles occur when prices pause temporarily in an uptrend, presenting a buying opportunity.
-
Entry Points:
Method 1: Enter the trade after the rectangle's upper resistance level is broken.
Method 2: Enter the trade after the resistance level is broken and then retested.
-
Setting Stop Loss:
Method 1: Place the stop loss below the rectangle's lower support line.
Method 2: Set the stop loss under the higher parallel line once it becomes a support.
-
Profit Target:
Set the profit target at the same distance above the rectangle's upper resistance level as the distance between the two parallel lines.
Frequently Asked Questions
1. What is a rectangle chart pattern?
A rectangle chart pattern is a technical analysis pattern in stock market trading where prices move between parallel horizontal lines, indicating a period of consolidation before a potential breakout.
2. How Is a Rectangle Pattern Different from a Box Pattern in the Stock Market?
A rectangle pattern and a box pattern are interchangeable terms. Both refer to the same technical analysis pattern where the price action creates a rectangular shape, signifying consolidation in the market.
3. What Is a Bullish Pattern Chart?
A bullish pattern chart refers to any pattern that indicates a potential upward movement in stock prices. A rectangle pattern, when broken to the upside, becomes a bullish pattern, suggesting a potential buying opportunity.
4. How Does a Rectangle Pattern Breakout Occur?
A rectangle pattern breakout happens when the price breaks above the upper horizontal line of the rectangle, indicating a potential upward movement. Traders often consider this breakout as a signal to enter a long (buy) trade.
5. What Are the Strategies for Rectangle Pattern Trading?
Breakout Strategy: Enter a trade when the price breaks above the upper line of the rectangle pattern. Place a stop loss below the lower line.
Retest Strategy: Enter after the breakout, wait for the price to retest the upper line (now acting as support), and then place a buy order. Set a stop loss below the retest level.
6. How Many Chart Patterns Exist in Trading?
There are numerous chart patterns in trading, including but not limited to rectangles, triangles, flags, pennants, heads and shoulders, and double tops/bottoms. Each pattern has unique characteristics and trading implications.
7. How Many Types of Chart Patterns Are There in the Stock Market?
In the stock market, there are several types of chart patterns based on price movements and formations. These include reversal patterns (indicating potential trend reversal) and continuation patterns (indicating the current trend will continue). Some patterns, like rectangles, can be both consolidation and continuation patterns, depending on the market context.