Knowledge Center Technical Analysis
Continuation Pattern
Bullish Flag Chart Pattern
Flag Chart Pattern
-
The flag chart is a popular technical analysis pattern used by traders and investors to identify potential trend continuation signals.
-
It is named for its appearance, which resembles a flagpole and a flag waving in the wind.
-
The flag pattern occurs when a trending price pauses and goes back over slightly in a rectangular range.
-
This pattern allows us to enter the market in the middle of a trend.
-
The break out in price continues its original strong trend, giving us the chance to enter that trend at a better price than before the flag's formation.
-
The pole and flag pattern is usually a short-term consolidation phase that occurs after a strong price move in either an upward (bullish) or downward (bearish) direction.
Introduction
A bullish flag chart pattern is a technical analysis pattern that occurs in financial markets and is considered a continuation pattern.
The bullish flag pattern typically indicates a temporary consolidation or pause in an existing upward trend before the price resumes its upward movement.
The flag pattern occurs when a trending price pauses and goes back over slightly in a rectangular range.
This pattern allows us to enter the market in the middle of a trend.
The break out in price continues its original strong trend, giving us the chance to enter that trend at a better price than before the flag's formation.
How does a Bullish Flag Chart pattern look like?
A Bullish Flag and pole pattern consists of two main components: a flagpole and a flag. Here's how it looks:
Flagpole: The flagpole is the initial part of the pattern and represents a strong, sharp, and usually vertical upward price movement. It's often characterized by a rapid increase in price over a relatively short period. The flagpole resembles the pole of a flagpole.
Flag: Following the flagpole, there is a period of consolidation or sideways movement, which forms the flag . This indicates price stabilization. Here, the flag is usually rectangular or parallelogram-shaped and slopes slightly downward against the prevailing trend. It's important to note that the flag is a continuation pattern, and it can be considered a temporary pause or consolidation within the larger uptrend.
The key characteristics to look for when identifying a Bull Flag pattern include the presence of a flagpole with a clear upward movement, followed by the flag's consolidation phase, which typically forms higher highs and lower lows. Traders often consider the flag pattern breakout above the upper boundary of the flag as a signal to enter a long (buy) position, expecting the price to continue its upward trend.
When does a Bullish Flag pattern in Chart is formed?
A Bullish Flag pattern typically formed during an uptrend in a financial market. It's a continuation pattern, which means it forms as a temporary consolidation within an existing bullish trend. Here's when you can expect to see a Bullish Flag pattern:
Uptrend: The first requirement for an Up flag pattern is that there must be an established uptrend in the market. This means the price has been consistently rising over a period of time.
Flagpole: The Bullish Flag pattern begins with a sharp, strong upward price movement called the flagpole. This pole flag pattern is often the result of a significant bullish move, such as a surge in buying activity or positive news about the asset.
Consolidation: After the flagpole, there is a period of consolidation, which forms the flag portion of the pattern. This consolidation can take the shape of a rectangle or parallelogram and typically slopes slightly downward. During this phase, the price may move in a sideways or range-bound fashion.
Duration: The duration of the Bullish Flag pattern can vary. It may last for several days or even weeks, depending on the timeframe of the chart you are analysing. The longer the consolidation phase, the more significant the pattern may be.
Breakout: The Bullish Flag pattern breakout is confirmed when the price breaks out above the upper boundary of the flag. This flag pattern breakout is often accompanied by an increase in trading volume and is seen as a signal that the uptrend is likely to continue.
What does a Bullish Flag Chart pattern indicate?
A Bullish Flag pattern chart is considered a bullish continuation pattern, and it indicates the following:
Temporary Consolidation: The formation of a Bullish Flag suggests a period of temporary consolidation or a pause in an ongoing uptrend. This consolidation phase is represented by the flag, which typically forms after a strong upward price movement (flagpole).
Bullish Momentum: The existence of a Bullish Flag pattern reflects that the underlying bullish momentum that led to the initial price surge is still intact. It's a sign that buyers remain active and are merely taking a breather before potentially pushing the price higher.
Potential Upside Breakout: Traders and investors often interpret the Bullish Flag as a signal that the price is likely to break out to the upside once the consolidation phase is complete. This flag and pole pattern breakout is expected to lead to another leg up in the ongoing uptrend.
Trading Opportunity: The flag pattern in trading provides an opportunity for those looking to enter long (buy) positions. Traders typically wait for a confirmation of the bullish move, often seeking a breakout above the upper boundary of the flag, before entering their trades.
Price Target: Some traders use technical analysis techniques to estimate a potential price target for the next leg of the uptrend after the breakout. This is often measured by the length of the flagpole and added to the breakout point.
How to trade when you see a Bullish Flag Chart pattern?
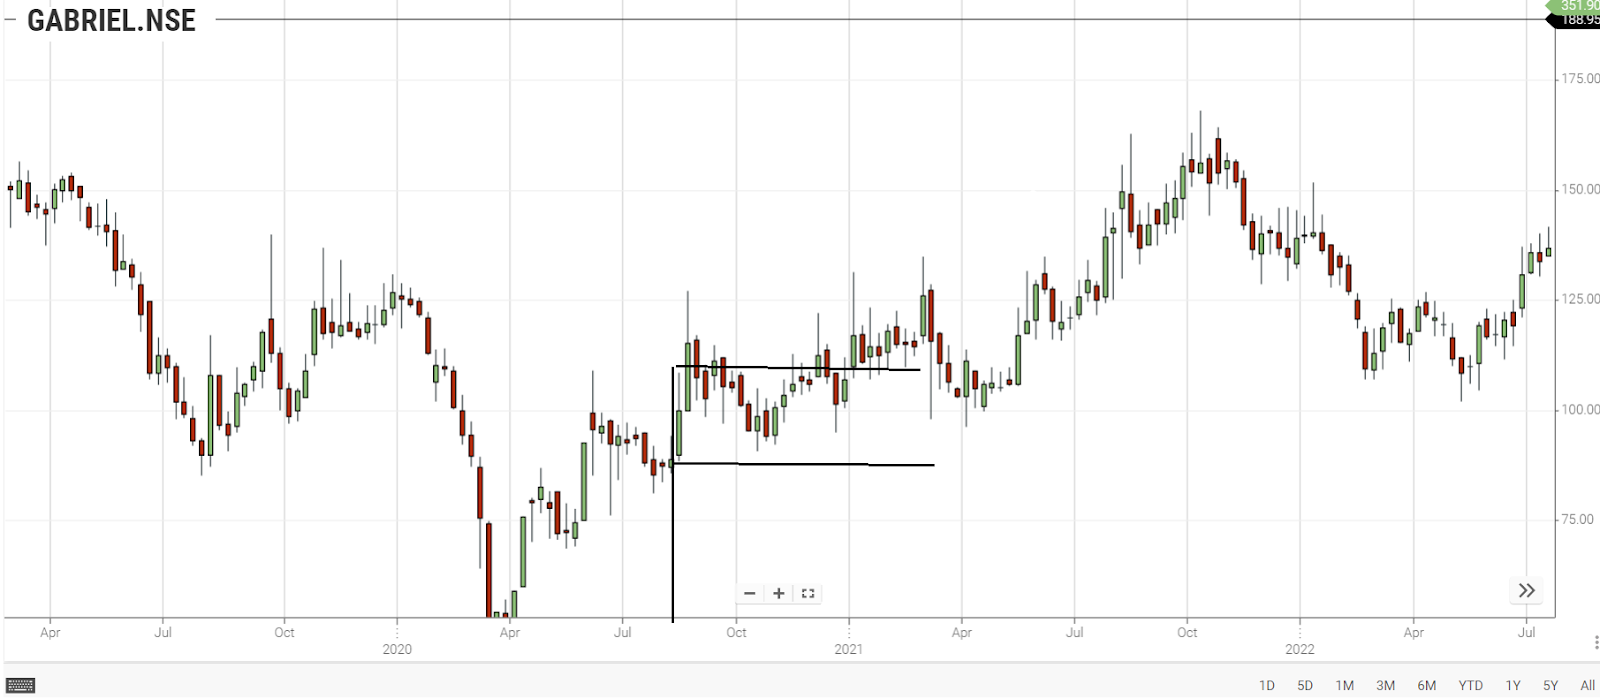
Trading a Bullish Flag Chart pattern involves a structured approach that combines technical analysis, risk management, and trade execution. Let's analyze the bullish chart pattern with the help of a chart.
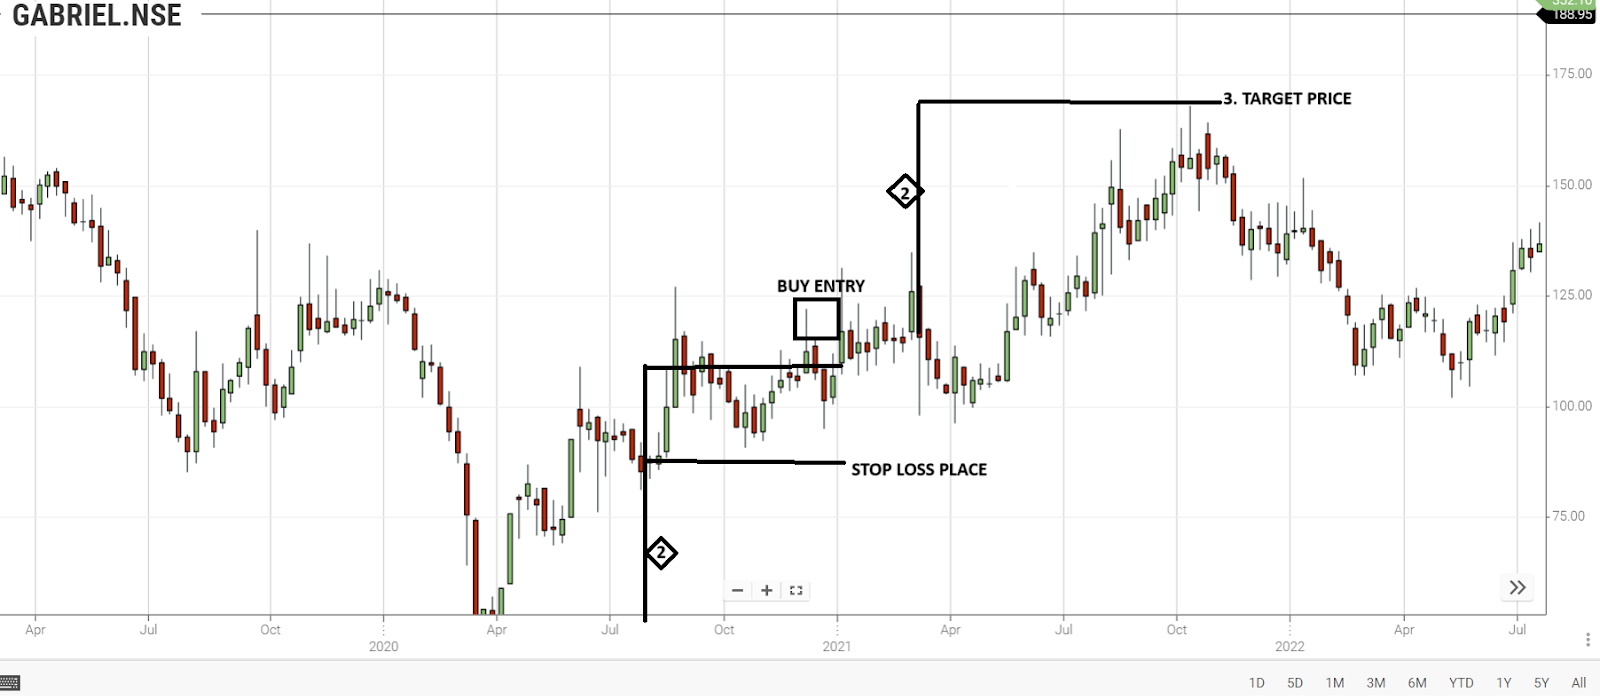
Description of the bullish flag chart pattern
1 - Buy Entry
2 - Stop Loss Order
3 - Target Price
Height of number 2, distance measured by how far the price rose in its initial uptrend (flag pole) is equal to height of number 2 (which is measured above buy entry , as same distance as flag pole )
Here's a step-by-step guide on how to trade when you identify a Bull Flag chart pattern:
Identify the Bullish Flag Pattern: First, ensure that you correctly identify the Bullish Flag pattern on the price chart. Look for a strong upward price move (flagpole) followed by a period of consolidation forming a flag shape.
Confirm the Pattern: Use additional technical analysis tools and indicators to confirm the pattern. Look for signs that the pattern is indeed bullish and that the underlying trend is still intact. Consider using tools like moving averages, volume analysis, and oscillators to support your decision.
Set Entry and Exit Points: Determine your entry point: Traders often wait for a breakout above the upper boundary of the flag to confirm the bullish bias. This breakout is typically where you want to enter a long (buy) position.
Set a stop-loss order: To manage risk, place a stop-loss order below the lower boundary of the flag. This level should represent a price point at which you're willing to exit the trade if the pattern fails.
Set a price target: Use technical analysis techniques to estimate a potential price target for the trade. This bullish flag pattern target can often be done by measuring the height of the flagpole (Calculate how far the price rose in its initial uptrend. The profit target is then placed the same distance above the point where the Flag's lower trend line ends.) and adding it to the breakout point.
Position Sizing and Risk Management: Determine the size of your position based on your risk tolerance and overall bull flag trading strategy. Never risk more than you can afford to lose on a single trade. Consider using proper position sizing techniques, such as the 1-2% rule, to protect your capital.
Monitor the Trade: Once you've entered the trade, keep a close eye on it. Pay attention to price action, volume, and any new developments in the market. Adjust your stop-loss order if the price moves in your Favor to lock in profits or reduce potential losses.
Take Profits or Manage the Trade: When the price reaches your predetermined price target, consider taking partial or full profits. Some traders prefer to trail their stop-loss order to capture additional gains if the price continues to rise. If the trade doesn't go as expected and the price falls below your stop-loss level, exit the trade to limit losses.
Review and Learn: After the trade is closed, review your trading plan and analyse what worked and what didn't. Learn from your experiences to improve your trading skills.
Now Let’s analyze a bullish flag chart pattern where the trader can manage profit by trailing his stop loss order.
Trading Technique
Wait for the price to rise above the flag’s upper trend line.
Enter your trade when the price rises above the Flag upper trend line.
Once resistance breaks, place a buy order after the price retests that trend line.
The broken resistance now becomes the support level.
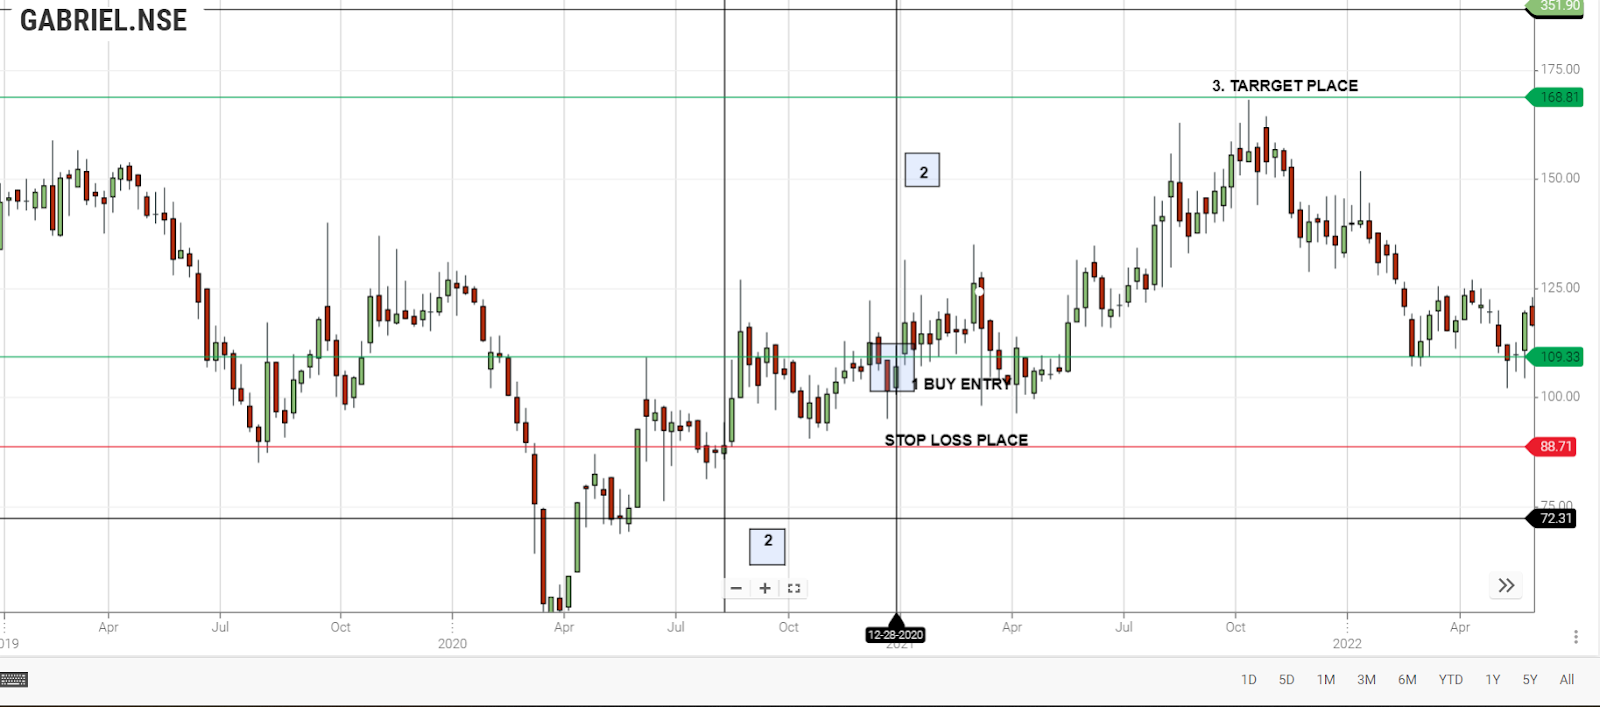
1:Buy entry after the price has bounced off the trend line
2: distance of the Pole of the pattern
Area where the resistance line has turned into support
Place Stop loss underneath the new support area
3: Target Place - Take profit distance (same height as pole number 2)
Note that - Place your stop loss at the level where the Flag's lower trend line reaches its lowest point.
Calculate how far the price rose in its initial uptrend.Place our
profit targets the same distance above the level where the Flag's lower trend line ends.
Summary
The flag pattern emerges when a price, in the midst of a trend, temporarily consolidates in a rectangular range.
This pattern provides an opportunity to enter the market midway through a trend.
Upon breakout, the price resumes its original strong trend, offering a chance to enter at a more favorable price compared to before the flag's formation.
The flag chart pattern is categorized as bullish or bearish.
Trading a bullish flag pattern involves waiting for the price to break out of the flag's upper trend line in the direction of the original uptrend, then placing a long (buy) order.
Set the stop loss at the point where the flag's lower trend line reaches its lowest level.
Calculate the distance the price rose during its initial uptrend.
Place the profit target at the same distance above the point where the flag's lower trend line ends.
Frequently asked questions
Where should I place my stop-loss order?
Place your stop-loss order below the lower boundary of the flag. This level should represent a price point where you're willing to exit the trade if the pattern fails.
How do I set a price target for a Bullish Flag trade?
Use technical analysis techniques to estimate a potential price target. Many traders measure the height of the flagpole and add it to the breakout point to set a target.
Are Bullish Flag patterns always reliable?
No chart pattern is infallible. While Bullish Flag patterns can be reliable, they can fail, so it's crucial to use proper risk management and consider other factors in your trading decisions.
Can I use Bullish Flag patterns in any timeframe?
Yes, Bullish Flag patterns can appear on various timeframes, from intraday charts to daily, weekly, or monthly charts. The pattern's significance may vary depending on the timeframe.
How can I confirm a Bullish Flag pattern?
Confirm the pattern using additional technical analysis tools and indicators. Look for signs of bullishness such as increasing volume as the price approaches the breakout point