Knowledge Center Technical Analysis
Continuation Pattern
What Is A Descending Triangle?
A descending triangle is a chart pattern where a string of lower highs forms a descending slope, meeting a flat or horizontal support line at the bottom. This pattern emerges when the price bounces off the support level at least twice. Its completion typically occurs after the end of a retracement in a downtrend.
Refer to the below Descending Triangle chart pattern, where downward triangles can be traced:
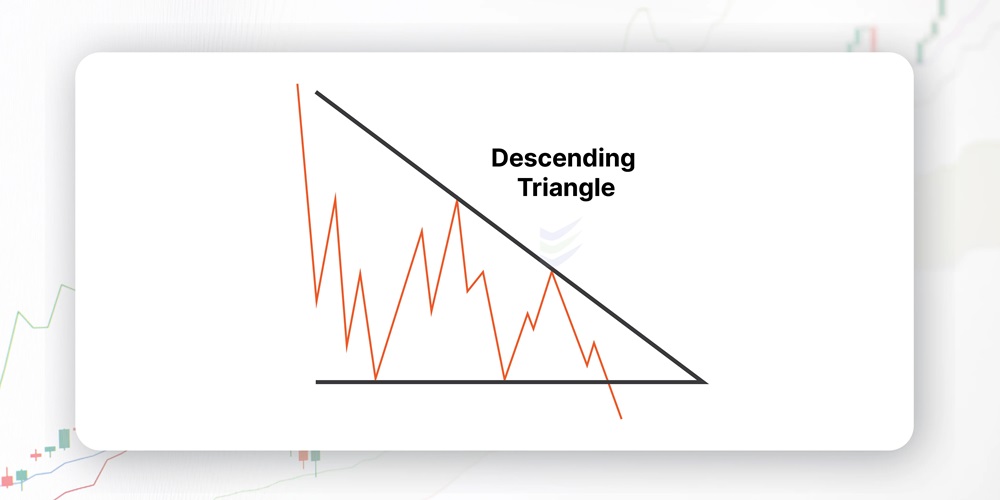
A regular descending triangle is commonly considered a bearish chart pattern or a continuation pattern within a downtrend.
A descending triangle can exhibit bullish tendencies without breaking out in the opposite direction, known as a reversal pattern.
Traders keen on taking a short position often use this pattern. It's identified by drawing trendlines connecting the highs and lows on a chart and serves as a counterpart to the ascending triangle, another trendline-based chart pattern used in technical analysis.
How To Identify A Descending Triangle
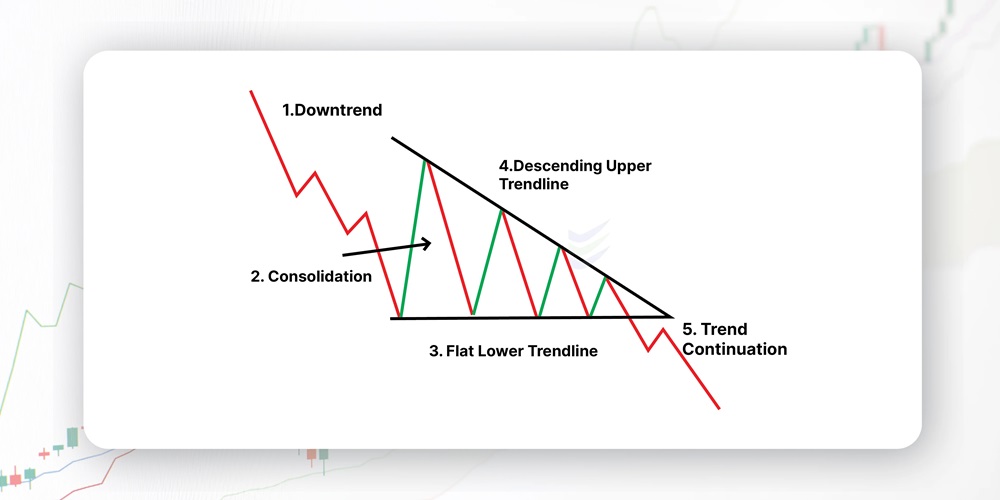
To recognize a Descending Triangle, look for the following Points:
-
The Descending Triangle appears before an existing downtrend.
-
The lower horizontal trendline acts as support as prices approach this level until a breakout occurs.
-
A descending upper trendline can be drawn by connecting the upper points, indicating sellers pushing prices downward.
-
The downtrend continues after the breakout, as evident below the lower trendline.
How To Trade A Descending Triangle
Method 1:
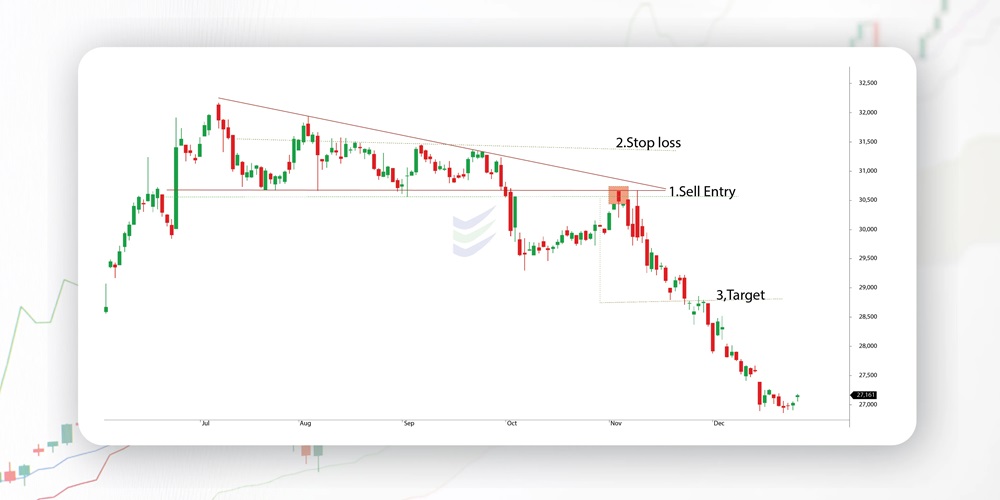
In the chart pattern, you can sell when the price falls below the support level. Wait for a candle to close below support before acting. Put your stop loss above the triangle's downward slope and set your profit target using the triangle's height from the top to the breakout point. Refer to the chart below for entry (orange), stop loss (red), and take profit levels (green)
Method 2:
In this chart pattern, you can also sell when the price breaks below the lower support line, just like in the first example. Wait for a retest of the broken support, which now acts as resistance, and place a sell order.
Set your stop loss above the new resistance area and keep the same profit target as in the first example. Look at the chart below to see how to trade the descending triangle pattern using this method. It illustrates the entry, stop loss, and take profit levels.
In the context of the chart pattern, enter the market when the price breaches the support and retraces to test the former support level, which now serves as resistance (ES1). If the price encounters resistance, even slightly above the initial support level, and begins descending, it signals an entry point.
Place your stop loss (SL2) above the level where the price reversed, now acting as resistance. As for your profit target (TP3), measure the same distance as the back of the triangle downward from the entry point, referencing the chart pattern.
Descending Triangle Pattern Breakout Strategy
The Descending Triangle pattern breakout strategy revolves around anticipating the breakout from this pattern. Here are the key steps:
-
Identify a stock in a downtrend or consolidation phase.
-
Observe lower highs and lower lows forming in the price action.
-
Chart the Descending Triangle pattern.
-
Watch for declining volumes as the pattern forms, usually lower closer to the breakout.
-
Measure the distance from the first high to the low and project it from the breakout area to set your target price.
Descending Triangles with Heikin-Ashi Charts
Integrating Heikin Ashi charts with descending triangles can yield a powerful trading strategy. Heikin Ashi charts simplify trend identification. Here's how to use them:
Watch for the descending triangle pattern to appear.
Look for a bullish trend to emerge, which is frequently indicated by Heikin Ashi candlesticks turning bullish prior to the breakout.
Apply the same projection strategy based on the pattern's measurements.
Key Takeaways
In summary, the descending triangle pattern is a valuable asset in a trader's toolbox.. Its versatility, when combined with various trading strategies, can lead to profitable outcomes. Whether you're a seasoned investor or a novice trader, mastering this pattern can unlock potential profits and enhance your trading skills. However, always exercise caution and conduct thorough analysis before making trading decisions. Happy trading!
Frequently Asked Questions
What is a descending Triangle?
A descending triangle is a chart pattern characterized by a string of lower highs meeting a flat support line at the bottom. It typically appears in a downtrend and signals a potential bearish continuation, i.e. descending triangle continuation pattern.
What does a descending triangle tell you?
This pattern suggests that the demand for an asset, derivative, or commodity is weakening. A breakdown below the support level indicates a potential continuation of the downtrend.
How do you identify a descending triangle?
Look for an existing downtrend before the descending triangle forms. Identify a flat support line and a descending upper trendline connecting the highs.
How do you trade a descending triangle?
Traders anticipate a downside breakout from the pattern. They enter a short position after a strong break below support, setting a stop at the recent swing high and a profit target based on the pattern's measurements.
What's the difference between descending triangles and ascending triangles?
Descending triangles form in downtrends, signaling a potential bearish continuation. Ascending triangles appear in uptrends, suggesting bullish continuation.