Knowledge Center Technical Analysis
Continuation Pattern
Bearish Pennant Chart Pattern
In this guide, we will delve into the following subjects:
-
Understanding the concept of a pennant.
-
Exploring the characteristics of a bearish pennant.
-
Identifying the development stages of a bearish pennant.
-
Techniques for recognizing and capitalizing on the second significant price drop.
1.Understanding the concept of a pennant.
A pennant emerges as a compact, symmetrical triangle or flag-shaped short-term pattern, gradually widening and converging like a cone as it matures, and is typically formed during periods of significant stock movement.
Two variations of the pennant pattern include:
-
Bearish Pennant Pattern
-
Bullish Pennant Pattern
2. Exploring the characteristics of a bearish pennant.
-
Bearish pennant pattern, suggest the potential continuation of the existing downtrend in price.
-
This pattern is characterized by a temporary pause in the price movement, strategically positioned in the midst of a pronounced downtrend.
-
It provides traders with an opportunity for short trading, aiming to capitalize on the second significant fall in price.
-
The bearish pennant signifies a continuous pattern, indicating that the ongoing downtrend may persist.
-
Traders can leverage this pattern to anticipate and potentially profit from the resumption of the downtrend.
3. Identifying the development stages of a bearish pennant.
-
A bearish pennant pattern takes shape following a sharp decline in price, manifesting as a triangular flag during a period of sideways movement.
-
This pattern unfolds gradually, marked by the formation of lower highs and higher lows.
-
The downtrend persists as the bearish pennant undergoes another comparable drop in price.
Identification of A Bearish Pennant
Refer to the chart provided below for an illustration of the characteristics of a bearish pennant:
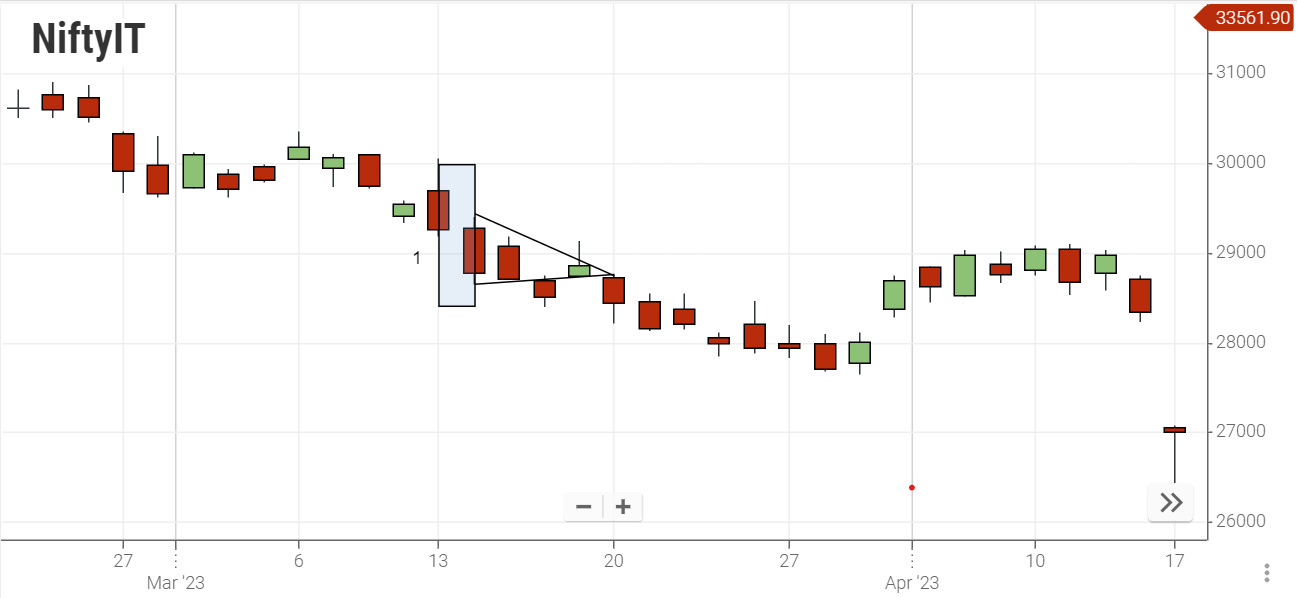
In chart, 1.Pole of the pattern
As illustrated earlier, a pronounced decline in price, referred to as the pennant's 'pole,' precedes the formation of the flag-like pennant.
The pole functions as an indicator, signaling the onset or persistence of a downtrend, and its magnitude becomes significant when determining the optimal placement for the profit target in a sell trade.
The triangular pennant, although typically diminutive compared to the overall downtrend, poses a challenge for identification due to its subtle nature.
4. Techniques for recognizing and capitalizing on the second significant price drop.
Technique 1
The first method enables individuals to initiate a trade as soon as the price breaks out of the triangle pattern.
Entering the trade- To get into the trade, start your short trade right after a candlestick closes below the lower trend line of the pennant.
Place stop loss-Set your stop loss by positioning it on the opposite side of the pennant, just above its upper trend line.
Place profit target-Calculate the initial drop in price, which is the pole of the pennant, before the market consolidates.Next, position your profit target at the same distance below the pennant's breakout point.For instance, if the initial price drop measured 50 pips, set your profit target 50 pips below your trade entry.
Review the illustrated example in the chart provided:
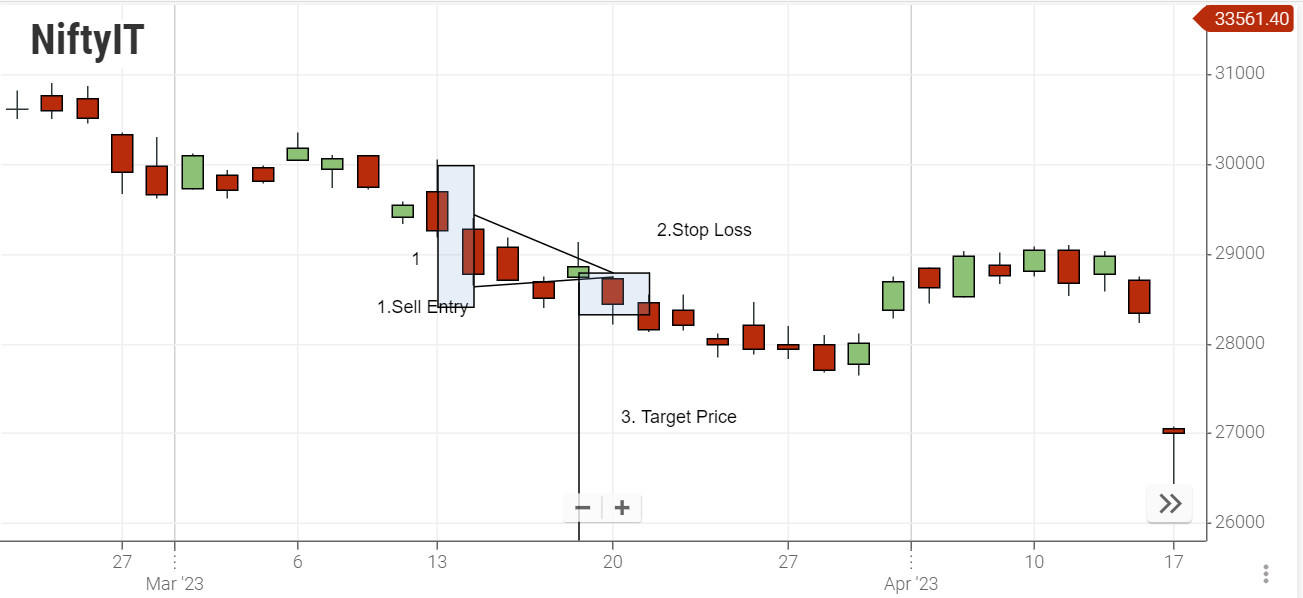
1-Pole of the pattern-Sell order (short entry)
2- Stop loss -Area where price has broken the lower support of the pennant
3-Take profit-distance from the entry point to the take profit level, which is equivalent to the height of pole 1.
Technique 2
With the second trading method, an individual can wait until the price retraces to test the lower trend line as resistance before entering.
Entering Trade-Similar to method 1, one should wait for the price to drop below the lower trend line of the pennant. After this support has been breached, initiate a sell order when the price retests that trend line. The previously broken support will now act as a resistance level.
Place stop loss- Position your stop loss just beyond the newly established resistance area.
Place Profit target-Similar to method 1, calculate the size of the pennant's pole. Subsequently, position your profit target at an equivalent distance below the pennant's breakout point, which is where you entered the trade.
Refer to the chart below for an illustrative example of this strategy:
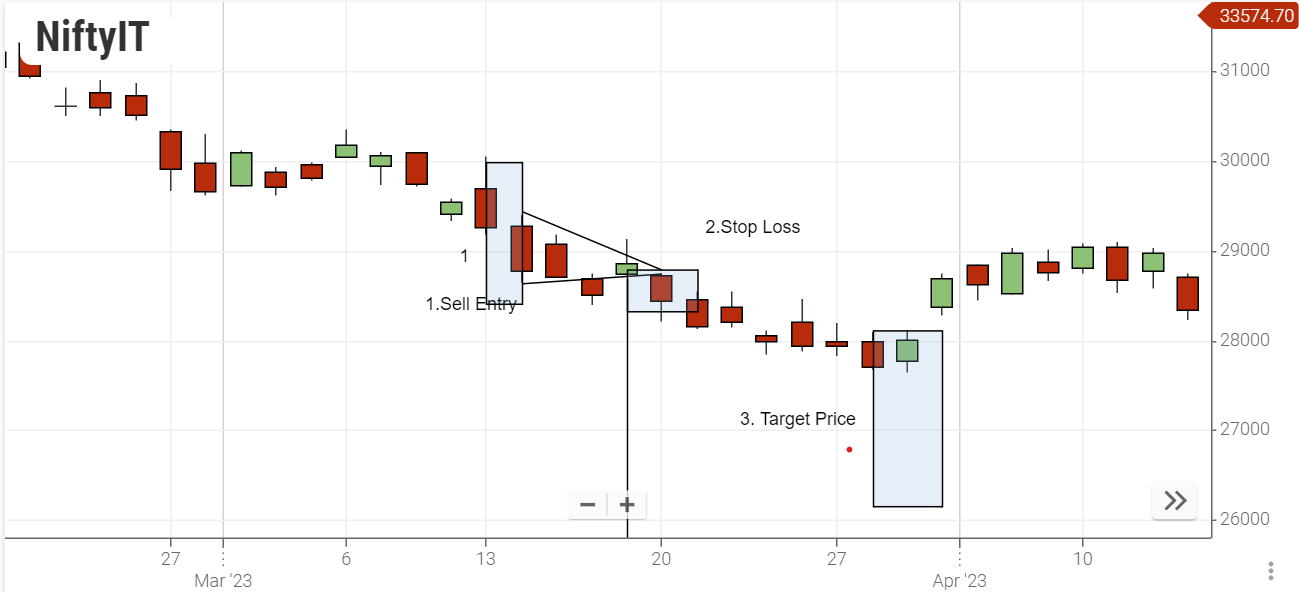
1 Sell order (short entry)-Pole of the pattern
2 Stop loss- This is the region where the price encounters resistance at the former support line.
3 Take profit- distance from the entry point to Take Profit 3 (TP3),same height as pole number 1.
Key Takeaways
-
The bearish pennant is identified as a continuation pattern within a downtrend, indicating potential selling opportunities.
-
Entry (sell order) is executed after the support level is broken, either through a breakout or a retest of the lower trend line.
-
To manage risk, position the stop loss above the opposite trend line.
-
Establish the profit target at a distance below the entry point equal to the height of the pole (initial price drop).
Frequently Asked Questions
-
What is a pennant?
A pennant is a compact, symmetrical triangle or flag-shaped short-term pattern that widens like a cone as it matures, typically forming during significant stock movements.
-
What are the variations of the pennant pattern?
The two variations are the Bearish Pennant and Bullish Pennant.
-
How is a bearish pennant characterized?
The bearish pennant suggests a continuation of the existing downtrend, marked by a temporary pause in the price movement amid a pronounced downtrend. It provides an opportunity for short trading to capitalize on the second significant fall in price.
-
How does a bearish pennant chart pattern develop?
It forms after a sharp decline in price, resembling a triangular flag during sideways movement. The pattern gradually makes lower highs and higher lows, with the downtrend continuing after another comparable drop in price.
-
How can I recognize a bearish pennant on a chart?
Refer to the chart provided for an illustration, including the pole of the pattern, which signifies a sharp decline in price before the pennant's formation.
-
What are the techniques for trading a bearish pennant?
Technique 1: Initiate a trade as the price breaks out of the pennant. Enter short after a candlestick closes below the lower trend line, set a stop loss above the pennant, and place the profit target equivalent to the pole's height below the entry.
Technique 2: Wait for the price to retest the lower trend line as resistance before entering. Similar to Technique 1, set a stop loss above the resistance area and place the profit target below the entry point, considering the pole's height.