Knowledge Center Technical Analysis
Indicators
Relative Strength Index
What is RSI Indicator?
The Relative Strength Index (RSI) is a technical indicator used in financial analysis, particularly in the field of trading and investing. It was developed by J. Welles Wilder and first introduced in his 1978 book, "New Concepts in Technical Trading Systems."
RSI is used to assess the strength and speed of a security’s price changes in a financial market and helps traders and investors identify potential overbought or oversold conditions.
Calculation of RSI
The RSI is calculated using the following formula:
RSI = 100 - (100 / (1 + RS))
Where:
- RS (Relative Strength) is the ratio of average gains to average losses over a specified period. It's typically calculated as follows:
- Average Gain = Sum of gains over the specified period / N
- Average Loss = Sum of losses over the specified period / N
- RS = Average Gain / Average Loss
- N is the number of periods used for the RSI calculation. The default period is 14, but traders can adjust it based on their preferences and the specific asset they are analyzing.
Interpretation of RSI
The RSI is a bounded oscillator that typically ranges from 0 to 100. Traders generally use the RSI to assess two main conditions:
Overbought (Bearish Signal):
When the RSI value exceeds 70, it is considered overbought. An overbought condition suggests that the asset may have experienced a significant price increase, and there is a higher likelihood of a price correction or a pullback in the near future. Traders may consider selling or taking profits when the RSI is overbought.
Oversold (Bullish Signal):
When the RSI value falls below 30, it is considered oversold. An oversold condition suggests that the asset may have experienced a significant price decrease, and there is a higher likelihood of a price bounce or a potential rally. Traders may consider buying when the RSI is oversold.
Traders often use additional signals, such as divergence with price movements or chart patterns, to confirm their trading decisions.
Understanding RSI
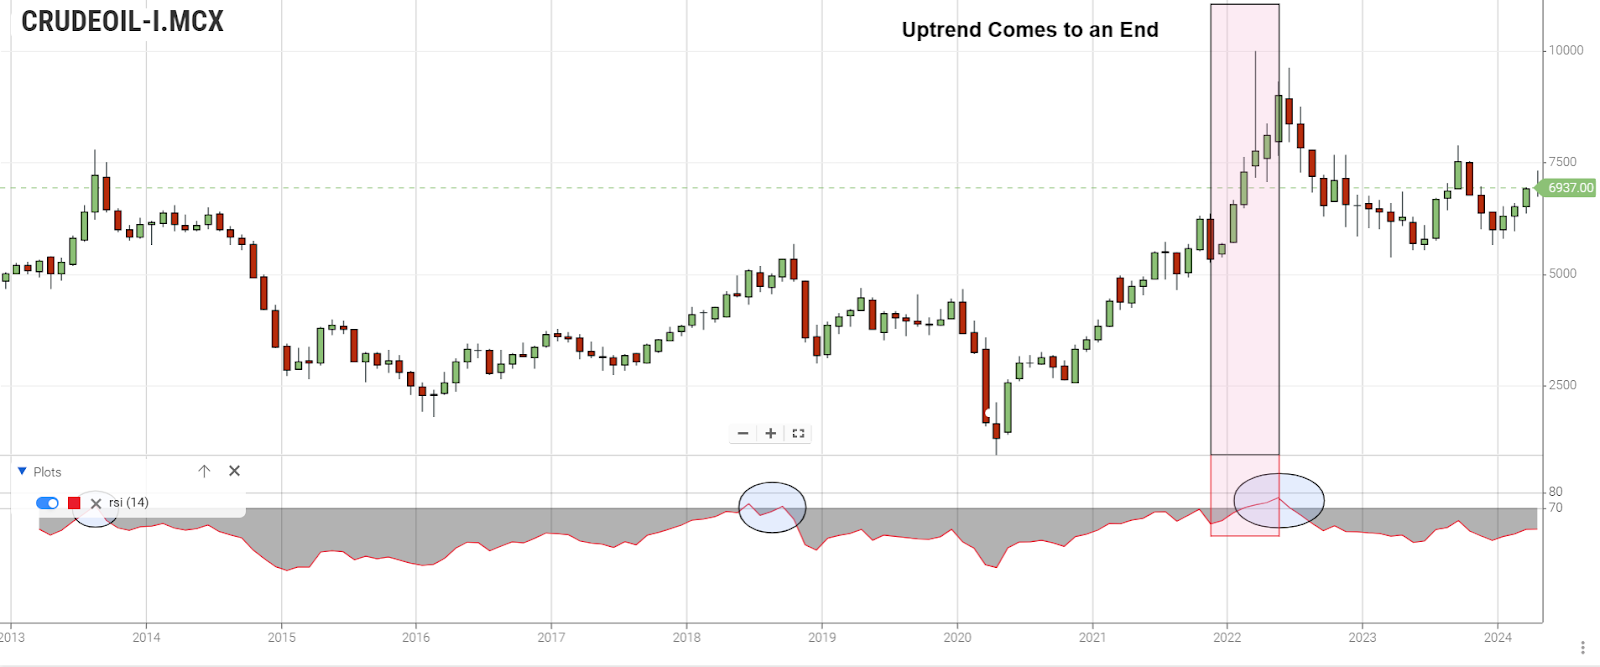
Consider an example of crude oil day trading indicators, when crude oil is overbought or oversold, it is shown by the (RSI) Relative strength index, an oscillating indicator.
Comparing the price action over time (usually 14 periods) enables the indicator to show if the price has become significantly high or low.
This can determine when a current trend may be coming to an end or when a new trend may be forming.
The RSI helps time the entries and exits to maximize profits before a price rises or falls.
The Illustration Chart Below Depicts the RSI Indicator

-
We can observe that the RSI indicator appears below the chart. It is made up of a single line that moves between two levels – 0 and 100. In the middle of the chart is the 50 level.
-
Using The 50 Level to Show Buying and Selling Power
-
A movement above 50 shows that more traders are buying crude oil than selling it and are driving the price up.
-
If the crude oil RSI moves below 50, more traders are selling than buying and are driving the price down.
The Illustration Chart Depicts the RSI Level Above 50, Indicating There Are More Buyers Than Sellers:
-
RSI over the 50 levels, indicating more buyers in the market.
-
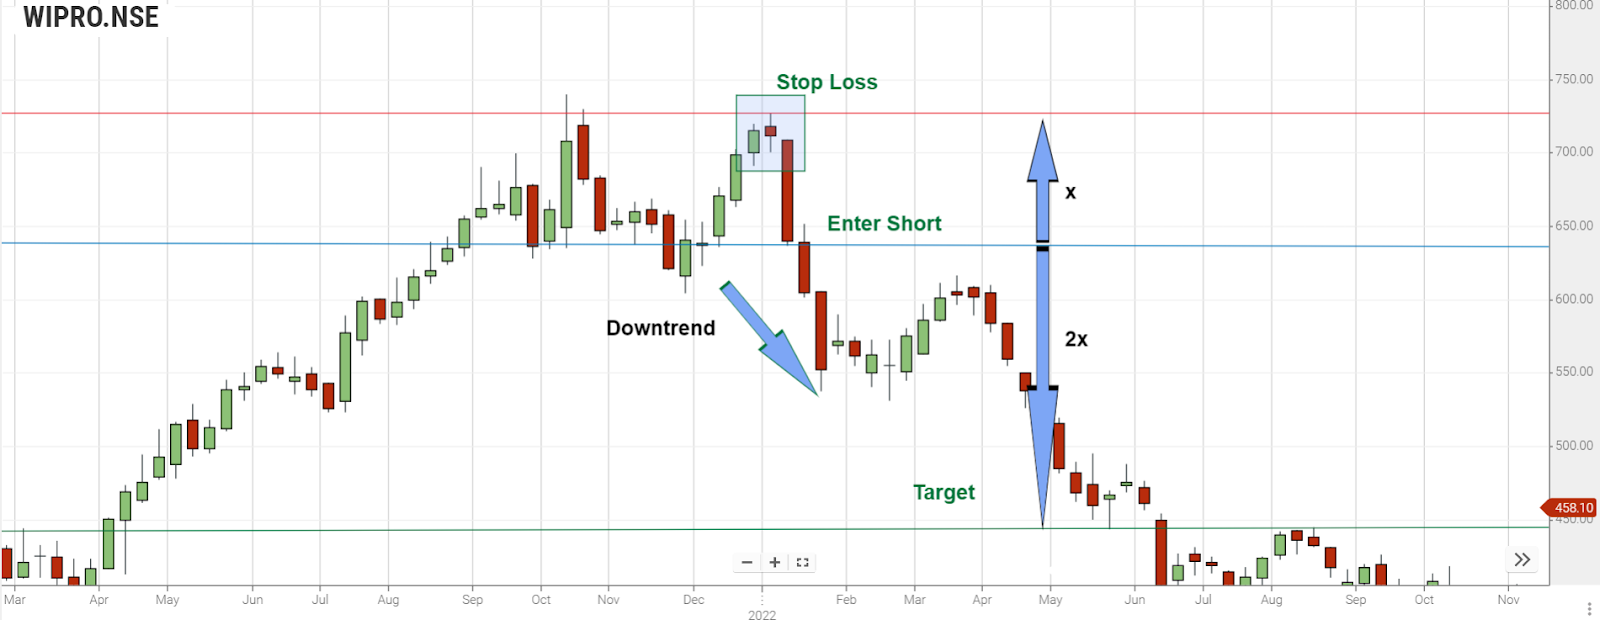
When the RSI goes below 50%, a short sell is entered.
-
When the line is below 30, a downtrend is likely to end.
-
Therefore, when RSI reaches 30 levels. Then there will be Potential ample opportunities advisable.
-
Place a target profit at the RSI = 30, and exit the position by a buy.
-
Similarly, when RSI goes above 50%, a long buy entry is made.
-
When the line is above 70 -80 Level, there will be an indication of overbought condition
-
Therefore, place a target profit at the RSI = 70, and exit the position by sell.
Using The 30 And 70 Level to See Overbought and Oversold Conditions
Consider the above chart,
RSI begins to approach the 30 level - likely; the downtrend is ending.
RSI begins to approach the 70 level - likely that the uptrend is ending.
This is the point marked where the crude oil is overbought or oversold.
Sometimes the overbought condition will be extended above the level like 75/25 or even 80/20 levels to mark overbought and oversold situations.
We can also use the RSI to exit your position when it indicates the end of a trend.
RSI Trading Strategy
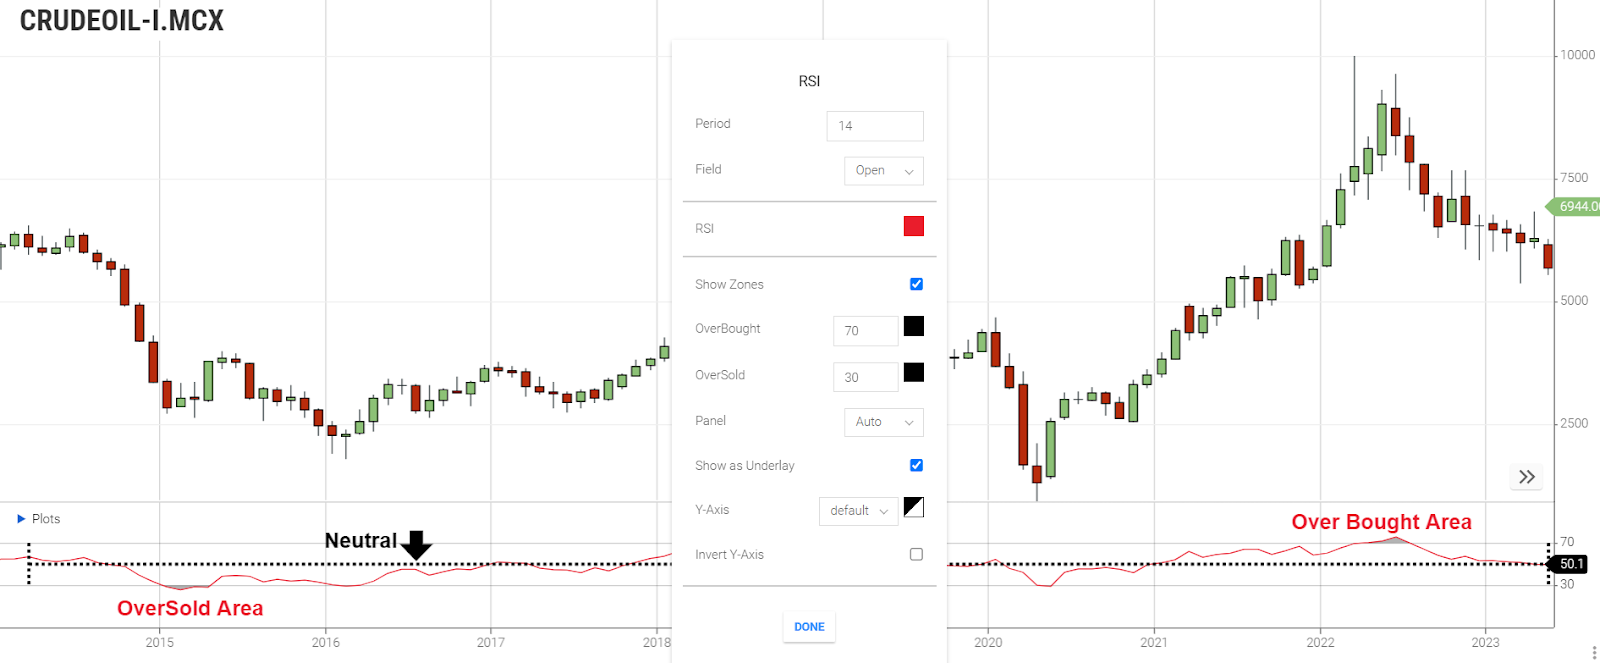
Changing the RSI Indicator settings
The above crude oil RSI chart shows that with the setting at half the standard rate, the indicator line switches between overbought and oversold more often.
The overbought and oversold conditions can be found earlier by reducing the settings. But at the same time, we are prone to receive more false signals.
Most traders do not change the standard RSI setting from 14, as this is the level that gives them the most valuable and reliable information.
Strengths and Limitations
-
RSI is a popular and widely used indicator because it can help traders identify potential reversal points in the market.
-
It provides a straightforward and easy-to-understand signal, making it accessible to both beginner and experienced traders.
-
While RSI can be a valuable tool, it is not foolproof, and traders should use it in conjunction with other technical and fundamental analysis tools for a more comprehensive view of the market.
It's essential to remember that RSI is a lagging indicator and should not be used in isolation. It should be part of a broader trading RSI strategy, and risk management principles should always be applied when making trading decisions.
Frequently Asked Questions
What Is RSI Indicator Meaning?
The RSI (Relative Strength Index) is a technical indicator used in finance to measure the speed and change of price movements. It oscillates between 0 and 100, helping traders identify overbought (above 70) or oversold (below 30) conditions, which can indicate potential reversals in the market. It's a popular tool for assessing the momentum of price changes and making trading decisions.
How To Use RSI Indicator?
To use the RSI indicator effectively:
1. Identify overbought (above 70) and oversold (below 30) levels.
2. Consider selling when RSI is overbought and buying when it's oversold.
3. Use RSI in conjunction with other analysis methods for more informed trading decisions and risk management.
What Is Meaning of RSI In Technical Analysis?
In technical analysis, RSI stands for Relative Strength Index. It's a momentum oscillator used to evaluate the strength and speed of price movements. Traders use it to identify potential overbought or oversold conditions and make informed trading decisions.
How To Read RSI Indicator?
Reading the RSI indicator:
1. RSI above 70 indicates potential overbought conditions, suggesting a possible price correction.
2. RSI below 30 suggests potential oversold conditions, indicating a potential price rebound.
3. Use RSI in conjunction with other analysis tools and consider divergence for more accurate trading decisions.
How Can I Use Nifty RSI Chart?
To use the Nifty RSI chart:
1. Access a financial charting platform or trading software.
2. Enter the Nifty index symbol, add the RSI indicator, and set your parameters.
3. Interpret the Nifty 50 RSI chart for overbought and oversold conditions, using it in conjunction with other analysis methods for trading decisions.