Knowledge Center Technical Analysis
Indicators
SUPER TREND: Technical Analysis Tool For Stock Trading
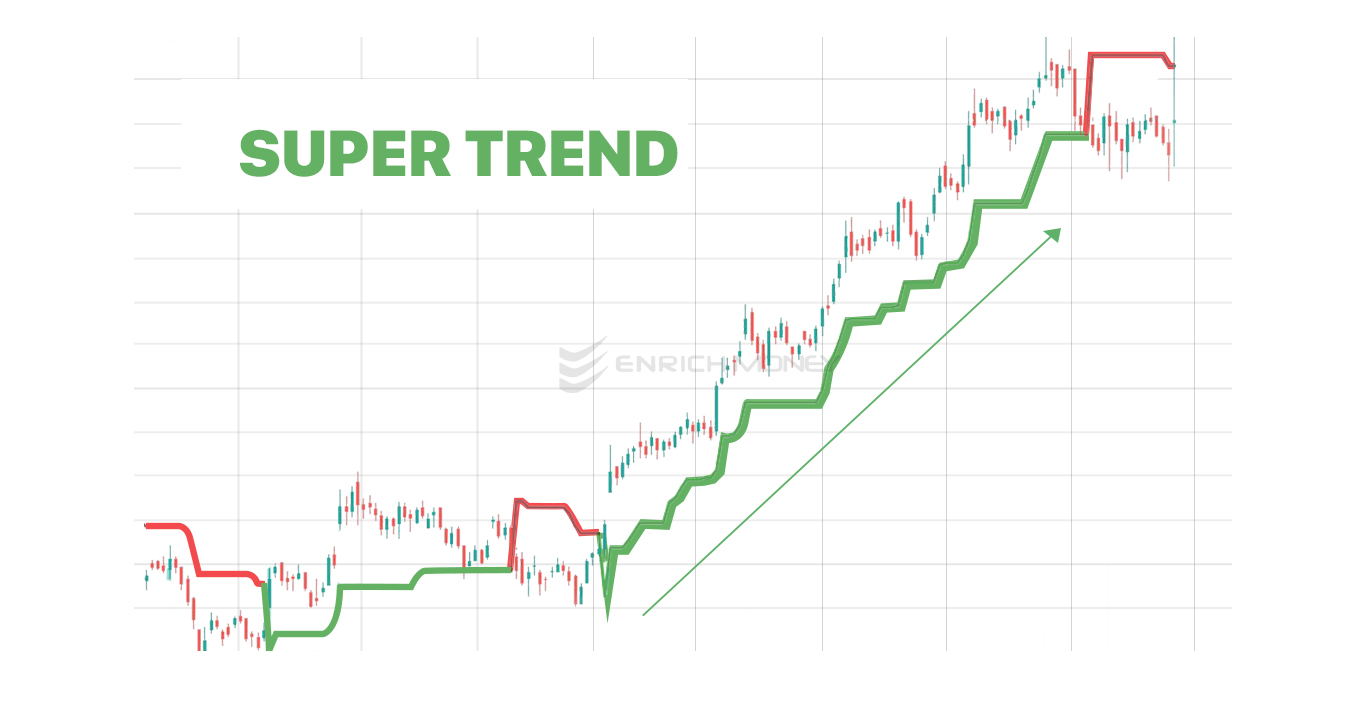
The Super Trend indicator is a popular technical analysis tool used in the world of trading and investing. It's primarily employed to identify trends in the price movement of a financial asset.
Super trend indicator is like a colorful line drawn on the chart that shows the price of a stock or an index.It changes color, either to green or red, based on changes in the price of the underlying.When the line is green, it's like a green light, suggesting that the price is likely going up. When the line turns red, it's like a red light, indicating that the price is probably going down.
It's important to note that the Supertrend doesn't forecast the direction of the trend. Instead, once a trend direction is established, it functions as a guide by suggesting when to enter a position and advising that you maintain that position as long as the trend remains intact.
WHAT TO LOOK INSIDE SUPER TREND?
Supertrend relies on Average True Range (ATR) values for its calculations. Average True Range (ATR) is a technical indicator to measure market volatility. There is a formula for the calculation of ATR inorder to understand the working of the indicator. But it is not necessary for us to learn the complex formulas as the super trend indicator is readily available in stock chart itself. Only thing we need to do is to select the values for ‘Periods’ and ‘Multiplier’. Periods and Multiplier are two in-built parameters of Super trend indicator. Periods refers to the ATR number of days. There is usually a default value for this, but one can change the input as they deem suitable. And Multiplier refers to the number by which ATR will get multiplied
WHERE CAN A SUPER TREND INDICATOR BE USED?
The Supertrend indicator is versatile, suitable for equities, futures, and forex trading across various timeframes like daily, weekly, and hourly charts. However, its effectiveness tends to decrease during sideways market conditions.
Like most indicators, Supertrend performs optimally when combined with other indicators like MACD, Parabolic SAR, or RSI.
Additionally, the 'Supertrend' serves as robust support or resistance levels while also offering a dynamic trailing stop-loss feature for ongoing trades.
NOTEWORTHY FUNCTIONS
FOR LONG POSITION
Once a trader identifies a long position, it's advisable to maintain that position until the price closes below the green line. This green line essentially functions as a trailing stop loss for the long position.
FOR SHORT POSITION
A sell signal occurs when the stock or index price drops below the indicator value, causing the indicator to turn red. This moment is often marked by a crossover where the price falls below the indicator value.
This sell signal can be used to either initiate a new short position or exit an existing long one. However, relying solely on the sell signal to exit a long position can sometimes result in losses, so traders should exercise their judgment.
Once the short position is established, it's advisable to maintain it until the price closes below the green line. Essentially, the red line serves as a dynamic trailing stop-loss for the short position.
In practical terms, the Supertrend indicator proves more effective for intraday trading compared to a standard Moving Average system.
HOW TO USE SUPERTREND INDICATOR IN ENRICH MONEY ORCA?
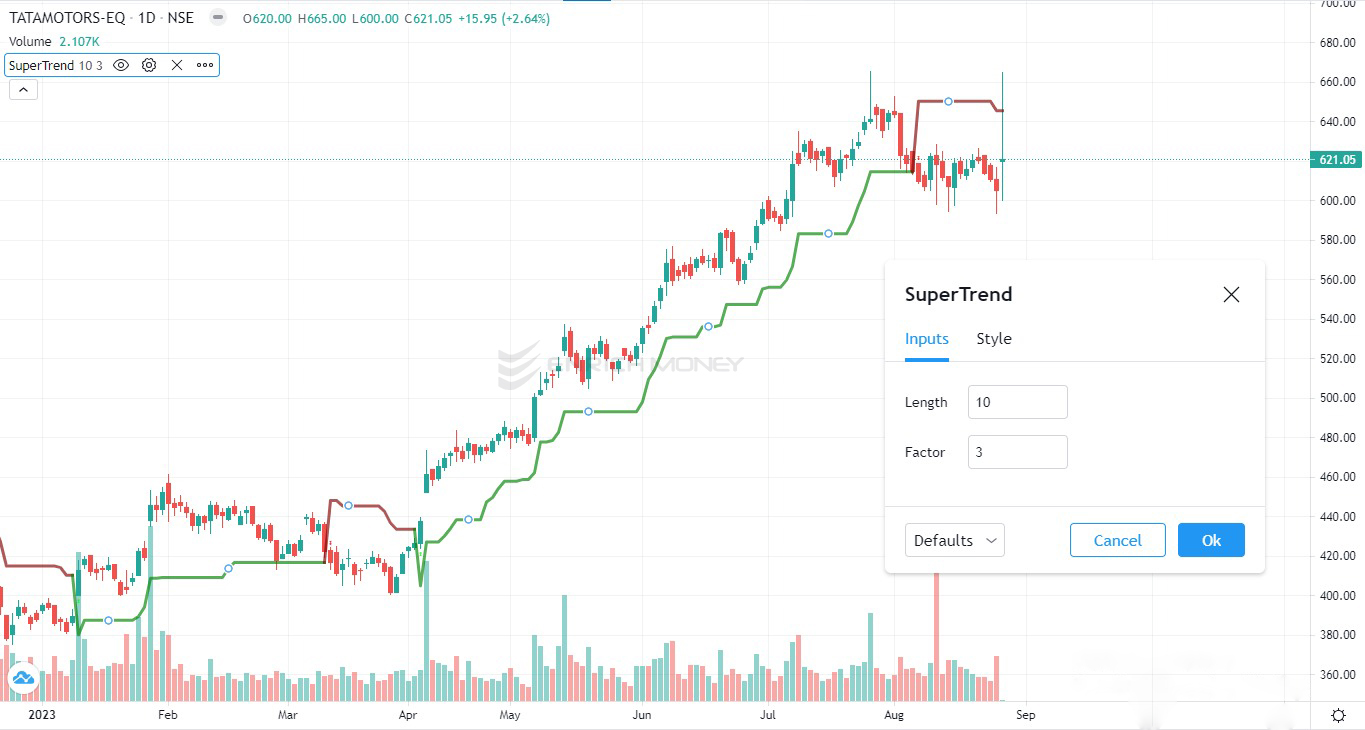
You can select the Super trend indicator from the “Indicators” ,and while clicking on the settings you will be asked to provide values for the two parameters i.e. “Length” and “Factor”.
Length is the “Periods” and Factor is the “Multiplier”.
Default value for Length or Periods is 10 and default value for Factor or Multiplier is 3.
As we mentioned above, Period is the ATR number of days.So Period =10 means ,it will calculate the ATR value for the last 10 days.
Multiplier=3 means ,whatever is the ATR value it will get multiplied by 3.
Note that when the multiplier value is set too high, it results in fewer signals being generated. Conversely, if the multiplier value is set too low, it leads to a higher frequency of signals, which in turn increases the likelihood of false trading signals being generated.
Frequently Asked Questions (FAQ)
1. WHAT IS SUPER TREND ?
Super trend indicator is like a colorful line drawn on the chart that shows the price of a stock or an index.
2. DOES SUPER TREND FORECAST THE DIRECTION OF THE TREND?
Supertrend doesn't predict the trend's direction but helps you enter and stay in a trend once it's identified.
3. WHICH ARE THE PARAMETERS OF SUPER TREND?
Two important parameters of the super trend are Periods and Multiplier.
4. WHAT YOU MEAN BY ATR?
ATR or Average True Range is a technical indicator to measure market volatility.
5. IN ENRICH MONEY ORCA ,WHICH ARE THE IMPORTANT PARAMETERS OF SUPER TREND?
In Enrich Money ORCA, two parameters used in super trend are Length and Factor.