Knowledge Center Technical Analysis
Indicators
How To Trade MACD In ORCA
Overview
Developed in the late 1970s by Gerald Appel, the MACD (Moving Average Convergence/Divergence) is highly esteemed among traders as a pivotal indicator. Representing the relationship between two exponential moving averages (EMAs) of a security's price, the MACD is a trusted trend-following momentum indicator. Despite its inception in the 1970s, momentum traders continue to consider MACD as one of the most reliable indicators, with its name denoting Moving Average Convergence and Divergence.
What is a MACD Indicator?
MACD full form is Moving Average Convergence Divergence, derives its name from the convergence and divergence of two moving averages, which constitute the essence of the indicator. Convergence happens when the two moving averages move in opposite directions, while divergence occurs when they move apart. Typically, a MACD is constructed using a 12-day EMA and a 26-day EMA, both originating from closing prices. The calculation involves subtracting the 26 EMA from the 12-day EMA to determine the convergence and divergence (CD) value, often represented as the "MACD Line" on a linear graph.
While the Moving Average Convergence/Divergence (MACD) is commonly employed as a trend indicator, it can also serve as an oscillator. It aids in assessing the direction and strength of price movements, offering insights into potential trend changes. This enables strategic entry into a trend at its onset and timely exit before its conclusion.
How To Understand MACD Indicator?
MACD, categorized as a momentum indicator within the oscillator family of technical indicators, aids in determining trend direction and predicting price movements based on the relationship between two moving averages. It calculates the rate of price change, reflecting trend speed or momentum, offering valuable insights for traders assessing the strength or weakness of a trend. Presented on a price chart as an oscillator with two moving averages, MACD lacks strict boundaries typical of common oscillators and incorporates a histogram overlay. To comprehend MACD, understanding moving averages (MA) is essential, where simple moving averages (SMAs) and exponential moving averages (EMAs) are the primary types. MACD relies on EMAs, emphasizing recent data for effective buy or sell decisions. Despite its simplicity, it is cautioned not to rely solely on MACD signals for trading decisions, and incorporating other indicators like Stochastic or RSI is advisable.
How To Read MACD Indicator
Understanding the MACD indicator on a graph is essential before delving into its application, and it comprises three key elements:
-
MACD Line (Fastest Moving Average): The MACD indicator is computed by subtracting a short-term, 12-day EMA from a long-term, 26-day EMA, typically depicted in blue.
MACD Line= (12-day EMA) - (26-day EMA)
-
Signal Line (Slowest Moving Average): Represented by a 9-day line, commonly displayed in red to signify price activity turns.
Signal Line=9-day EMA of MACD Line
-
MACD Histogram: Swinging above and below a zero line, it discerns bullish and bearish momentum readings. The histogram is the difference between the MACD Line and the Signal Line.
To interpret signals correctly:
-
Positive MACD with an increasing histogram suggests building momentum, indicating a potential rise in price.
-
Decreasing MACD and histogram values indicate a likely decline in price, signalling a selling opportunity.
-
Thus, MACD Histogram suggests buy and sell signal.
The Illustration Chart Below Depicts How the Indicator Appears on A Chart:
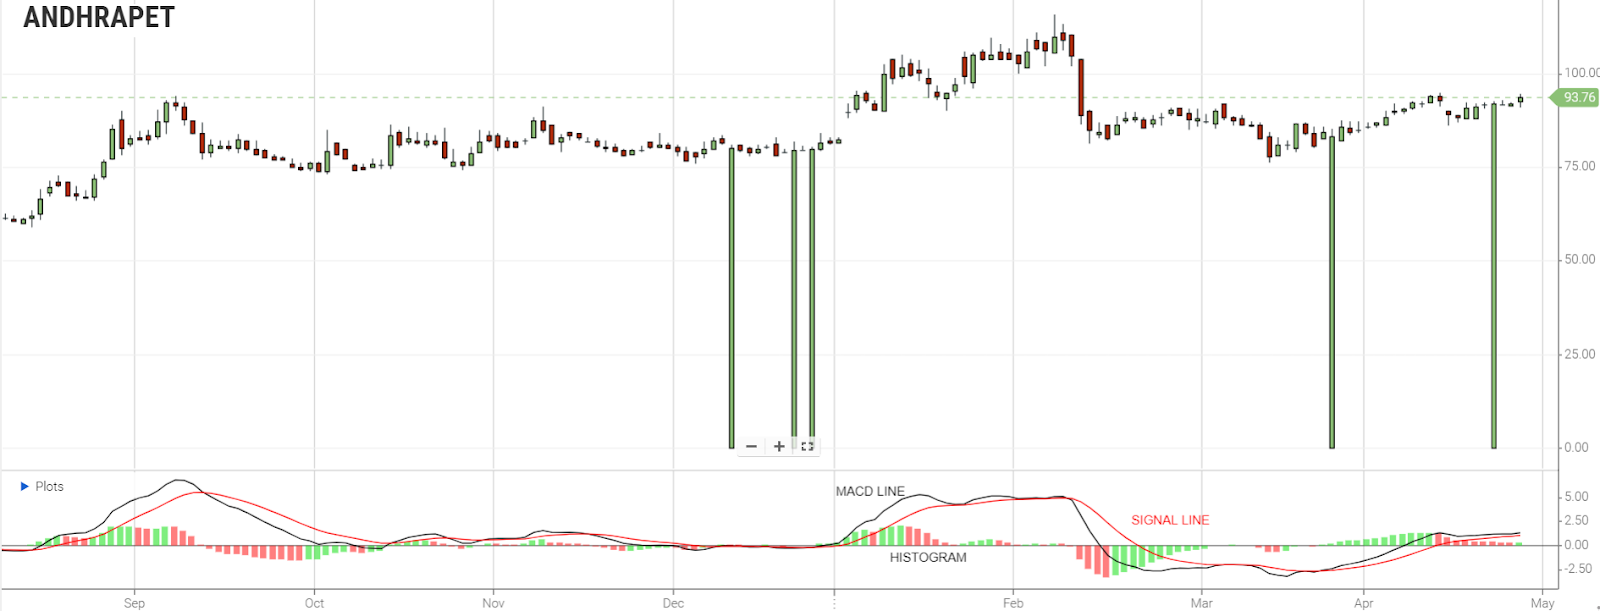
The moving average lines MACD line is a moving average line that tracks the underlying asset’s price.
The signal line is a moving average of the MACD line and interacts with it to produce trading signals.
The red signal line is a moving average of the MACD line itself. It smooths out the movement of the MACD line and interacts with it to produce trading signals.
The histogram displays the difference between these two lines.
The momentum of a price move is determined by the bars that appear below or above a horizontal zero line.
This helps us understand when a trend is gaining strength and vice versa.
How To Interpret MACD Indicator
Exponential Moving Averages (EMAs): Recent changes in a stock's price are highlighted by exponential moving averages. The MACD series assesses trend changes by comparing EMAs of different lengths. Claimed to reveal subtle shifts in a stock's trend, the difference between the MACD series and its average can be indicative, especially when correlated with indicators like RSI power.
MACD Line, Signal Line, and Zero Axis Crossings: Traders attribute significance to events like the MACD line crossing the signal line or the zero axis. Discrepancies between the MACD line or difference line and stock prices, particularly higher highs or lower lows, are noted. Signal-line crossovers, zero crossovers, and their interpretations for bullish or bearish crossovers are crucial indications of trend acceleration.
Divergence and Trend Changes: Divergence, whether positive or negative, offers insights into potential trend changes. Positive divergence occurs when the price makes a new low, but the MACD does not confirm, and vice versa for negative divergence. This can happen on the MACD line and/or the MACD Histogram.
Timing and Parameter Variation: The context in which the MACD is applied is crucial for its effectiveness. Analysts might use the MACD on a weekly scale before a daily one to align with the intermediate trend. Varying MACD parameters, such as the popular (5,35,5) short-term set-up, helps track trends of different durations.
False Signals and Filtering Strategies: False signals are a concern, and strategies involve applying filters to signal line crossovers. For instance, a price filter may involve buying only if the MACD crossover above the signal line (i.e. MACD line breaks above the signal line) and stays above it for three days. Filtering strategies reduce false signals but may increase missed profit opportunities.
Confirmation and Analyst Approaches: Analysts employ various approaches to filter out false signals and confirm true ones. A MACD crossover of the signal line indicates a change in acceleration direction, while the MACD line crossing zero suggests a shift in average velocity.
Orca Trading Platform with The MACD Indicator:
Selling signal: It is a sell signal when the MACD has crossed below the signal line. The signal is more potent if the histogram bars are also below the zero line.
If the MACD crosses below the signal line, but the histogram has not confirmed it by producing bars below the zero line, this is a sell signal but not strong.
Buying Signal: When the MACD crosses below the signal line, it is a buy signal. If the histogram is above the zero line, the signal is stronger.
If the MACD crosses above the signal line, but the histogram does not confirm it by having its bars above the zero line, this gives a buy signal, but not a stronger one.
The chart below depicts the MACD providing a strong sell signal:
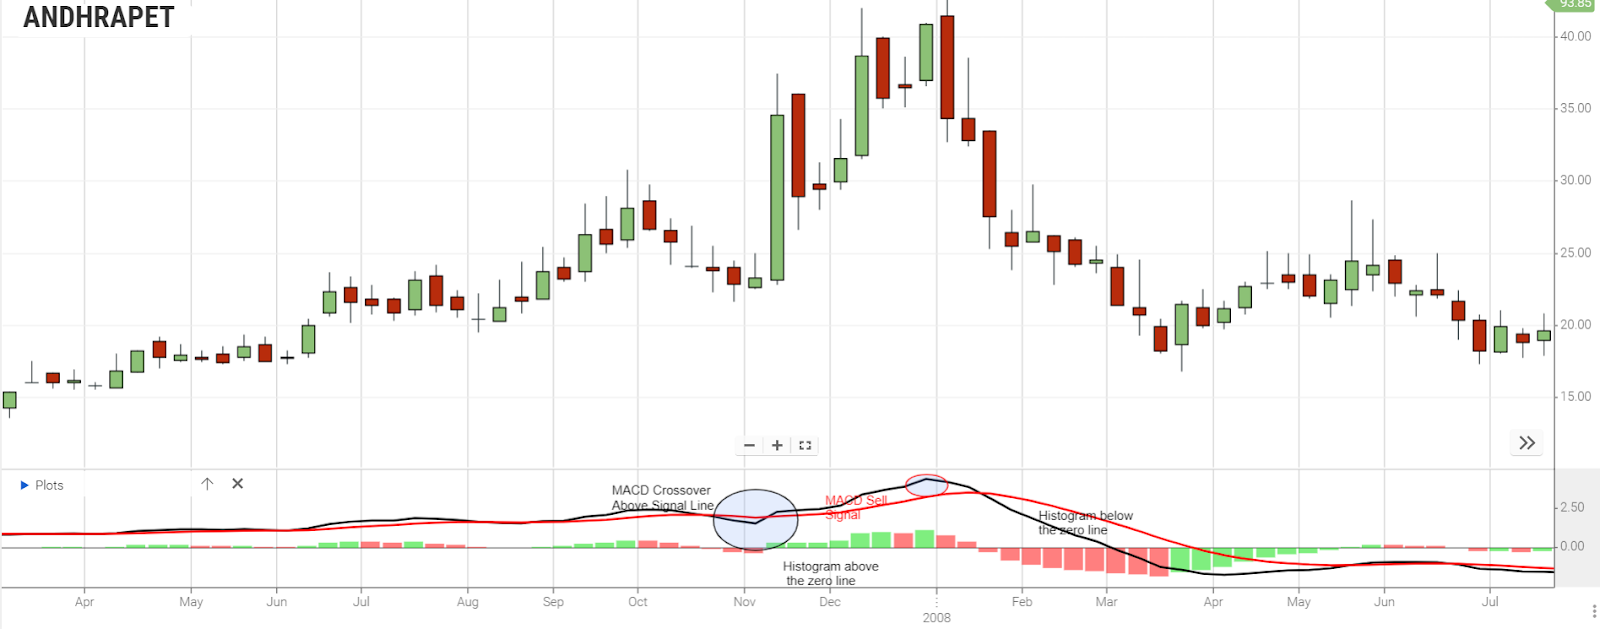
MACD has crossed down below the Signal line
The histogram is below the zero line.
MACD has crossed up above the Signal line
Histogram is above the zero line
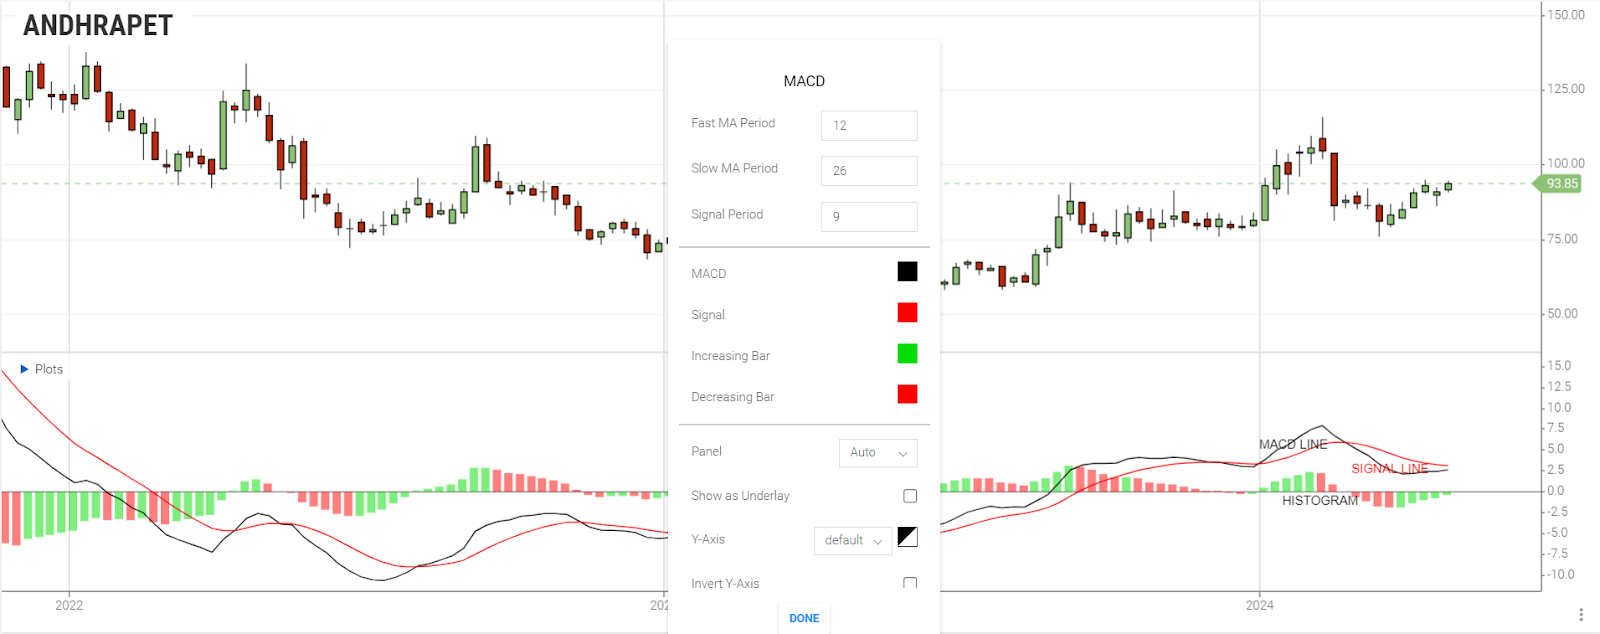
How to change the MACD settings in the Orca Platform?
The standard MACD indicator settings are
Long cycle-26
Short cycle- 12
Signal period -9
Based on how quickly the indicator reacts to price action and how often it gives us trading signals, we can alter these settings.
The illustration chart depicts how the indicator appears under the standard settings:
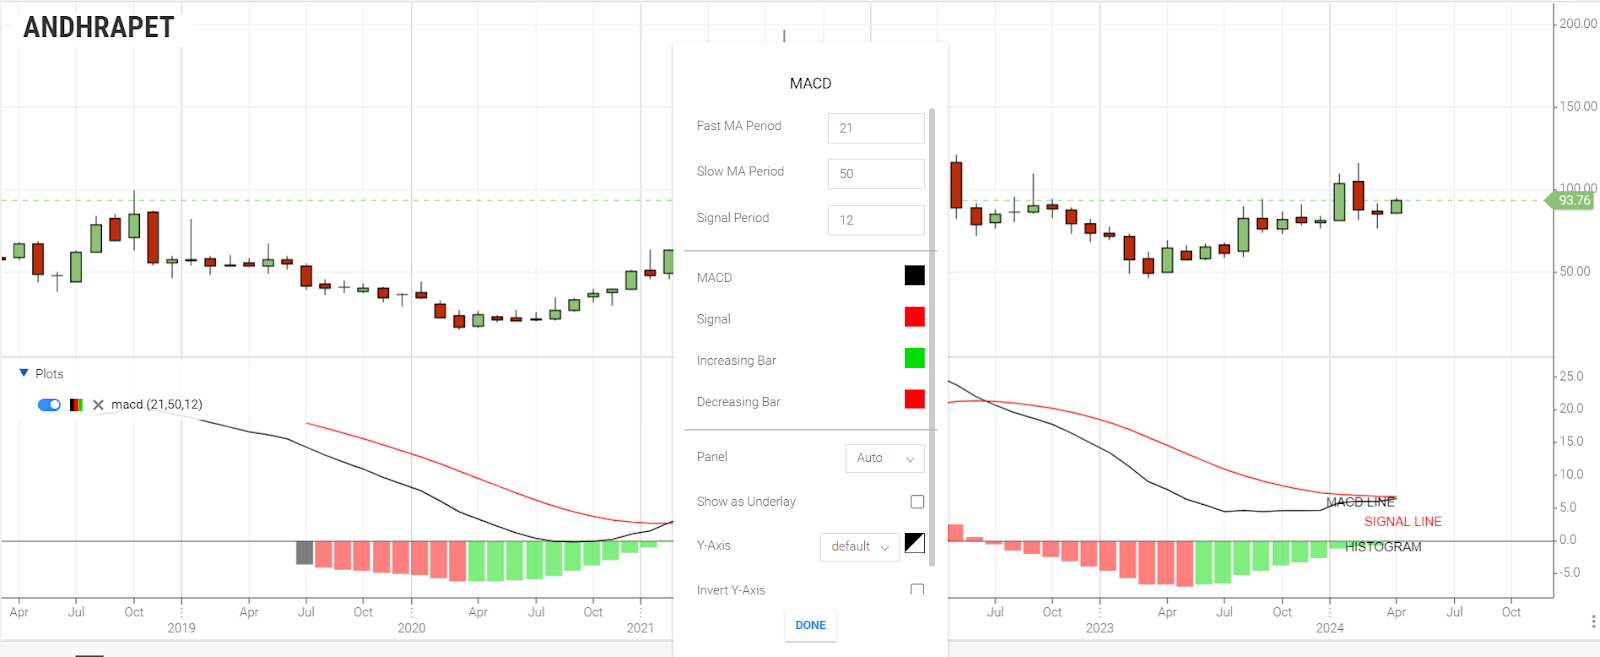
Increasing The MACD Settings
The increase in the settings will slow down the signals.
This will prevent false alerts.
As a result, the genuine moves may be missed. The illustration chart below depicts how the MACD looks when the settings have been increased.
Long cycle-50
Short cycle- 21
Signal period -12
Significantly fewer trading signals are noted.
Decreasing the MACD settings
Opposite effects are noted.
It gives more signals as the indicator becomes sensitive. This results in more false signals.
The illustration chart below depicts how the MACD looks when the settings have been decreased.
Long cycle-13
Short cycle- 6
Signal period -5
Suppose the indicator’s settings have to be changed. In that case, it is necessary to monitor whether our changes improve our trading results, logging and comparing any profit or losses we make from the same trading strategy under different indicator settings.
Summarize
The MACD (Moving Average Convergence/Divergence) line is derived by subtracting the 26-period EMA from the 12-period EMA, while the signal line is a nine-period EMA of the MACD line. Typically applied in daily periods with default settings of 26/12/9 days, MACD generates buy signals upon crossing above the signal line and sell signals upon crossing below. It serves to assess overbought or oversold conditions, indicate the strength of price movements, and highlight potential reversals, especially through bullish/bearish divergences. To confirm a signal line crossover and avoid false moves, it's recommended to wait for three or four days.
While the Moving Average Convergence/Divergence (MACD) is commonly utilized as a trend indicator, it can also function as an oscillator. Its primary role is to assess the direction and strength of price movements, as well as the likelihood of a trend reversal. This analysis aids in identifying potential entry points at the beginning of a trend and exiting before its conclusion, facilitating informed decisions to buy or sell an asset.
The MACD line, a moving average tracking the asset's price, is complemented by the signal line, which is a moving average of the MACD line. The interaction between these lines generates trading signals. The histogram, representing the difference between the MACD and signal lines, provides insight into the momentum of a price move and signals potential trend reversals.
Adjusting the settings can impact the signals: increasing them slows down signals to prevent false indications, while decreasing settings amplifies signals but may lead to more false signals.
Frequently Asked Questions
How to Interpret MACD Indicator?
Interpretation involves understanding events like MACD line crossovers, zero axis crossings, and divergence for insights into trend changes. Analysts use various approaches, and caution is advised against relying solely on MACD signals.
How to Understand MACD Indicator?
The MACD is a momentum indicator that calculates the rate of price change based on two moving averages. Understanding moving averages (MA) is essential, and it's advised not to rely solely on MACD signals for trading decisions.
How to Use MACD Indicator in Orca Trading Platform?
The MACD can be utilized for buy and sell signals on trading platforms. Strong sell signals occur when the MACD crosses below the signal line, confirmed by the histogram below the zero line.
How to Confirm MACD Signals?
To confirm MACD signals and avoid false moves, it's recommended to wait for three or four days after a signal line crossover. This helps filter out potential false signals.
Can MACD be used as an Oscillator?
Yes, besides being a trend indicator, the MACD can also function as an oscillator. It assists in assessing the direction and strength of price movements, enabling strategic entry and exit points in a trend.