Knowledge Center Technical Analysis
Indicators
Using the RSI Indicator
Using the RSI Indicator for Entry Points
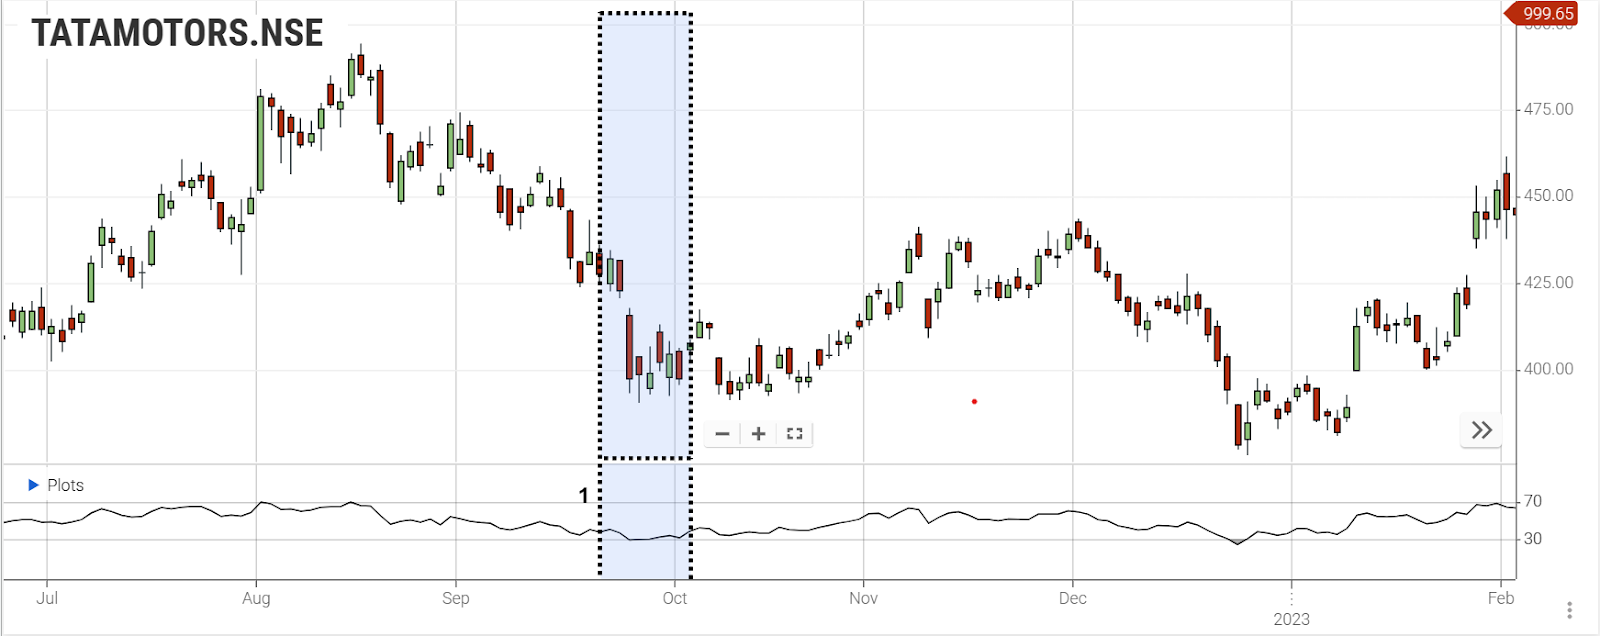
When an asset reaches an extreme point, the RSI indicator can be employed to validate the potential for a reversal. This confirmation allows you to engage in counter-trend trading.

-
RSI reaches 30 level
Using the RSI indicator for Exit Points
You can use the RSI to exit your position when it indicates the conclusion of a trend.

-
Long entry position
-
RSI reaches 70, indicating potentially overbought conditions
-
Potential exit position
Adjusting RSI Settings
You have the option to modify the RSI indicator's settings to increase or decrease its sensitivity to price action changes.
Raising the setting reduces RSI sensitivity, leading to fewer instances of the asset being labeled as overbought or oversold. Consequently, it becomes more challenging to recognize shifts in trend direction.
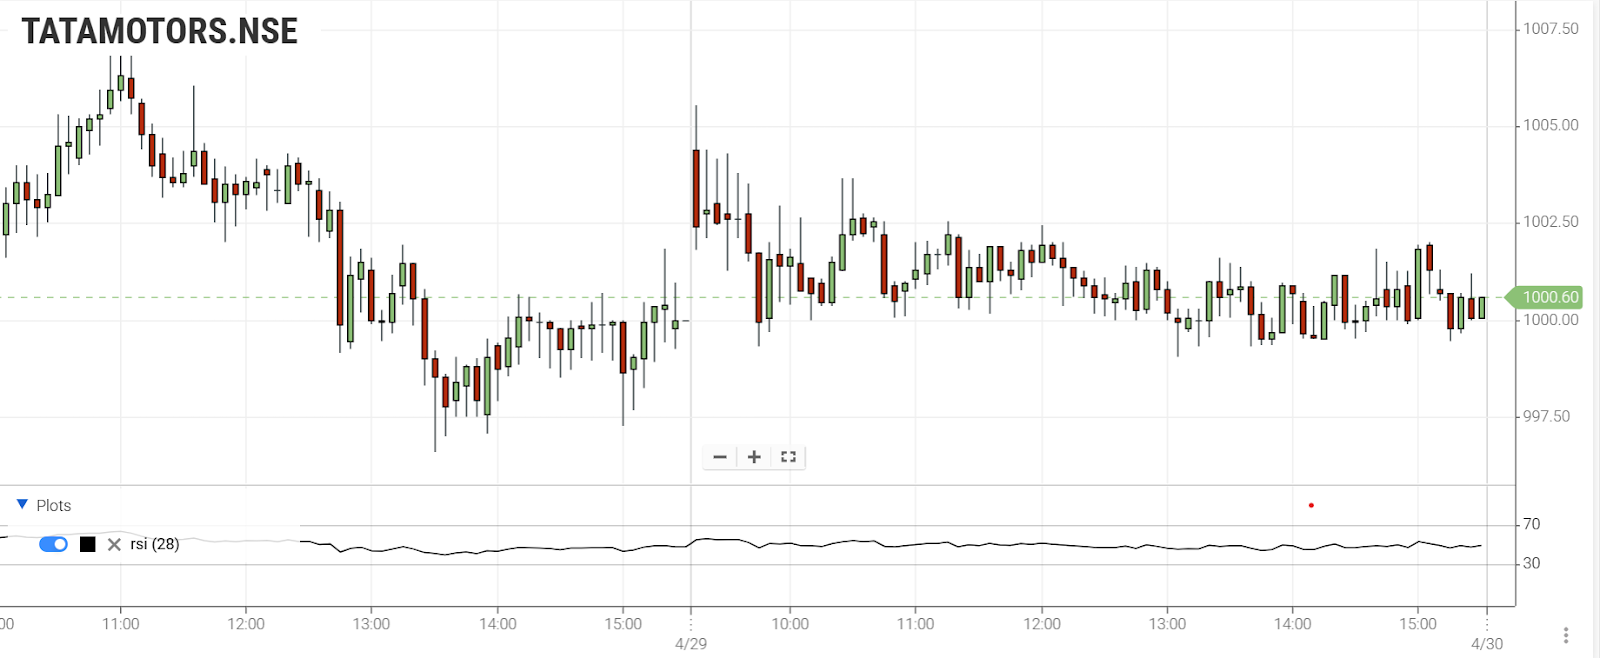
The chart below illustrates the effects of increasing the setting to 28:

As evident from the chart, the indicator rarely signals an overbought or oversold scenario, making it largely ineffective.
Reducing the setting enhances RSI sensitivity, as illustrated in the chart below:

In this example, with the setting at half the standard rate, the indicator line switches between overbought and oversold levels more frequently.
Lowering the settings enables earlier identification of overbought and oversold conditions; however, this also leads to more false signals.
The majority of traders stick to the standard setting of 14, as it provides them with the most valuable and dependable information.
Role of RSI in Day Trading:
-
Day traders often face infrequent RSI signals, but quality trades compensate for this scarcity.
-
To enhance signal frequency, some traders adjust timeframes or use sensitive oscillators, despite the associated risks.
Effective RSI strategies:
-
Reading RSI Indicators: Master reading RSI indicators and interpreting market trends from technical charts.
-
Pairing with Moving Averages: Combine RSI with moving averages to identify strong assets in uptrends, filtering out weaker ones.
-
Utilizing Scanner Software: Monitor stocks closely with scanner software to focus on valuable assets and seize market opportunities.
-
Determining Buying/Selling Points: Analyze high/low bidding conditions to make informed trading decisions, finding the most effective timeframe for your strategy.
-
Adapting to Market Trends: Rely on RSI to follow stock market trends; exercise caution in forex trading to protect your account from losses.
Optimizing RSI Settings for Intraday:
While swing traders commonly use the default RSI setting of 14 periods, day traders experiment with different timeframes for the best results.
Traders adjust RSI settings based on research, aiming for the most suitable timeframe that aligns with their profit goals.
Data-driven decisions guided by RSI signals are essential, indicating when to exit positions and secure profits.
Nutshell
-
Traders have the flexibility to adjust RSI settings for different levels of sensitivity to price movements.
-
Increasing the setting reduces sensitivity, resulting in fewer instances of overbought and oversold conditions being detected.
-
Decreasing the setting heightens sensitivity, capturing more instances of overbought and oversold conditions but also generating more false signals.
-
The standard setting of 14 periods typically yields optimal results, leading traders to rarely alter the RSI settings.
Frequently Asked Questions
-
What is the RSI in the share market?
RSI stands for Relative Strength Indicator, a tool used in stock market analysis to identify overbought or oversold conditions of an asset.
-
How Can I Use RSI for Intraday Trading?
RSI helps in spotting potential entry and exit points in intraday trading. When RSI reaches 30, it indicates a potential buying opportunity; when it hits 70, it suggests a selling opportunity.
-
How Do I Read RSI Indicator Signals?
When the RSI is below 30, it indicates oversold conditions, suggesting a potential buying opportunity. Conversely, when it's above 70, it signals overbought conditions, indicating a potential selling opportunity.
-
Can RSI be used in Nifty and bank Nifty trading?
Absolutely, RSI can be applied to Nifty and Bank Nifty charts, helping traders make effective intraday and day trading decisions in these markets.
-
Are there different strategies for using RSI in day trading?
Yes, there are various RSI strategies for day trading, including trendline analysis, divergence patterns, and combining RSI with moving averages. Traders choose the strategy that aligns with their trading style.
-
Can RSI be used in combination with other indicators?
Yes, traders frequently combine RSI with other indicators like moving averages and MACD for comprehensive market analysis. This combination enhances the reliability of their trading signals.
Remember, practicing with a demo account and continuous learning is essential for mastering RSI and maximizing its potential in trading.
