Knowledge Center Technical Analysis
Indicators
How To Use Bollinger Bands
Bollinger Bands
Bollinger Bands technical analysis tool, invented by John Bollinger in 1983, helps traders to analyze price movements and volatility of the stocks.
A Bollinger band consists of three bands.
-
Upper Band (overbought level)
-
Middle Band (moving average level)
-
Lower Band (oversold level)
It uses simple moving averages to calculate middle band and standard deviation to calculate upper and lower bands. Usually, upper and lower bands are set at a standard deviation (by default by adding and subtracting two times the standard deviation from the SMA, can be modified by the trader) above and below the moving average, incorporating volatility.
Bollinger bands can be applied for various financial instrument like equities, bonds, commodities, options and forex. It is used to identify potential entry and exit points for trades. The Bollinger band tells you when the market is silent and when there is a lot of activity.The Bollinger band is likely to contract when the market demonstrates no movement. Meanwhile, when there is a lot of activity in the market, they begin to expand.
How to Use Bollinger Bands Indicator for Trading
Bollinger Bands should not be solely relied upon for buy or sell signals; they are best used in conjunction with other indicators like the Relative Strength Index (RSI) or chart patterns. When prices touch a band, it can suggest either a trend continuation or a potential reversal. The RSI is particularly useful for identifying overbought or oversold conditions. For instance, when prices touch the upper Bollinger band and the RSI is below 70, it indicates a likely continuation of the trend. Conversely, if prices touch the upper band and the RSI is above 70, potentially nearing 80, it suggests the trend might reverse and prices could decline.
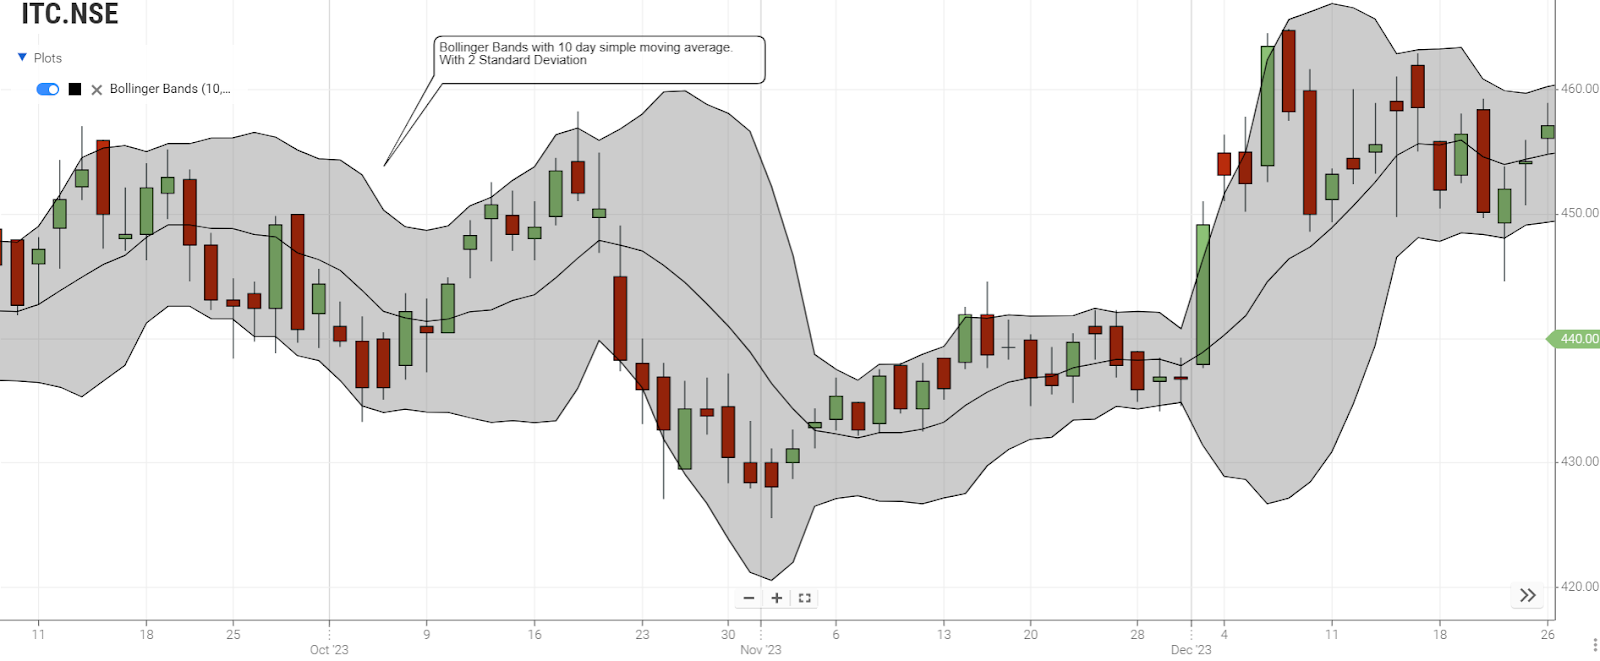
In the above chart , The bands are drawn using 2 standard deviations from a simple moving average with period 10 days. A 10-day moving average is suitable for short-term trades, while a 20-day moving average is better for intermediate trends. For long-term trades, a 50-day moving average is more appropriate to capture the long-term trend. Traders should adjust the band's period based on the duration of their trading strategies.
Bollinger Bands Strategy
1. RSI Strategy
While the Bollinger Bands indicator effectively pinpoints value areas on a chart, it doesn't inherently reveal the strength or weakness of a move. To address this, the Relative Strength Index (RSI) comes into play, particularly looking for divergence signals. A bearish divergence (indicating weakness) occurs when the market makes a higher high but the RSI shows a lower high. Conversely, a bullish divergence (indicating strength) occurs when the market makes a lower low but the RSI shows a higher low. Applying this to Bollinger Bands, bearish RSI divergence near the upper band signals weakness, while bullish RSI divergence near the lower band indicates strength.
2. Options Trading Strategy
Bollinger Bands prove crucial in adapting to volatile market conditions, particularly in options trading. By identifying periods of low volatility or consolidations when the bands squeeze together, options traders can anticipate price breakouts. These breakouts present opportunities for strategic trades, such as long straddles or strangles in volatile markets and short straddles or strangles in less volatile markets.
3. Moving Average Strategy
Expanding the scope of Bollinger Bands strategies, combining them with a 200-period Simple Moving Average (MA) offers insights into price action. When the price is above the MA200, indicating an uptrend, look for buy signals. Conversely, if the price falls below the MA200, consider exiting the market. This strategy integrates longer-term perspectives, making it effective for trend-following.
4. MACD Trading Strategy
Integrating the Moving Average Convergence Divergence (MACD) indicator with Bollinger Bands enhances strategy effectiveness. The points where MACD Moving Averages cross below the histogram serve as triggers. Combined with Bollinger Bands, this strategy involves observing the price hitting the lower band for long trades, creating a comprehensive approach to market analysis.
5. Price Action Strategy
While Bollinger Bands are potent, their effectiveness can be amplified when coupled with the Price Action strategy, avoiding additional indicators. This strategy focuses on two main signals: the price reaching one of the envelope's borders and a Price Action signal. By incorporating these elements, traders can navigate market dynamics with enhanced clarity.
Summary
Bollinger Bands are a popular tool among technical traders for identifying trade rebounds. Consisting of an upper band, a lower band, and a middle average band, they indicate potential price reversals as prices tend to return to the middle band. Traders often use these bands as dynamic support and resistance levels.
For optimal results, traders often use Bollinger Bands on higher time frames. Many successful trading strategies are based on these bands, particularly in ranging or sideways markets.
There are several key indicators to watch for when using Bollinger Bands. A tightening of the bands suggests a breakout is imminent. Additionally, when a candle breaks above or below the bands, it usually signals a move towards the middle band.
While Bollinger Bands can be effective, they should not be relied upon as the sole basis for trading decisions. They are best used in conjunction with other tools and techniques. Proper risk management, including setting stop-loss levels, is crucial for success in trading. Always have a stop loss in place before entering a trade.
Frequently Asked Questions
How does Bollinger Bands work?
Bollinger Bands operate based on price movements, offering traders insights into the market's direction. The process involves three bands: one for the moving average, one for the lower level, and one for the upper level. Approaching the upper band may indicate overbought conditions in the market.
What insights do Bollinger Bands provide?
Bollinger Bands are valuable for identifying relative high and low points in price. Both upper and lower bands, in conjunction with a moving average, are used in pairs. It's essential to note that these two bands are most effective when utilized together and not in isolation.
Is Bollinger Bands a reliable indicator?
Bollinger Bands serve as a useful tool for identifying potential entry and exit points, along with highlighting quick, short-term price swings. Recognized for their versatility and user-friendly visual analysis, Bollinger Bands® prove beneficial for a diverse range of traders.
Brief On Bollinger Band Breakout Strategy?
-
Identify Squeeze Patterns:
Watch for Bollinger Bands contracting, indicating low volatility and potential breakout opportunities.
-
Trade the Breakout:
Enter a trade when prices break above the upper band for a potential uptrend or below the lower band for a potential downtrend.
-
Confirm with Volume:
Confirm breakouts with increased trading volume to validate the strength of the move.
How To Read Bollinger Bands?
1. Central Tendency
The middle band (SMA) represents the average price over a specified period, indicating the central tendency of the stock.
2. Volatility Signals
Widening bands suggest increased volatility, while narrowing bands indicate lower volatility and potential upcoming price movements.
3. Overbought/Oversold Conditions
Prices touching or exceeding the upper band may signal overbought conditions, while touching or falling below the lower band may indicate oversold conditions.