Knowledge Center Technical Analysis
Moving Averages
Moving Average Indicator
The moving average is a popular tool used in trading. It shows the average price of an instrument over a set period of time, displayed as a line on a chart. This line is created by averaging prices over a specific number of periods, often using closing prices.
Traders use it to understand-
-
market conditions and
-
decide when to enter or exit trades.
Examples to Understand Moving Average
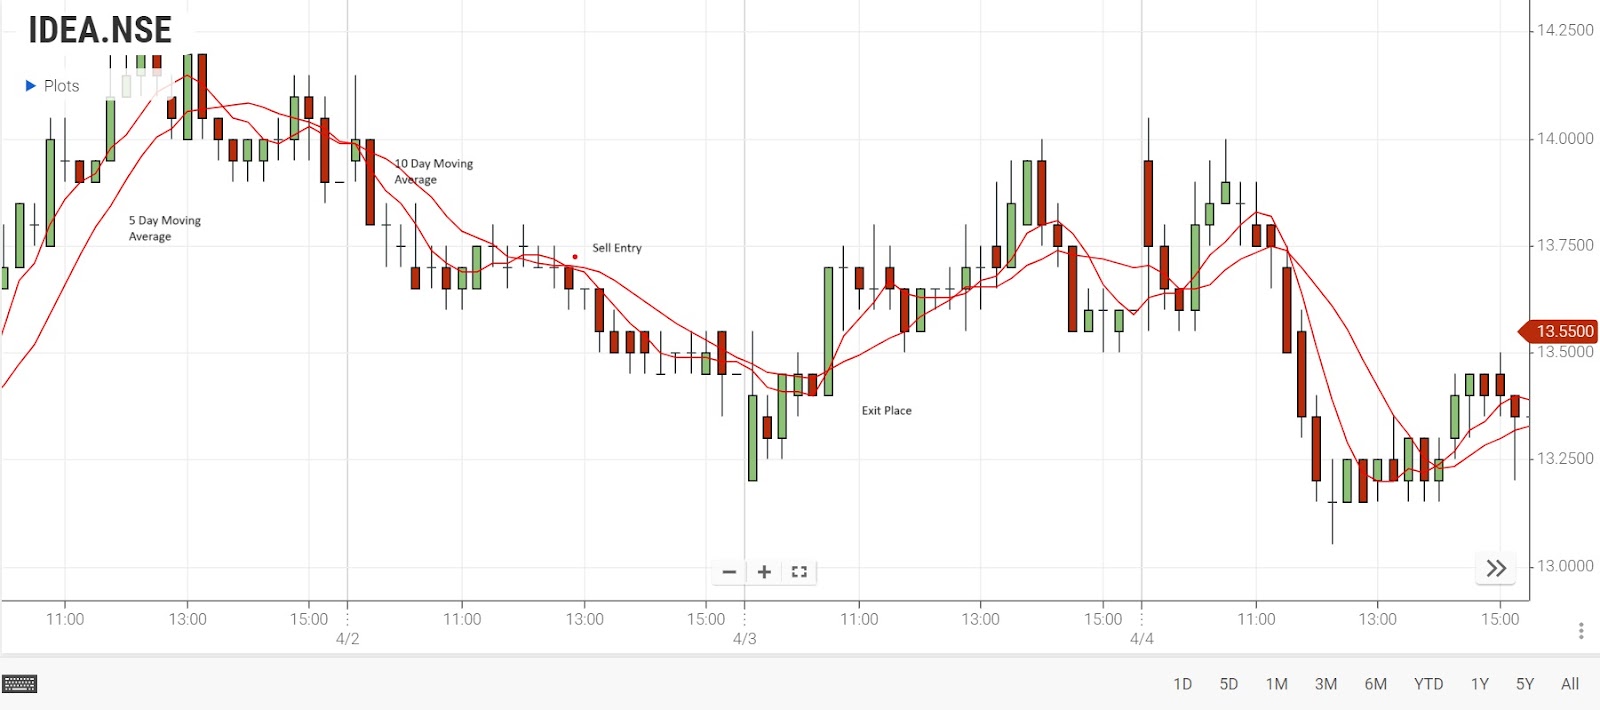
Looking at the chart, you can see two lines: one for the average of the past 5 days and another for the past 10 days. These lines show if the stock is going up or down in the short and slightly longer terms.
Here's how to understand the lines on the chart:
-
If the line is going up sharply, it means the stock is rising quickly in the short term.
-
If the line is nearly flat, it shows a slower short-term trend.
-
If the line is going down steeply, it means the stock is dropping fast in the short term.
Traders use these lines to decide when to buy or sell. If the stock price is above the line, it's in a short-term uptrend. If it's below, it's in a short-term downtrend. Remember, the exact trend depends on the specific time frame you're looking at. The shorter 5-day line tells you about very recent trends, while the 10-day line gives a slightly longer-term view. By considering both lines, traders can understand how the stock is behaving and make smart trading choices.
Types of Moving Averages-
There are nine types of moving averages:
-
Simple moving average (SMA)
-
Exponential moving average (EMA)
-
Double Exponential Moving Average (DEMA)
-
Triple Exponential Moving Average (TEMA)
-
Linear Regression
-
Displacing the moving average
-
Time Series Forecast (TSF)
-
Wilder moving average
-
Weighted moving average
Key Takeaways
-
Moving averages reflect average prices over specific periods.
-
They help identify trends in trading.
-
The main types include simple, exponential, linear weighted, and smoothed moving averages.
-
Trade-off: reliability versus quick reaction to trend changes.
-
Used as support/resistance levels in trading.
Frequently Asked Questions:
-
What are the different types of moving averages in technical analysis?
There are four main types: simple, exponential, linear weighted, and smoothed moving averages.
-
What is a moving average in the stock market?
A moving average is the average price of a stock calculated from the closing prices over specific periods, helping traders identify trends.
-
Is a rolling average the same as a moving average?
Yes, a rolling average is another term for a moving average, representing average values over specific time frames.
-
How are moving averages used in technical analysis?
Moving averages serve as indicators helping traders identify trends, potential support/resistance levels, and crossovers indicating trend shifts.
-
What is a running average in stock trading?
A running average is the continuous calculation of average values over a changing set of data points, often used for trend analysis in stock trading.