Knowledge Center Technical Analysis
Moving Averages
Exponential Moving Average
The Exponential Moving Average (EMA) in the stock market is a type of moving average that assigns greater significance to the latest data points. Employed to assess bullish and bearish trends in securities over a specific duration, it provides a dynamic perspective on the market's directional movements.
What Is Exponential Moving Average in Trading?
Exponential Moving Average (EMA) is a technical analysis indicator used in trading to smooth out price data and identify trends over a specified time period. Unlike the simple moving average, EMA gives more weight to recent prices, making it more responsive to market changes. Traders use EMA to analyze price movements, identify potential entry or exit points, and gauge the strength of a trend. It is a valuable tool for trend-following strategies, providing a dynamic perspective on market trends by prioritizing recent price action in the calculation. EMA calculations involve a continuous update of averages as new data points emerge, allowing traders to adapt to evolving market conditions.
EMA Calculator
The Moving Average Exponential incorporates all price data in its current value, giving greater importance to the most recent price data while minimizing emphasis on older price data.
EMA moving average was developed to address limitations of SMA, involving a three-step calculation process.
At First, the SMA is calculated by dividing the sum of closing prices over a specific timeframe by the total number of observations. For instance, in a 30-day SMA, the sum of closing prices for the last 30 trading days is divided by 30.
The second step involves determining the multiplier, computed using the formula
{2/ (total number of observations + 1)}
resulting in 2/31 or 0.06451 (6.451%) for a 30-day period.
Finally, to calculate the Exponential Moving Average (EMA), the formula is
EMA = [Closing Price of the Stock Market x the Multiplier] + [Previous Day EMA x (1- the Multiplier)].
This unique calculation enables EMAs to closely track the prices of a financial instrument compared to their corresponding SMAs.
Exponential Moving Average Strategy
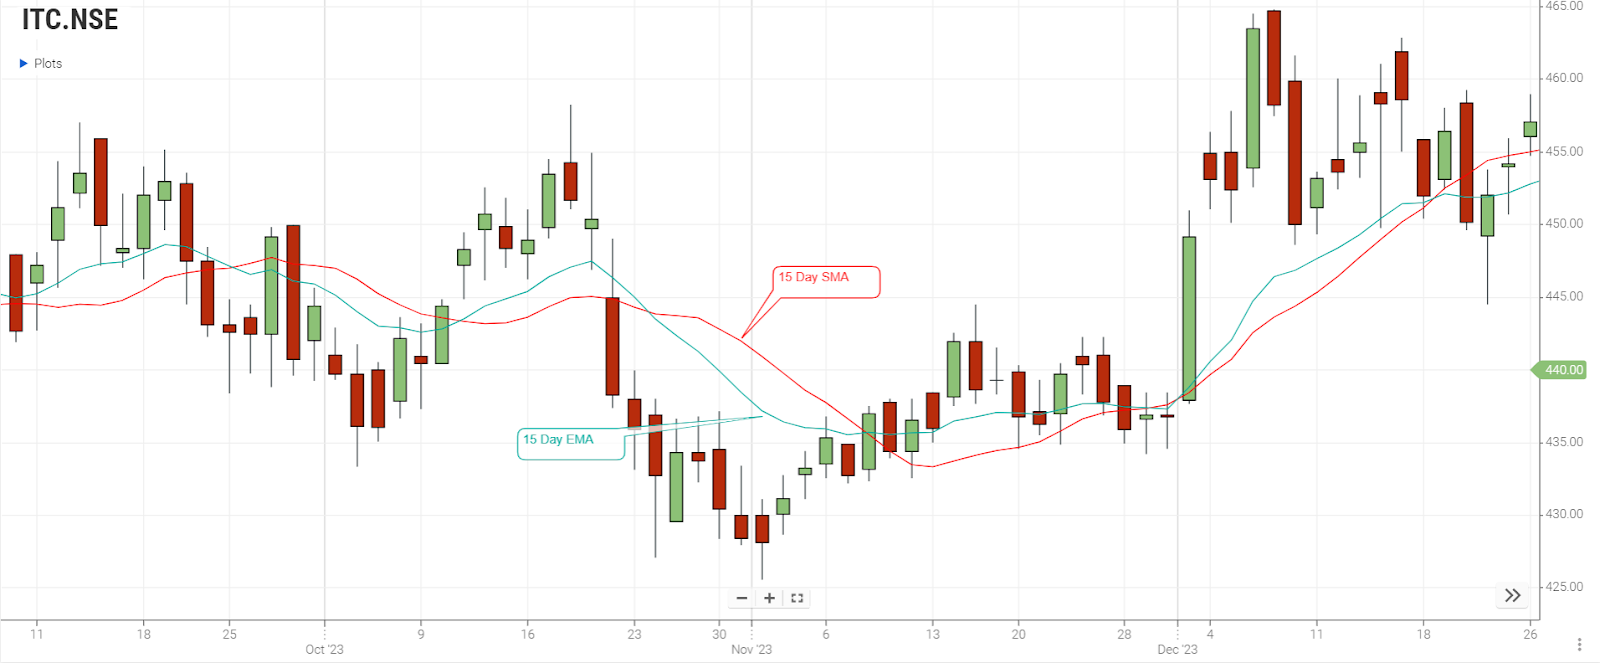
Exponential Moving Average (EMA) & the Simple Moving Average (SMA) are more or less the same in measuring the trend direction over a period of time. The difference occurs where (EMA) emphasizes more on the ‘recent prices’ i.e., current data and the (SMA) calculates only the average of price data.
Consider the above chart were,
-
15 Days Simple Moving average -SMA (Orange line)
-
15 Days Exponential Moving Average- EMA (Blue Line)
How Does the EMA Indicator Work?
The method that we adopt (SMA) would be the same when analyzing (EMA). We need to know that the (EMA) focuses more on the price movement. (EMA) would help us like two sides of a coin. It can help us to “identify trends quicker” than an (SMA) & at the same time when comparing an (SMA), more “short-term changes” will be noted in (EMA).
EMA Application in Trading
To find out the trend direction & trade in that direction EMA can be applied.
When EMA rises: We may look at buying when prices dip near or just below the EMA.
When EMA falls: We may look at selling when prices meet towards or just above the EMA.
Moving averages also indicate Support and Resistance areas. When there is a raise in the EMA, it supports the price action and when there is a fall in the EMA, it provides resistance to price action.
We should understand another important point here. The EMA & other moving averages do not help us to identify a trade at the exact bottom & top. There will be a delay at the entry & exit points although the moving averages assist our trading in the general direction of a trend. The EMA has a shorter delay compared to the SMA with the same period.
Difference Between EMA vs SMA
SMA lacks the speed to swiftly adapt to sudden price fluctuations, making it suitable for traders with long-term positions. These calculations serve to filter out noise from random price movements, helping identify the market trend. However, SMAs struggle to represent rapid shifts in market sentiment and do not give weight to traders' actions.
On the other hand, EMA's calculation process allows it to respond promptly to quick changes in price points. It is favoured for shorter time periods and dynamic markets, showcasing the ability to capture rapid shifts in market sentiment. EMA places significance on the actions of market participants, offering a more responsive and up-to-date perspective in the stock market.
While SMA is preferred for long-term positions and trend identification, EMA excels in responsiveness to quick market changes, catering to shorter time frames and fast-moving markets. Both indicators, despite their distinctions, play crucial roles in trading analysis.
Advantages of Exponential Moving Average:
Identifying and Confirming Market Trends: One fundamental function of EMA is its ability to signal market trends. An upward direction of the EMA line indicates an uptrend, while a downward direction suggests a downtrend. Traders can use the EMA's position relative to the asset's price to anticipate potential market movements, guiding their buy and sell decisions.
Acting as Support and Resistance Bands: Similar to other moving averages, the EMA exponential moving average serves as support and resistance bands for financial instrument prices. These levels, also known as floors and ceilings, help traders anticipate potential price movements. Support levels indicate the price floor beyond which an asset is unlikely to fall, while resistance levels signify a price ceiling that an asset may struggle to surpass.
Sensitivity to Price Movements: EMAs are notably faster than SMAs in reflecting rapid price fluctuations. This heightened sensitivity allows EMAs to identify trends more quickly than their counterparts, making them valuable for traders aiming to stay ahead of market shifts.
Limitations of Exponential Moving Average:
Despite the advantages mentioned above, EMAs are not without limitations:
Weight on Recent Data Points: EMAs give more weight to the most recent data points, a feature that some traders appreciate for providing a better reflection of the current trend. However, others caution that this emphasis on recent data might lead to more false alarms.
Efficiency of Financial Markets: Some economists argue that financial markets are efficient, meaning current market prices already incorporate all relevant information. This perspective questions the utility of historical data in predicting the future value of a financial instrument.
The choice between moving average methods depends on traders' investment strategies. While the exponential moving average often takes precedence due to its emphasis on recent price points, careful analysis of each moving average method is crucial for effective incorporation into trading practices.
Frequently Asked Questions
What Is EMA in Stock Market?
EMA (Exponential Moving Average) in the stock market is a dynamic indicator that gives more weight to recent price data, providing a responsive measure of trend direction.
What Is Exponential Moving Average in Stocks?
Exponential Moving Average (EMA) in stocks is a dynamic trend-following indicator that places greater emphasis on recent price data, aiding in the analysis of price trends and potential entry or exit points.
What Is EMA Full Form in Stock Market?
EMA in the stock market stands for Exponential Moving Average, a dynamic indicator used to analyze price trends with a focus on recent data points.
When comparing EMA and SMA which is better?
When comparing EMA and SMA, EMA assigns greater significance to recent data, tends to be more responsive to the latest price changes than SMA. Consequently, EMA's results are perceived as timelier, leading to its preference over SMA in many cases.
Under what circumstances should one employ the Exponential Moving Average (EMA)?
EMA proves beneficial for traders aiming at short-term intraday profits, given its ability to swiftly capture changes in price trend direction. Nevertheless, its application may vary based on individual traders and their specific trading strategies.