Knowledge Center Technical Analysis
Moving Averages
Triple Exponential Moving Average (TEMA)
The Triple Exponential Moving Average (TEMA) serves as a valuable tool in trading for discerning trends and potential trading opportunities through technical analysis. A modification of the conventional Exponential Moving Average (EMA), TEMA employs three EMA calculations to diminish lag and enhance the precision of trend identification.

Unlike traditional moving averages (MA), TEMA is adept at smoothing price fluctuations, facilitating easier trend identification without the typical lag.
This is achieved by conducting multiple exponential moving averages (EMA) on the original EMA and mitigating some of the inherent lag. Similar to other MAs, TEMA is utilized to ascertain trend direction, signal potential short-term trend changes or pullbacks, and establish support or resistance levels.
It is worthwhile to compare TEMA with the double exponential moving average (DEMA) for a comprehensive understanding of its effectiveness in trading analysis.
Objectives Of TEMA
-
smooths price and other data.
-
Reduces lag in individual exponential moving averages.
-
Can be employed as a replacement for traditional moving average methods or other indicators.
-
Serves as a momentum indicator, also known as TRIX, to identify "overbought and oversold markets."

Calculation Based On The Chart
-
EMA = 15-day Exponential Moving Average of the closing price.
-
Double EMA = 15-day Exponential Moving Average of the closing price.
-
Triple EMA = 15-period Exponential Moving Average of the closing price.
-
TRIX = 15-day Triple EMA for identifying overbought and oversold conditions.
-
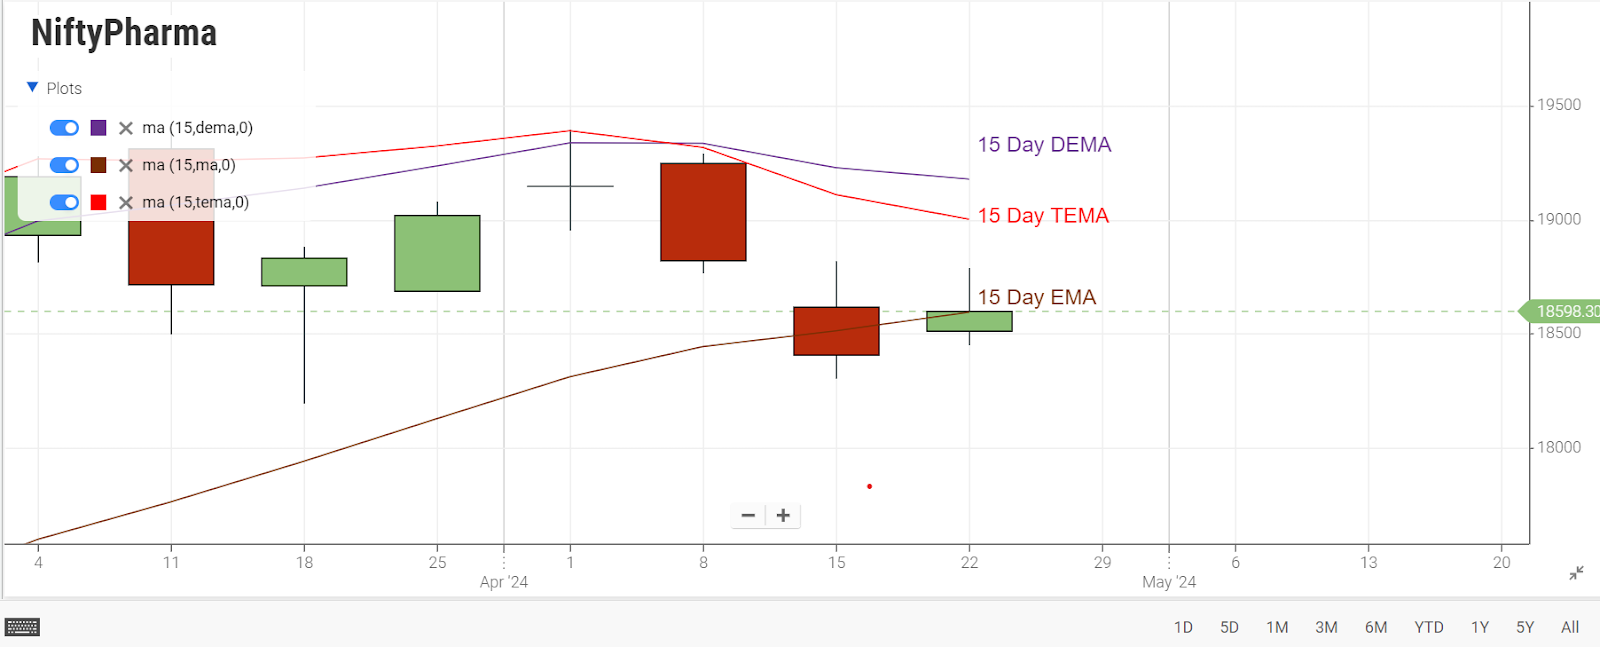
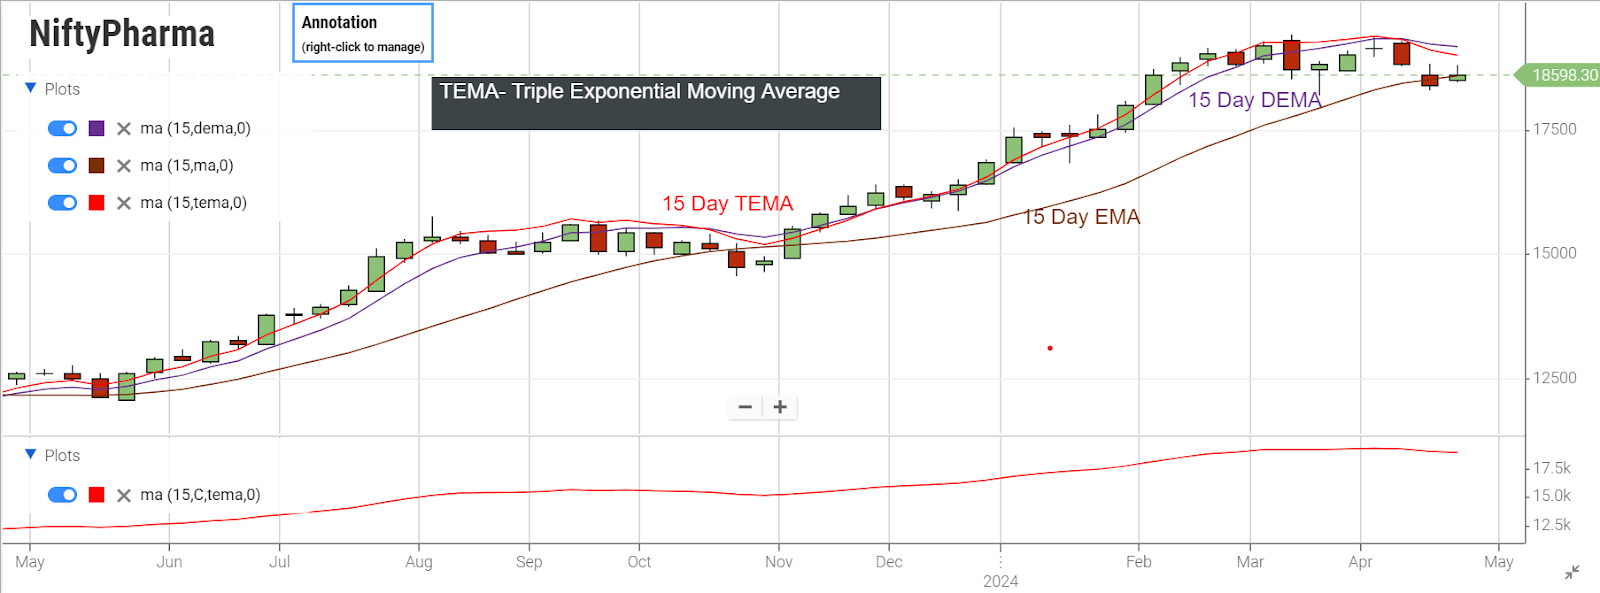
The red line represents the 15-day EMA, closely tracking the price plot. It is the most volatile of the three lines.
-
The green line corresponds to the double EMA.
-
The blue line reflects the triple EMA.
-
The two lines flatten as the lag increases.
-
TRIX Analysis:
-
When the triple 15-day EMA is declining, TRIX is negative.
-
Conversely, when the triple 15-day EMA is ascending, TRIX is positive.
-
The additional smoothing helps minimize abrupt upturns and downturns.
-
Reversing a downtrend requires more than a one-day advance.
Triple Exponential Average (TRIX)
The triple exponential average (TRIX) is a momentum indicator employed by technical traders to reveal the percentage change in a moving average that has undergone exponential smoothing three times. This triple smoothing of moving averages aims to eliminate price movements deemed insignificant or unimportant. Technical traders use TRIX to generate signals akin to those produced by the moving average convergence divergence (MACD).
TRIX as a Momentum Indicator:
-
It indicates a negative value in an oversold market and a positive value in an overbought market.
-
A negative value implies decreasing momentum, while a positive value suggests increasing momentum.
Analyst Recommendations:
-
Purchase Signal: Indicated when TRIX crosses above the zero line.
-
Sell Signal: Signaled when TRIX closes below the zero line.
Key market turning points can be determined by assessing the variance between price and TRIX.
When employing TRIX as a leading indicator, it is recommended to combine it with another market timing indicator to minimize the occurrence of false signals.
Calculating TRIX
First, the exponential moving average of a price is calculated using the expression:
EMA1?(i)\=EMA(Price,N,1)
where:
-
Price (i) represents the current price.
-
EMA1?(i) is the current value of the Exponential Moving Average.
Next, the second smoothing of the obtained average is performed through double exponential smoothing:
EMA2?(i)\=EMA(EMA1?,N,i)
The double exponential moving average is then smoothed exponentially once more, resulting in the triple exponential average:
EMA3?(i)\=EMA(EMA2?,N,i)
Now, the indicator itself is derived using the formula:
TRIX(i)\=EMA3?(i)−EMA3?(i−1)EMA3?(i−1)?
Where:
-
EMA3?(i−1) represents the EMA3 value at the previous time point.
-
EMA3(i) is the EMA3 value at the current time point.
A data series undergoes a two-step Exponential Moving Average (EMA) process. Initially, an EMA is calculated for a specified period, followed by a second EMA on the obtained result for the same duration. Subsequently, a third EMA is computed for the second result. The percentage change in the value of this third moving average is then designated as the TRIX. At the start of the data series, TRIX is set to zero. Given its use of EMA, the initial calculations involve zero values. Values beyond three times the specified period can be disregarded in its computation.
Frequently Asked Questions
-
What is the TEMA indicator, and how does it differ from a Triple EMA strategy?
The TEMA (Triple Exponential Moving Average) Indicator, a trading app , differs from a Triple EMA (Exponential Moving Average) strategy. TEMA utilizes a triple smoothing process to reduce lag and enhance trend identification, whereas the Triple EMA strategy relies on three consecutive EMAs for trend analysis.
-
Can you explain the concept of the Triple Exponential Moving Average (TEMA) and its significance in trading?
TEMA is a variation of the traditional Exponential Moving Average (EMA), employing three EMA calculations to enhance trend identification and reduce lag in trading analysis. Its significance lies in its ability to smooth price fluctuations and provide more accurate signals for identifying trends and potential trading opportunities.
-
How does the Triple Moving Average Crossover differ from the Triple Moving Average Strategy in terms of trading signals?
The Triple Moving Average Crossover is a bullish signal indicating a potential upward price movement, whereas the Triple Moving Average Strategy encompasses a broader approach involving the use of three consecutive moving averages to formulate trading decisions based on their crossovers and relationships.
-
Could you provide an overview of the Triple EMA Strategy and its application in technical analysis?
The Triple EMA Strategy uses three consecutive Exponential Moving Averages to analyze trends and trading opportunities. Traders observe crossovers and relationships between these averages to make informed decisions on market entry or exit points in technical analysis.
-
What distinguishes the Triple Exponential Moving Average from a traditional Exponential Moving Average, and how is it utilized in trading strategies?
The Triple Exponential Moving Average (TEMA) stands out from traditional EMAs with its triple EMA calculations, enhancing smoothing and trend identification. TEMA minimizes lag, and delivers precise trend signals, aiding traders in making informed decisions based on smoothed price data.
